2391
Oxycodone BOLD activation and connectivity signature by Mu opioid receptor in anaesthetized mice fMRI1Douglas Mental Health University Institute, Department of Psychiatry, Mcgill University, Montreal, QC, Canada, 2Center for Translational Neuro-Imaging, Northeastern University, Boston, MA, United States
Synopsis
Mu opioid receptors (MORs) mediate biological effects of oxycodone, including their analgesic and euphoric properties. To assess the effect of oxycodone on neuronal communication, we used non-invasive mouse fMRI and tested oxycodone effects in both wild-type and MOR-knockout mice in order to extract MOR-dependent effects. Analysis was performed 2 to 7 minutes after drug administration, a time where BOLD activation was minimal in knockout animals. Here, we show that oxycodone reduces functional activity of the Nucleus Accumbens seed with several brain regions, establishing a first receptor-mediated FC connectivity signature of a MOR agonist.
Target audience
Drug
addiction, analagesia, opioids, Translational and clinical studiesPurpose
In the area of psychiatric disorders, success in developing effective drugs from highly promising molecular targets has been limited. Although drug-induced molecular processes are well understood at the cellular level and behavioural effects have been characterized in animal models the overall impact of target activation and inhibition on neural network structure, neurochemistry and connectivity at the whole brain level remains largely unknown. Our goal is to develop a new functional magnetic resonance neuroimaging (fMRI) platform to screen novel drugs and establish whole brain functional connectivity (FC) signatures of drugs of interest in the area of psychiatric disorders. Here we present a proof-of-principle study based on mu opioid receptor (MOR) responding to an opiate drug in the living mice. MOR is expressed in brain areas belonging to pain and addiction circuits. Moreover, MORs contributes to rewarding effects of other drugs of abuse1 and natural rewards (as food and social interactions)2-3. Here, we tested whether functional MRI in live animals would reveal connectivity changes in MOR enriched regions after Oxycodone injection.Methods
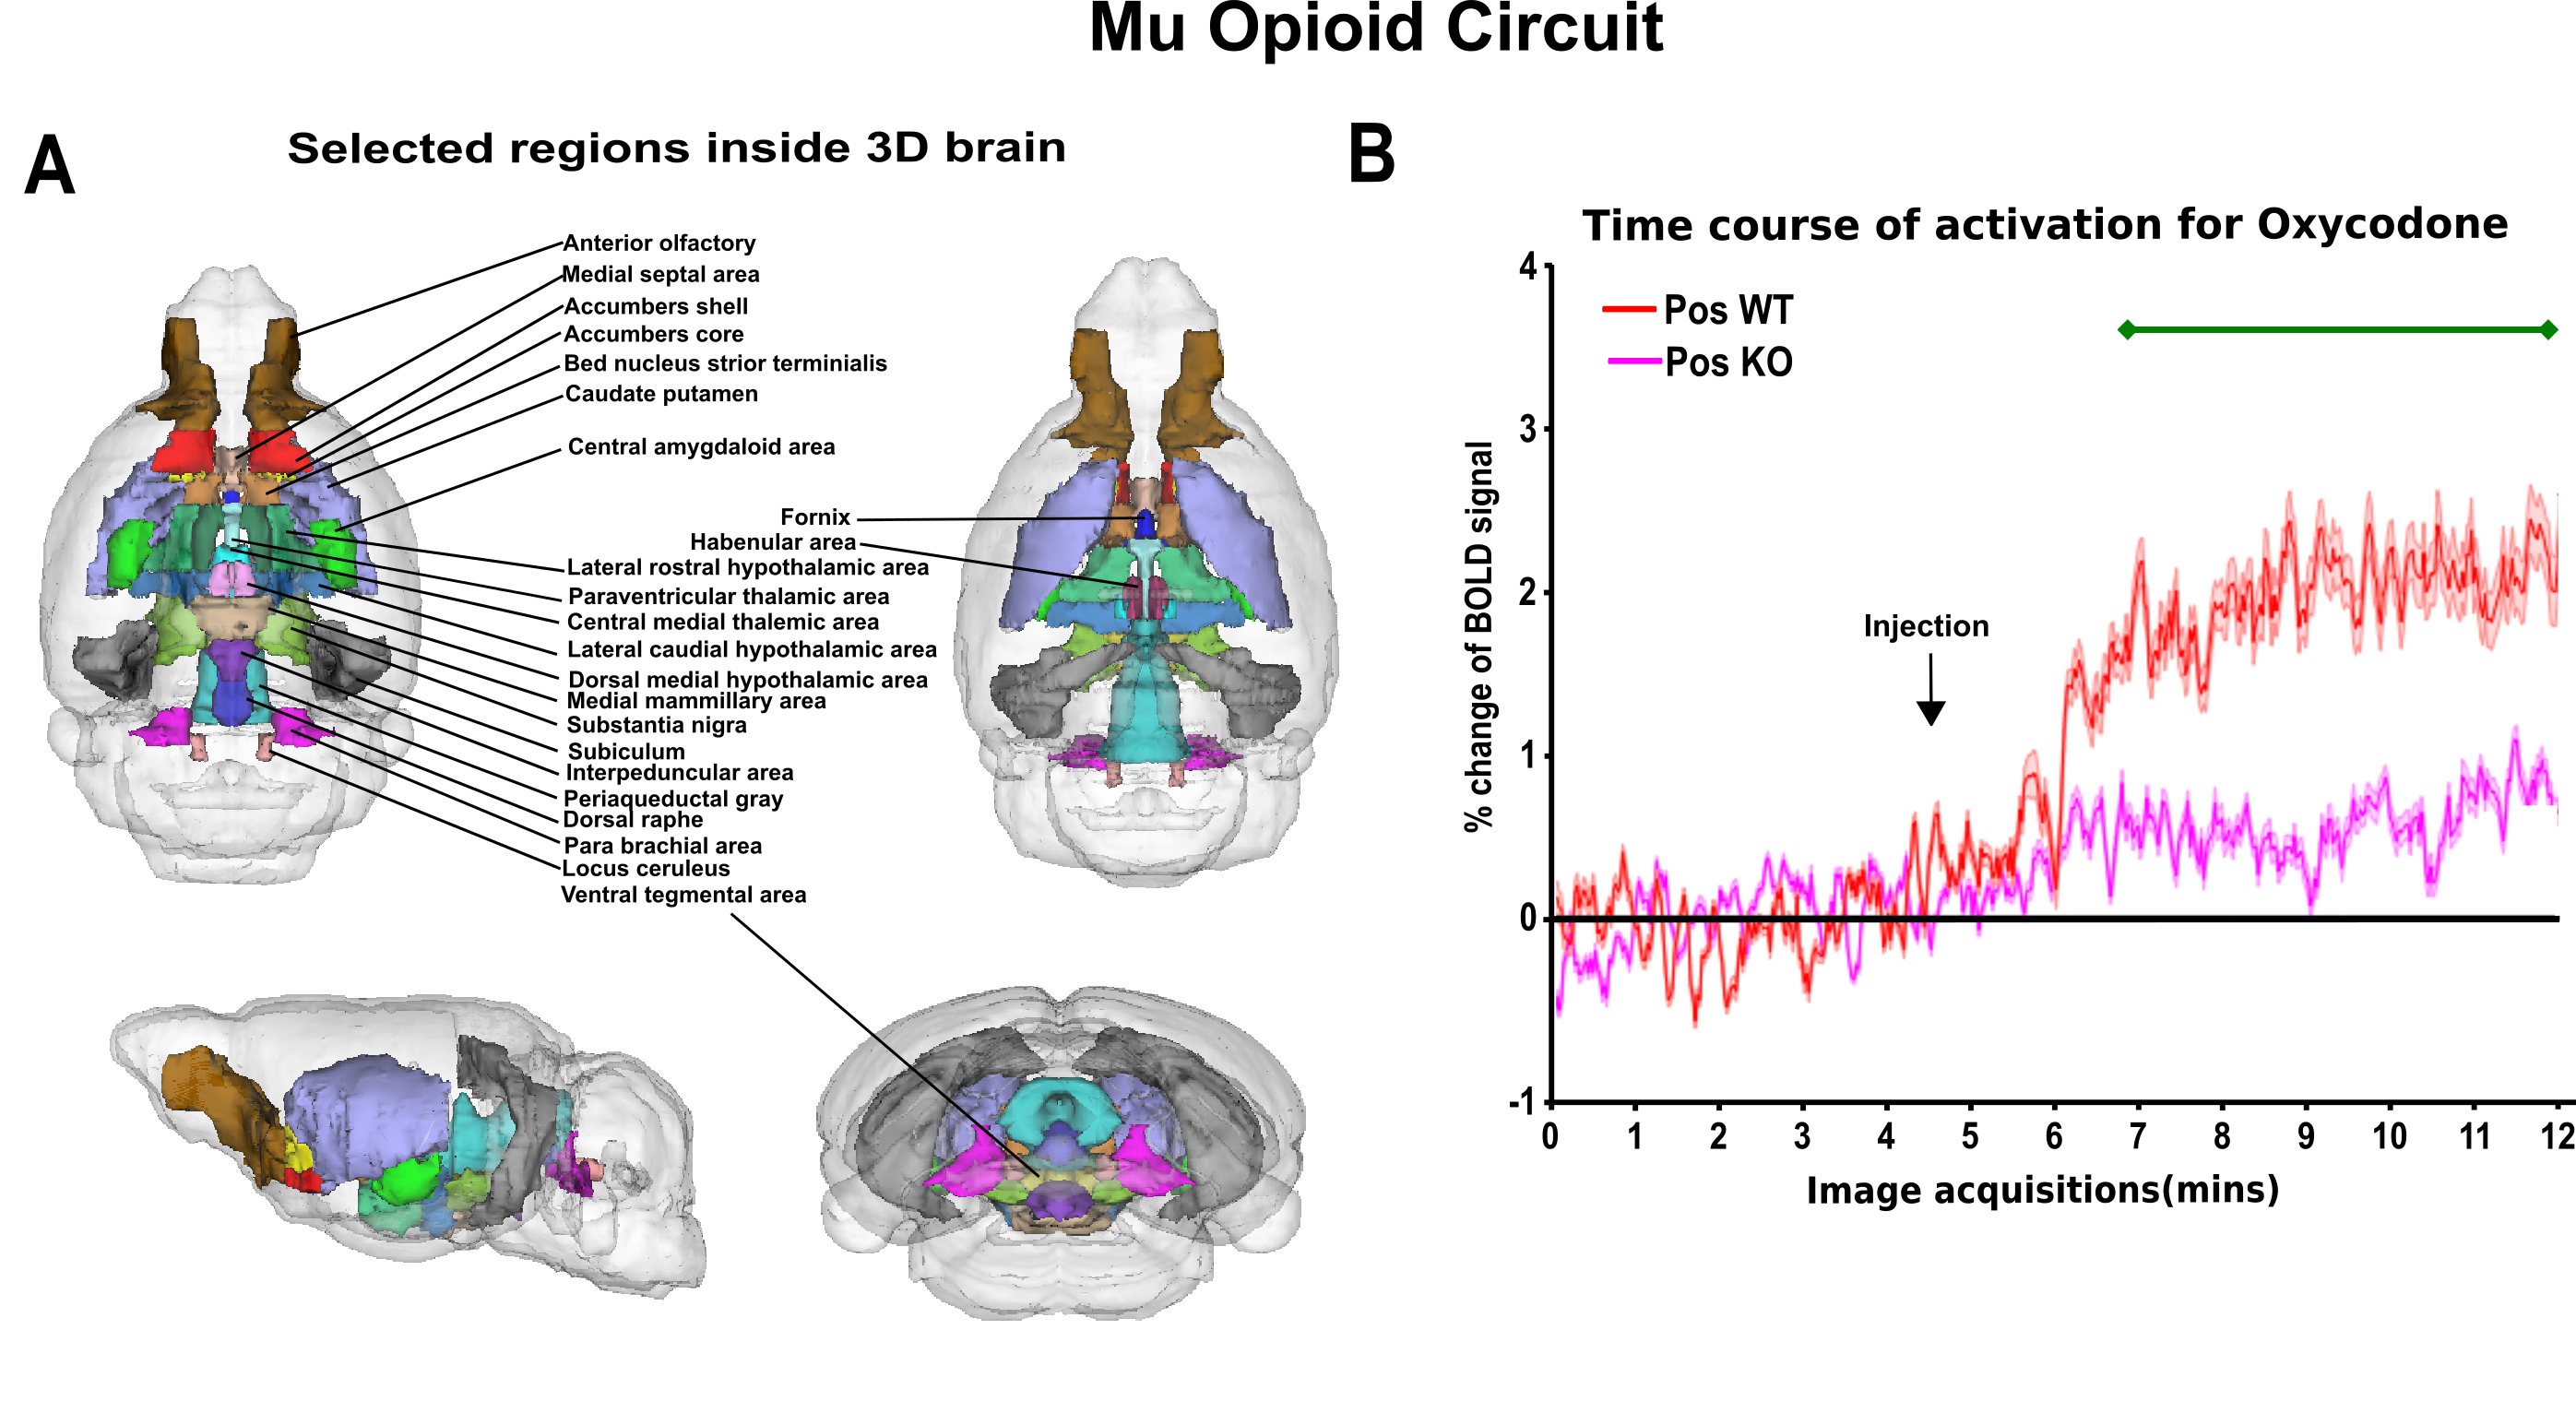
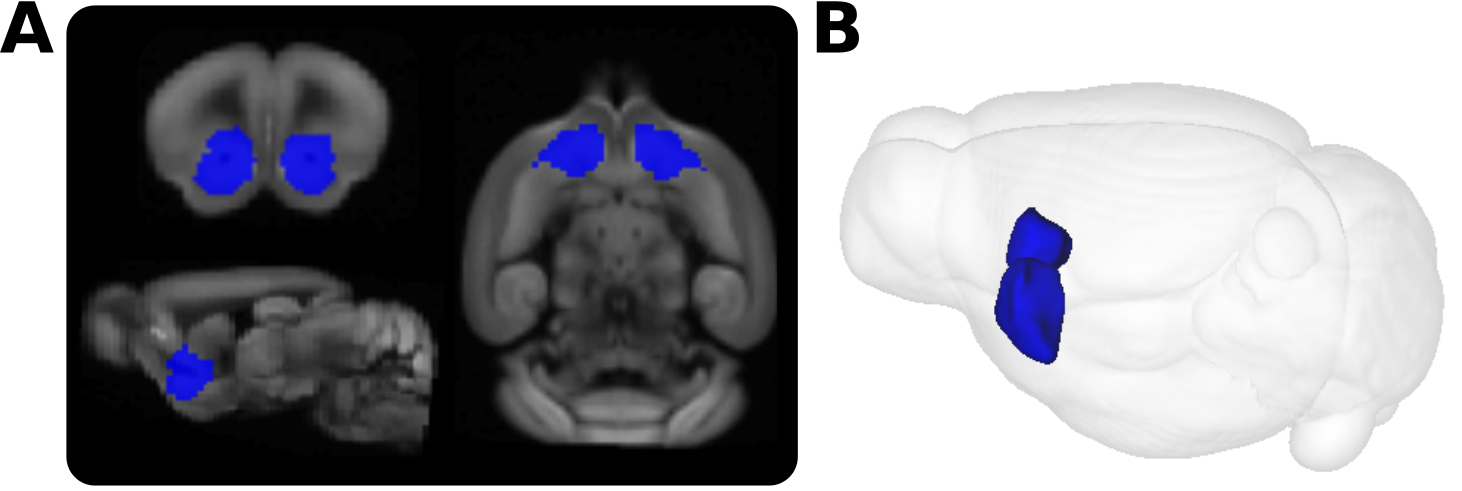
MRI was performed on 9 male C57BL/6J (Wild Type (WT)) and 9 MOR knockout (KO) mice under continuous dexmedetomidine (Dex, an α-2 adrenergic agonist) anesthesia sedation through a MRI compatible catheter (initial intraperitoneal injection of 0.3 mg Dex per kilogram body weight in 100 μL 0.9% NaCl-solution followed by subcutaneous infusion of 0.6 mg per kilogram body weight in 200 μL/h)4. Image acquisition: fMRI images were acquired at 7 tesla MRI scanner with EPI sequence(TE=17ms; TR=1.6s) matrix 128×80, 12 axial slices, field of view 1.92×1.2 cm2 and 450 volumes for total acquisition time of 12 minutes4. Oxycodone (2mg/kg) was injected inside the scanner after initial five minutes of resting state scan. BOLD activation: BOLD activation was analyzed in MOR-enriched areas following5 (Fig. 1A). Image preprocessing: Image time series were denoised, motion corrected, spatially normalized with Allen brain template, smoothed (FWHM of 0.3×0.3×1 mm3) and bandpass filtered (0.01-0.1Hz)4. Functional connectivity: Selected Nucleus Accumbens (NAc) seed was generated manually by following the Allen Mouse brain atlas and extracted mean time series were used for whole brain connectivity analysis including t-test and FWER correction.Results
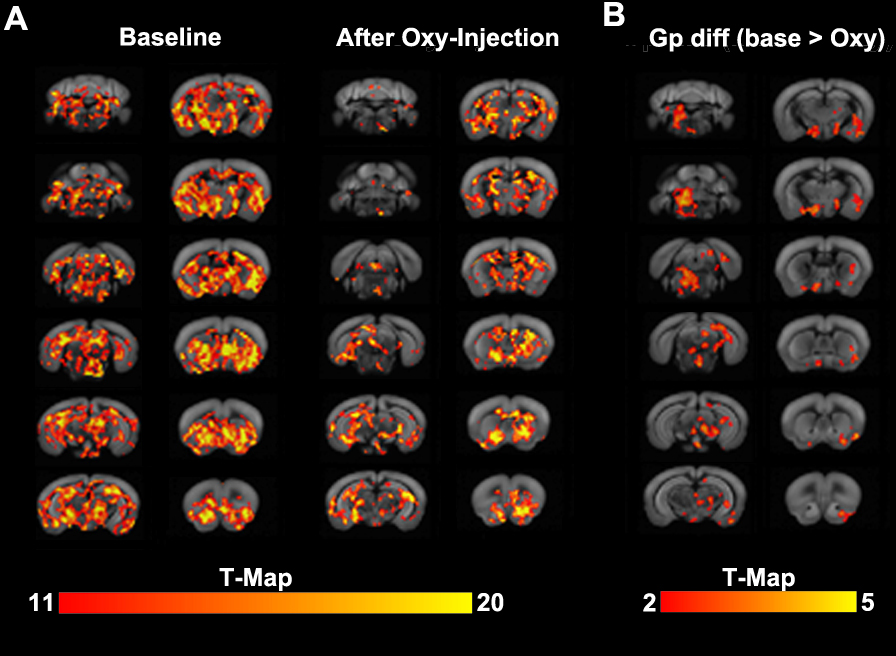
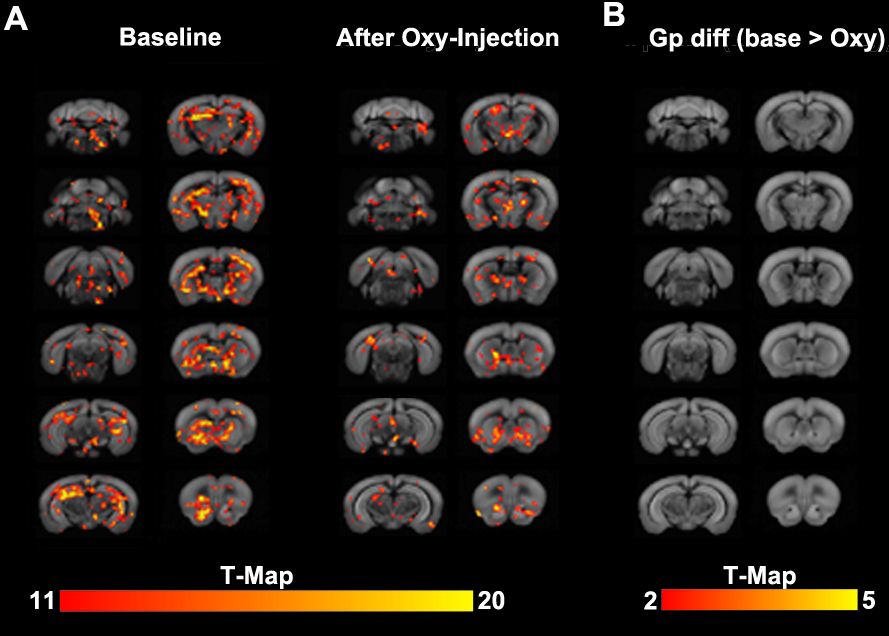
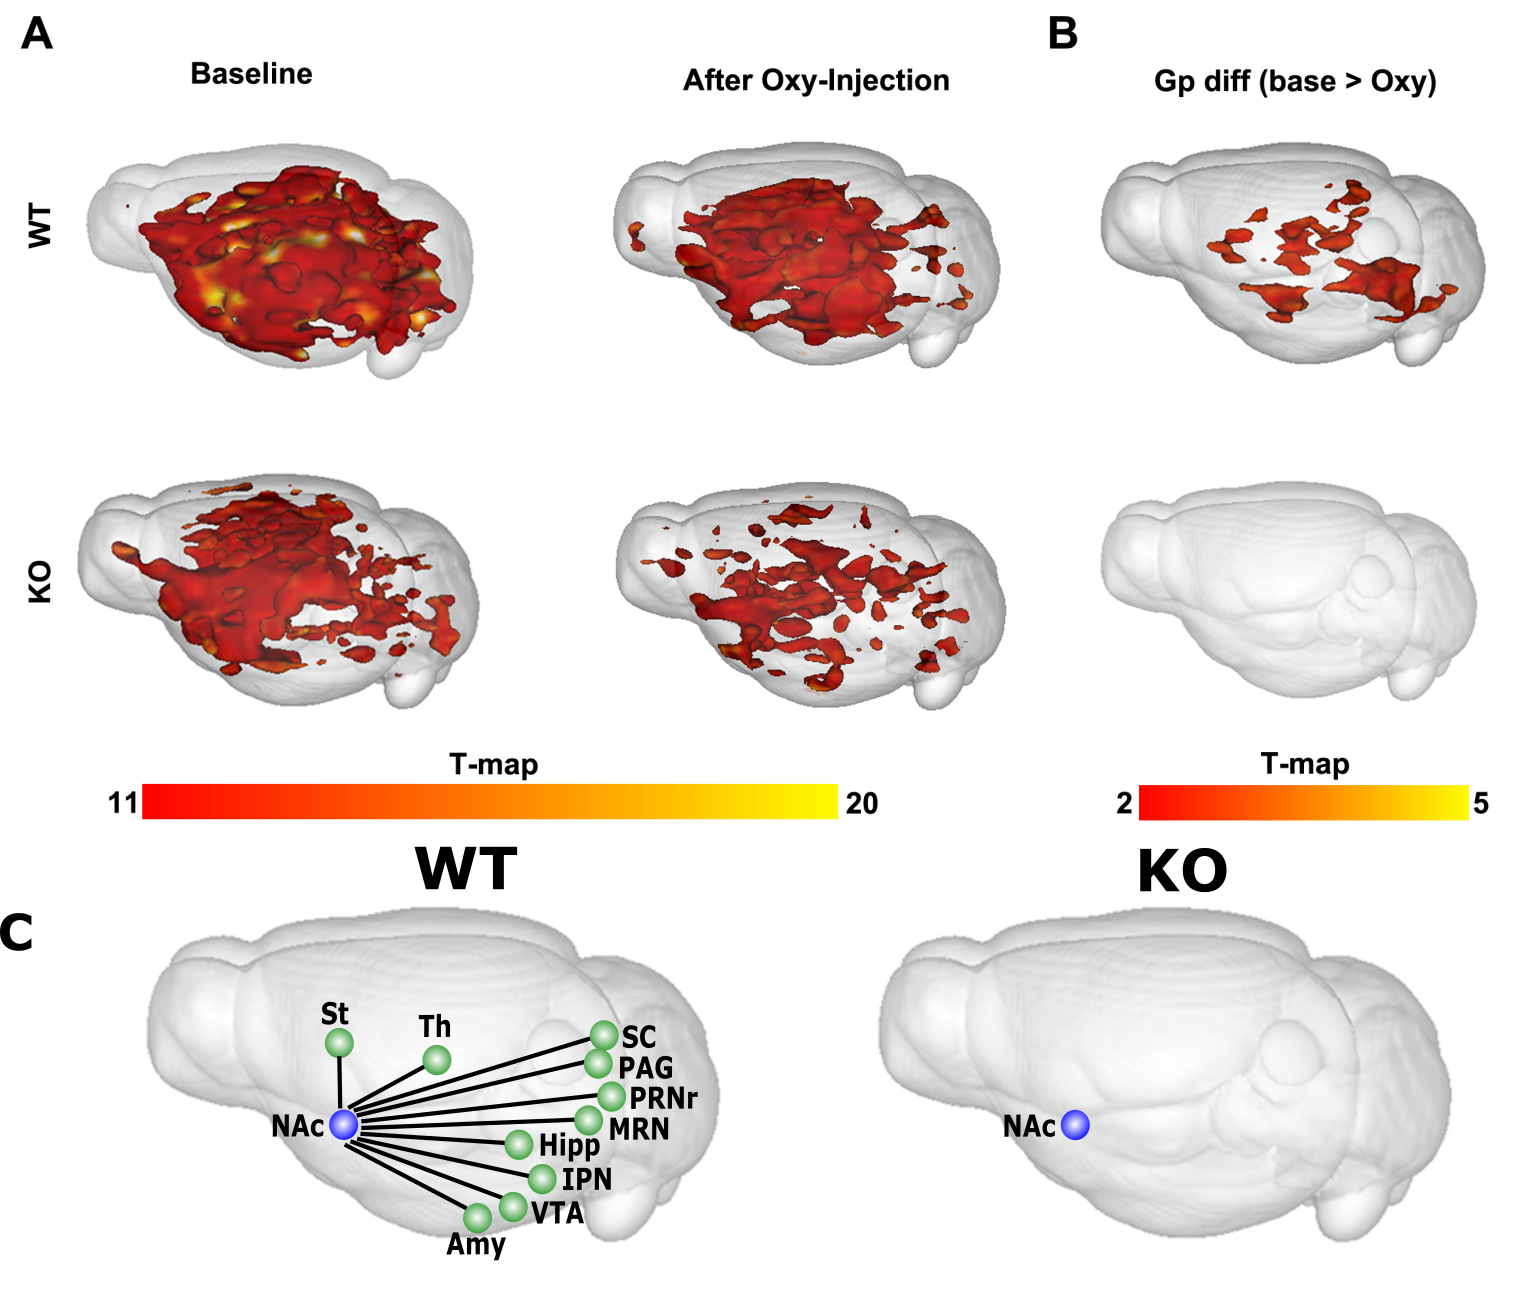
We found strong and sustained BOLD activation in WT group after 2 minutes of Oxycodone injection. BOLD activation for MOR-enriched regions (Fig. 1A) is reported in Fig. 1B for both WT and KO groups, and showed increased BOLD signal continuing from 2 to 7 minutes in the WT group, and this effect was barely detected in the KO group. Thus, the initial 5 minutes were considered as baseline, and the 2-7 min period after Oxycodone injection were used for FC analysis using NAc as a seed (Fig. 2). In general, voxelwise FC mapping showed significantly decreased connectivity after Oxycodone injection in WT (Fig 3A, 5A). Importantly, comparative group difference of FC results shows meaningful change in several regions such as ventral tegmental area (VTA)/interpeduncular nucleus (IPN), thalamus (Th), midbrain reticular nucleus (MRN), pontine reticular nucleus (PRNr), hippocampus (Hipp) and periaqueductal grey (PAG) in WT (Fig 3B, 5B-C) but not KO (Fig 4B, 5B-C) group, revealing a MOR-dependent and NAc-based Oxycodone signature in the mouse brain (Fig. 5C).Discussion
We demonstrate that Oxycodone produces robust reduction of FC in mouse brain, at least when NAc is used as a seed. This indicates a dramatic modification in the activity of this main reward center, and the lack of effect in KO MOR mice indicates a genuine on-target effect. This oxycodone effect is similar to changes induced by morphine, as we shown previously in 6, suggesting a common pattern across MOR agonist.Conclusion
This is a pilot study, and the entire procedure still requires methodological improvements, including notably testing other anesthetics (i.e. Isoflurane, Etomidate)7. In the future, we will extend our analysis to highlight commonalities and differences between morphine and oxycodone, with the final goal of screening other opiate drugs7,8 and classifying clinical or novel MOR drugs for predictive purposes.Acknowledgements
US National Institutes of Health (National Institute of Drug Addiction, grant # 05010 and National Institute on Alcohol Abuse and Alcoholism, grant #16658), the Canada Fund for Innovation and the Canada Research Chairs for financial support.References
[1] Contet et al, Curr. Opin. Neurobiol 14,370-378, 2004
[2] Moles et al, Science 304(5679),1983-1986, 2004
[3] Becker et al, Neuropsychopharmacology 39(9), 2049-2060, 2014
[4] Mechling et al, PNAS, 1-6, 2016
[5] Ferris et al, Front. Neurol. 5(94),1-14, 2014
[6] Nasseef et al, Proc. Intl. Soc. Mag. Reson. Med. 25, 2017
[7] Petrinovic et al, Sci Rep. 6:24523, 2016
[8] Borsook et al, Nat. Rev. Drug Discov.,1-14, 2006
[9] Bruns et al., NeuroImage 112,70-85, 2015
Figures