2388
Reduced basal ganglia adaptability in patients with diabetic peripheral neuropathy1Academy for Advanced Interdisciplinary Studies, Peking University, Beijing, China, 2Neuroscience and Intelligent Media Institute, Communication University of China, Beijing, China, 3Department of Endocrinology, Peking University First Hospital, Beijing, China, 4Department of Plastic Surgery & Burns, Peking University First Hospital, Beijing, China, 5Department of Radiology, Peking University First Hospital, Beijing, China, 6College of Engineering, Peking University, Beijing, China
Synopsis
Diabetic peripheral neuropathy (DPN) is one of the most common complications of diabetes mellitus and the patients often have no symptoms in the early stage. Notably, basal ganglia is an important hub in the sensorimotor loop, we hypothesized that dysfunction of basal ganglia in diabetic patients with DPN. Based on this hypothesis, we assessed the function of basal ganglia in diabetic patients using resting-state functional magnetic resonance imaging (fMRI). And our results found the reduced basal ganglia adaptability in DPN patients, which is expected to providing a new perspective for the guidance of early clinical diagnosis and efficacy evaluation.
Introduction
Diabetic peripheral neuropathy (DPN) is one of the
most common complications of diabetes mellitus1, which alters
somatosensory system and manifests as loss of sensation and poor motor control
ability. Actually, the DPN patients often have no symptoms in the early stage and
the damage of peripheral nerves in DPN has been irreversible after the clinical
symptoms appear, which greatly increases the difficulty of clinical treatment.
As an important hub in the sensorimotor loop, basal ganglia play an important
role in the balance control. Previous studies have observed basal ganglia lesions
in diabetic uremic patients and diabetic nephropathy 2,3. However,
the function of basal ganglia in DPN has not been examined. We hypothesized the
involvement of basal ganglia in diabetic patients with DPN. And to test this
hypothesis, we utilized resting-state functional magnetic resonance imaging
(fMRI) to analyze the hemodynamic response signal of basal ganglia as well as
the relationship between basal ganglia and brain regions in sensorimotor loop.Materials and Methods
Subjects
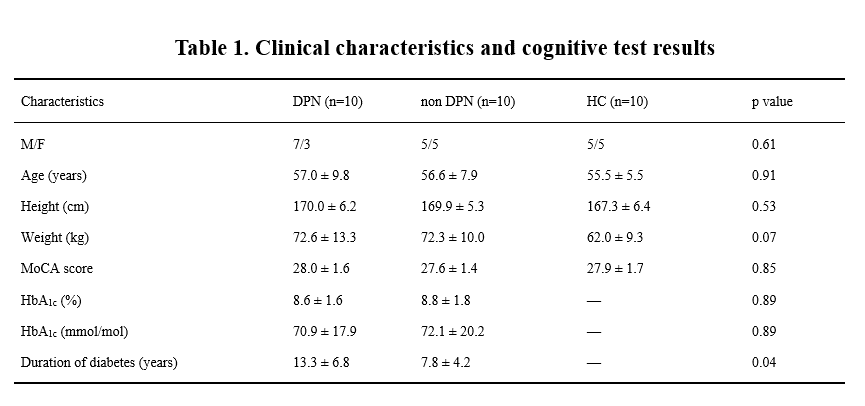
10 type 2 diabetic patients with DPN, 10 type 2 diabetic patients without DPN and 10 healthy controls were enrolled and signed an informed consent approved by the Institutional Review Board of Peking University First Hospital, Beijing (2015[866]). All participants underwent fMRI examination to assess basal ganglia function and investigate brain connectivity. Clinical characteristics and cognitive test results of all subjects are shown in Table 1.
Magnetic resonance image(MRI) acquisition
The MRIs were acquired at the Peking University First Hospital using a GE 3T (Discovery MR750; GE Medical System) whole-body scanner with an eight-channel receive-only head coil. BOLD data were acquired using a standard echo-planar imaging sequence with the following parameters: repetition time/echo time, 2000/30ms; flip angle, 90°; image matrix, 64×64; thickness/spacing, 4mm/1mm; field of view, 230×230mm2; and 33 axial sections. High-resolution structural images were acquired by using a three-dimensional fast spoiled gradient echo sequence for anatomical localization (repetition time/echo time, 7.8/3.0ms; flip angles, 20°; inversion time, 450ms; field of view, 240×240mm2; slice thickness, 2mm with 1mm overlap; in-plane resolution, 1×1mm2).
Data and statistical analysis Resting-state
fMRI data were preprocessed with Statistical Parametric Mapping software (SPM8). After preprocessing, Multiple Scale Entropy (MSE) and small world network analysis were used to assess the complexity of hemodynamic response signal and network metrics of brain regions. The registered fMRI data were segmented into 90 brain regions using the automated anatomical labeling (AAL) template. MSE of each AAL region, whole brain, gray matter, white matter and cerebrospinal fluid were calculated with parameters of pattern length m = 2, distance threshold r = 0.3 and time scale τ=4. In this study, network metrics were calculated using the GRETNA toolbox. By traversing the connection threshold from 0.05 to 0.4 in increments of 0.01, the network parameters of the whole brain and local brain regions were calculated for each participant.
Results
MSE analysis results showed that the complexity in
the hemodynamic response signal of basal ganglia was significantly decreased in
the DPN group compared with that in non-DPN and healthy control group
(p<0.05), which suggested their poor adaptability.
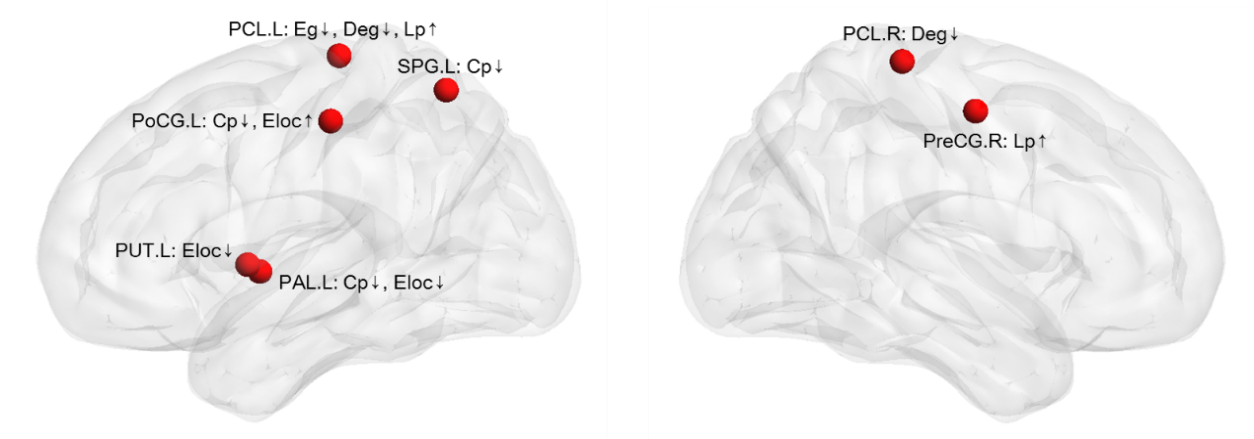
Small world network analysis results showed that
compared with the non-DPN group and healthy control group, the nodal importance
in the bilateral paracentral lobule, left putamen, globus pallidum, superior
parietal lobule, postcentral gyrus, right precentral gyrus was decreased
(p<0.05), as shown in Figure 1.
Furthermore, weakened connections between basal
ganglia and sensorimotor cortex as well as that between basal ganglia and
thalamus were observed in the DPN group as compared with non-DPN and healthy
control group (p<0.05), as shown in Figure 2.Conclusion
Decreased complexity and reduced network robustness
are closely associated with declined adaptability of basal ganglia4.
Thereby, our results demonstrate reduced basal ganglia adaptability in DPN
patients. Furthermore, this finding is expected to provide a way to explore the
pathogenesis of DPN and the mechanism of the weaken balance control, providing
a new perspective for the guidance of early clinical diagnosis and efficacy evaluation. Acknowledgements
This work was supported by grants from the National Natural Science Foundation of China (Grant Nos. 11372013 and 11572003).References
[1]. Gordois A, et al. Diabetes care, 2003, 26(6): 1790-1795.
[2]. Wang H C, et al.Journal of neurology, 2003, 250(8): 948-955.
[3]. Li J Y Z, et al. Nephrology, 2008, 13(1): 68-72.
[4]. Bullmore E, et al. Nature Reviews Neuroscience, 2009, 10(3): 186-198.
Figures