2387
Exploring the Origin of the Low Frequency Oscillation Signal in dual-echo Arterial Spin Labeling MRI1Biomedical Engineering, Purdue University, West Lafayette, IN, United States, 2Brain Imaging Center, McLean Hospital, Belmont, MA, United States, 3Department of Psychiatry, Harvard University Medical School, Boston, MA, United States, 4Laboratory of FMRI Technology, University of Southern California, Los Angeles, CA, United States
Synopsis
Arterial spin labeling (ASL), which is a non-invasive technique providing perfusion values in the unit of ml/100g/min, has been limited by low signal-to-noise ratio (SNR). Although doing average of several repeating scans might be a solution, it is essential to identify the ‘physiological noise’, i.e. low frequency oscillations (LFOs). In a study of 9 healthy subjects, the similarity and amplitude of LFOs in ASL and in blood oxygenation level dependent (BOLD) were compared to explore the origin of LFOs as well as to discover a potential method for denoising and decreasing scanning time.
Introduction
Low frequency oscillations (LFOs), defined as physiological signals in the frequency range of 0.01-0.1 Hz, have been widely studied in blood oxygenation level dependent (BOLD) functional magnetic resonance imaging (fMRI)1. Several hypotheses have been proposed about the sources of these LFOs, i.e. the vascular signal driven by the heartbeat, respiration, and arterial blood pressure2, and/or the regulation of regional cerebral blood flow3. The LFOs have been demonstrated to be a tracer for blood flow and may be a potential inherent biomarker for perfusion4. However, LFOs have not been widely studied in other types of fMRI, for example arterial spin labeling (ASL), which is a non-invasive method for perfusion quantification5. The aim of this study was to explore the relation between LFOs in BOLD and in ASL. Based on the different parameters used in BOLD and ASL signals, we were able to identify the common effect that generate the LFOs in both signals.Methods
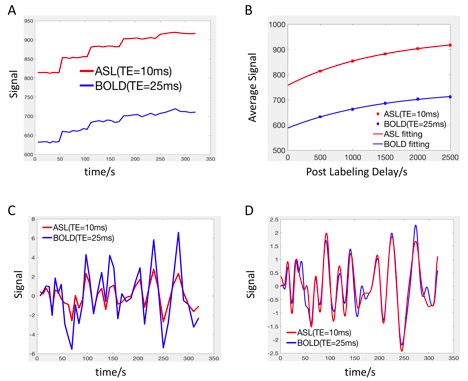
The cohort included 9 healthy volunteers (8 male, age=30±11 years). All subjects underwent pseudo-continuous arterial spin labeling (pCASL)6 covering the upper part of brain (not including cerebellum and brainstem) in a 3T Siemens TIM Trio. Imaging parameters were as follows: an echo planar imaging (EPI) sequence was applied for readout, effective echo time (TE) = 10/25 ms, labeling duration = 1.5 s, postlabeling delay (PLD) = 0.5, 1.0, 1.5, 2.0, 2.5 s, 19x 7mm slices, matrix = 64 x64, in-plane resolution = 3.4375 x3.4375 mm2, repetition time (TR) = 3, 3.5, 4, 4.5, 5 s. 8 pairs of tag and control were acquired for each PLD. Total scanning time was 5.3 min. Motion correction was applied for all the data7. The workflow for comparison between LFOs in ASL and BOLD is shown in Fig. 1 (programmed Matlab, The Mathworks, USA). A consistent mask was used to calculate the global mean (GM) of the signal. The baseline signal value increases with longer PLD due to the magnetization transfer (MT) effect8 (Fig. 1A). To evaluate the LFOs in different baseline signal value, exponential relaxation fitting was performed based on the average value of each PLD (Fig. 1B). After removing the baseline values (Fig. 1C), Fourier transform interpolation, mean removal, and normalization to unit standard deviation were applied (Fig. 1D). Cross correlation analysis was done to compare LFOs in ASL and BOLD to determine time delay and similarity. The amplitude difference was also analyzed by comparing the integration of absolute signal value (Fig. 1C). With the equations of MRI signal (Fig. 2), we tried to simulate the LFOs by adding a fluctuation in proton density (PD), T1, and T2*.Results
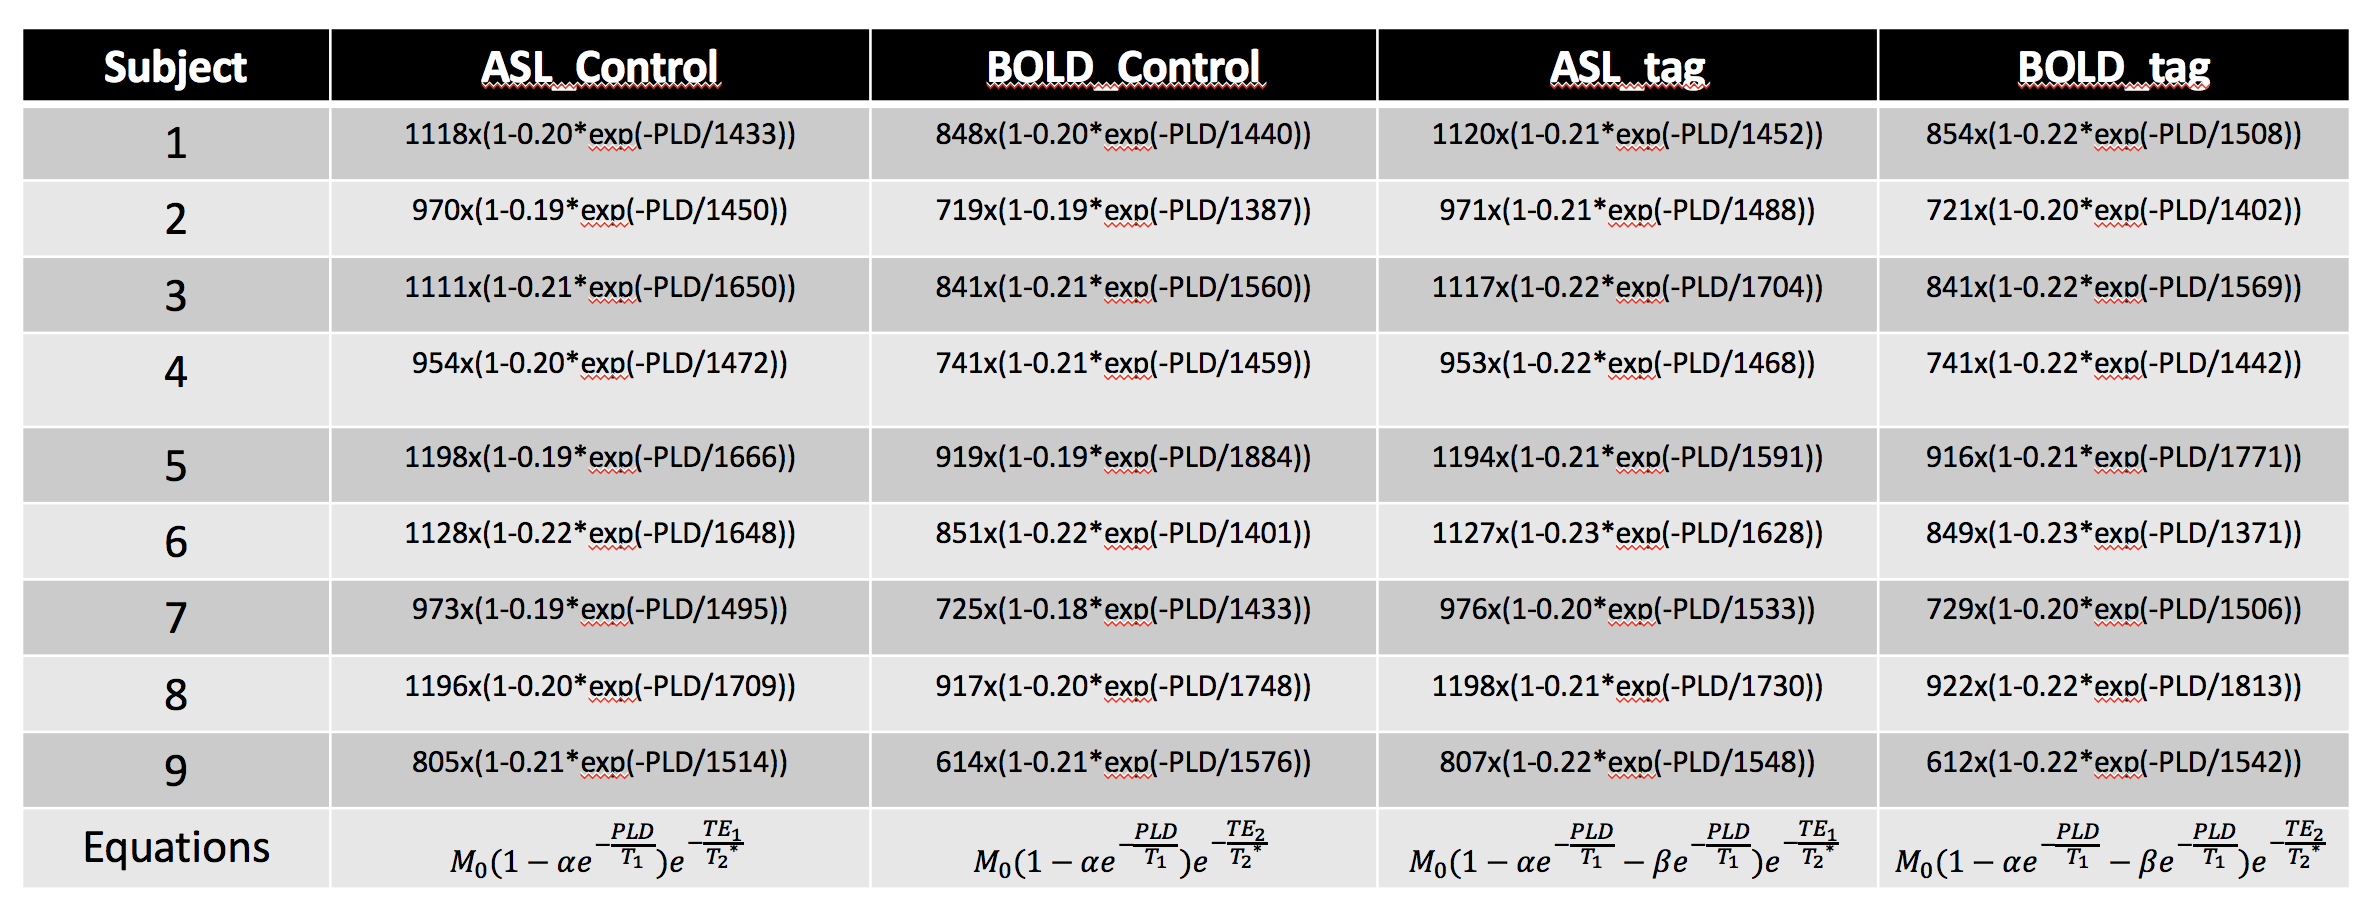
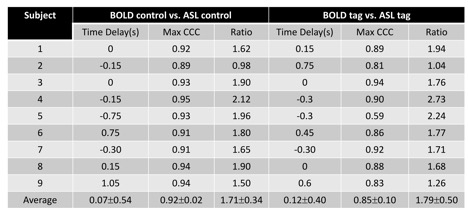
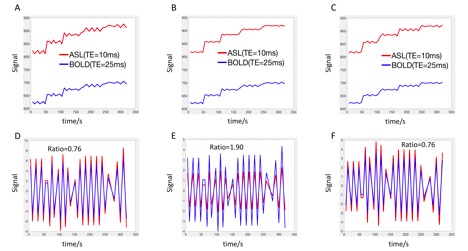
The fitting equations are shown in Fig. 2. The ratio of the signal between ASL and BOLD were consistent with a global T2* value of 55 ms9. The time delay between ASL and BOLD LFOs is 0.09±0.46s with a maximum cross correlation coefficient (MCCC) of 0.88±0.09 (Fig. 3). The LFOs in BOLD are always larger than those of ASL (Fig. 1C) with a ratio of 1.75±0.41 (Fig. 3). Adding a 1% proton density fluctuation (Fig. 4D), 10% T1 value fluctuation (Fig. 4F), or 1% T2* value fluctuation (Fig. 4E) into the equations shown in Fig. 2 would lead to simulated LFOs amplitudes of the same magnitude as those in the real data. However, only the simulating fluctuation in T2* could produce larger LFOs in BOLD, indicating that the real signal represents primarily a T2* fluctuation.Discussion
Because of the relatively long TR and low signal-to-noise ratio (SNR) of ASL acquisitions, the noise contribution of the LFOs signal cannot be ignored even if the subtraction is applied (contribute 20% to the average signal after subtraction at 0.5s PLD, and contribute more with longer PLD). By identifying the LFOs in ASL, we may be able to denoise ASL and decrease the repeat time in acquisition. With the higher SNR, better spatial resolution can be achieved leading to more accurate perfusion quantification. Although the main cause of LFOs is likely T2* fluctuation, we cannot rule out the T1 and PD effect. More studies are warranted to investigate the origin of LFOs.Conclusion
LFOs contribute noise to ASL data, and are highly correlated with the LFOs found in BOLD. Based on the amplitude difference between LFOs in ASL and BOLD, we believe the main source of LFOs is T2* fluctuation.Keywords
Low frequency oscillations, BOLD, ASL, T2*Acknowledgements
Contract grant sponsor: National Institutes of Health, Grants K25 DA031769 (YT), R21 DA032746 (BdeBF).References
1. Zuo XN, Di Martino A, Kelly C, Shehzad ZE, Gee DG, Klein DF, et al. The oscillating brain: complex and reliable. Neuroimage. 2010;49(2):1432-45.
2. Fukunaga M, Horovitz SG, de Zwart JA, van Gelderen P, Balkin TJ, Braun AR, et al. Metabolic origin of BOLD signal fluctuations in the absence of stimuli. J Cereb Blood Flow Metab. 2008;28(7):1377-87. 3. Katura T, Tanaka N, Obata A, Sato H, Maki A. Quantitative evaluation of interrelations between spontaneous low-frequency oscillations in cerebral hemodynamics and systemic cardiovascular dynamics. Neuroimage. 2006;31(4):1592-600.
4. Tong Y, Frederick BD. Time lag dependent multimodal processing of concurrent fMRI and near-infrared spectroscopy (NIRS) data suggests a global circulatory origin for low-frequency oscillation signals in human brain. Neuroimage. 2010;53(2):553-64.
5. Weber MA, Gunther M, Lichy MP, Delorme S, Bongers A, Thilmann C, et al. Comparison of arterial spin-labeling techniques and dynamic susceptibility-weighted contrast-enhanced MRI in perfusion imaging of normal brain tissue. Invest Radiol. 2003;38(11):712-8.
6. Liu T, Tak S, Wang D, Yan L, Chen J. Evaluation of Dual-Echo Pseudo-Continuous ASL for Resting-State BOLD Functional Connectivity Measurement. Annual ISMRM 2013.
7. Jenkinson M, Bannister P, Brady M, Smith S. Improved optimization for the robust and accurate linear registration and motion correction of brain images. Neuroimage. 2002;17(2):825-41.
8. Ropele S, Strasser-Fuchs S, Augustin M, Stollberger R, Enzinger C, Hartung HP, et al. A comparison of magnetization transfer ratio, magnetization transfer rate, and the native relaxation time of water protons related to relapsing-remitting multiple sclerosis. AJNR Am J Neuroradiol. 2000;21(10):1885-91.
9. Li TQ, Yao B, van Gelderen P, Merkle H, Dodd S, Talagala L, et al. Characterization of T(2)* heterogeneity in human brain white matter. Magn Reson Med. 2009;62(6):1652-7.
Figures