2385
Estimation of physiological sources of nonlinearity in BOLD signals1Kansei Fukushi Research Institute, Tohoku Fukushi University, Sendai, Japan, 2Tohoku University, Sendai, Japan
Synopsis
The BOLD signals related to brain activation is often nonlinear with change in TE. In contrast to extravascular component, the nonlinearity is attributable to intravascular component due to chemical exchange between plasma and deoxy-Hb. Recently, activity-evoked pH change on the brain has been demonstrated. Since the chemical exchange is often pH-dependent, the time for the chemical exchange would change. Thus, the two-compartment model that incorporates the change would be more accurate for estimation of parameters than the model with fixed exchange time. In this study, we measured the nonlinearity by multi-echo GRE-EPI and estimated parameters of the proposed model.
Introduction
The BOLD signals related to brain activation have often shown nonlinear aspects with change in TE.1-3 The BOLD signal originates from both intravascular (IV) and extravascular (EV) spaces.4 The nonlinearity is attributable to a chemical exchange between plasma and deoxy-Hb as well as the concentration of deoxy-Hb in IV component.1,2 Thus, measuring nonlinearity enable to estimate the physiological changes with the two-compartment model. In most of the previous studies, the two-compartment model has been used with a fixed time for the chemical exchange. Recently, activity-evoked pH change on the brain has been demonstrated.5 Since the chemical exchange is often pH-dependent6, the chemical exchange time would change. Thus, the model that incorporates the change would be more accurate for estimation of parameters than a model with a fixed exchange time. In this study, we measured the nonlinearity by a multi-echo GRE-EPI and estimated parameter changes of the proposed model.Method
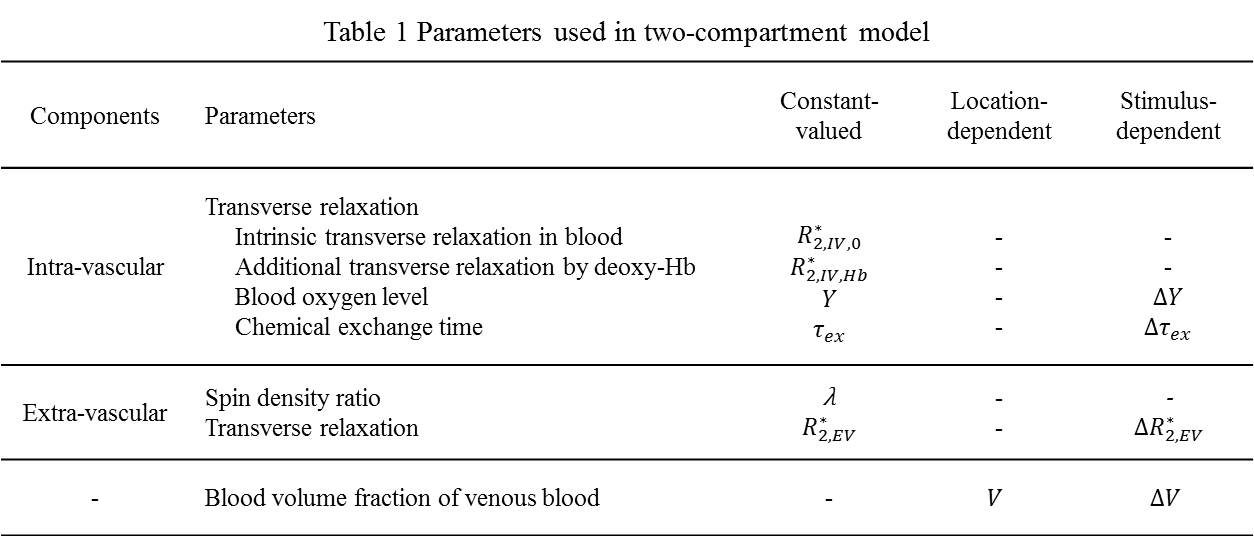
(Two-compartment model) The IV component is supposed to originate from venous blood, and the EV component predominantly originates from tissues.
$$S(t)=(V+\Delta{V})\cdot\exp(-R_{2,IV}^{*}\cdot{t})+(1-V-\Delta{V})\cdot\lambda\cdot\exp(-(R_{2,EV,0}^{*}+\Delta{R_{2,EV}^{*}})\cdot{t})$$
, where the parameters were defined in Table 1. $$$R_{2,IV}^{*}$$$ is modulated by the chemical exchange model1,2,7,8.
$$R_{2,IV}^{*}(t)=R_{2,IV,0}^{*}+R_{2,IV,Hb}^{*}\cdot\left[1-\left(Y+\Delta{Y}\right)\right]^2\cdot\left(1+\frac{\Delta\tau_{ex}}{\tau_{ex}}\right)\cdot\left\{1-\frac{2(\tau_{ex}+\Delta\tau_{ex})}{t}\cdot\tanh\left[\frac{t}{2(\tau_{ex}+\Delta\tau_{ex})}\right]\right\}$$
The signal percent change for activation is calculated at some TE.
$$\%S(t)=\frac{S(t)-S_0(t)}{S_0(t)}\times100(\%)$$
$$${S_0}$$$ was a signal when stimulus-dependent parameters were zero. The two-compartment model was used with time-varying $$$\Delta\tau_{ex}$$$ (TV-model) or $$$\Delta\tau_{ex}=0$$$ (zero-model).
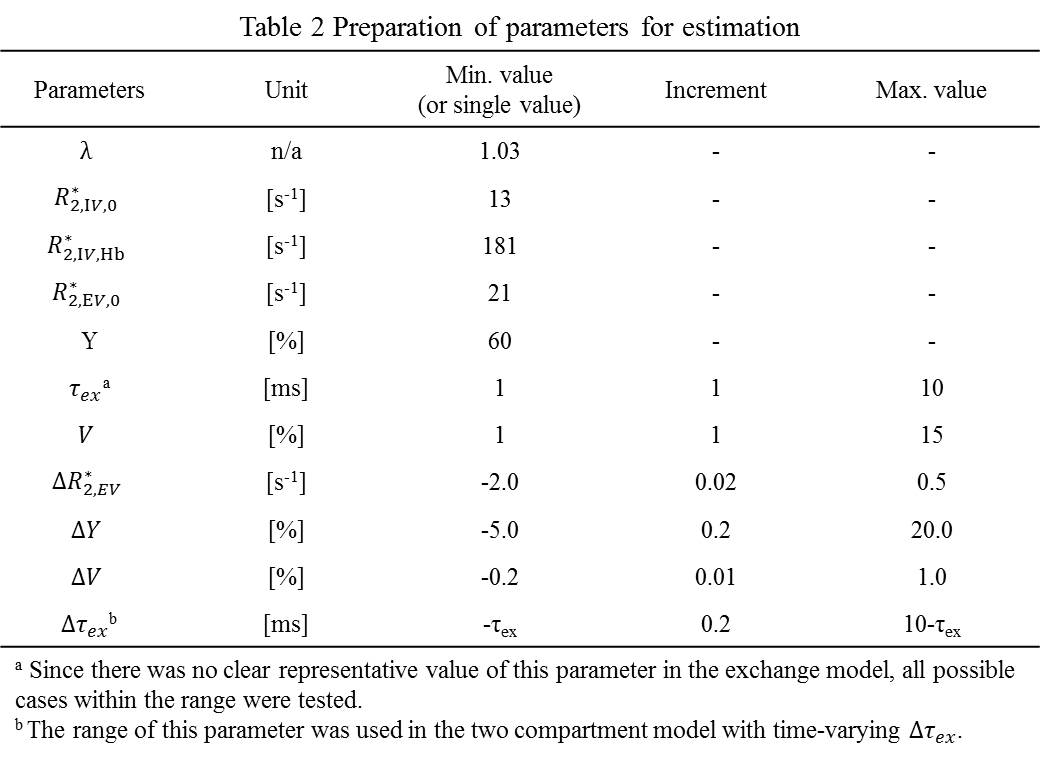
(Parameter estimation) Combinations of parameters in Table 2 were used for the estimation with the following resultant limitations to reject unrealistic results.
$$\begin{cases}{-0.1<\%S_{IV}\space{and}\space\%S_{EV}<\%S}&{when}\space\%S\geq0\\{\%S<\%S_{IV}\space{and}\space\%S_{EV}<0.1}&{when}\space\%S<0\end{cases}$$
A set of parameters was chosen by minimizing the error.
$$Error\space(s^{-1})=\frac{1}{N\cdot100(\%)}\cdot\sum_{t\in{TE}}\mid\%S_{m,t}-\%S_{e,t}\mid/t$$
, where and denote measured and simulated signal changes at echo time t, respectively. N is the number of TEs. Also, the corrected Akaike information criterion (AICc) was evaluated to validate a goodness of fit with the complexity of the model.9
(Experiment) In 3T Skyra-fit system (Siemens, Germany) with a standard 20-channel head coil, the six-echo-time EPI was performed with the TEs of 11,26,41,56,71 and 86 ms, TR of 2s, FA of 90°, in-plane resolution of 3.44 mm, slice thickness of 3.4 mm, an acceleration factor of 2 along PE, and fifteen slices parallel to the calcarine sulcus. Visual stimulation of 8-Hz flickering checkerboard was given with 8 blocks of 16/36s on/off. Nine volunteers (three females) participated with the consent. The multi-echo images were reconstructed by home-made MATLAB codes (MathWorks, USA) and motion-corrected by SPM12 (London, England) with the first echo images. Through Brain Voyager (Brain Innovation B.V., the Netherlands), the event-related responses were evaluated with high-pass-filtering and ROI-selecting. The ROI was defined as a cluster of voxels that satisfied the statistical condition of t-value>3.0 (p<0.001) for all TEs.
Result
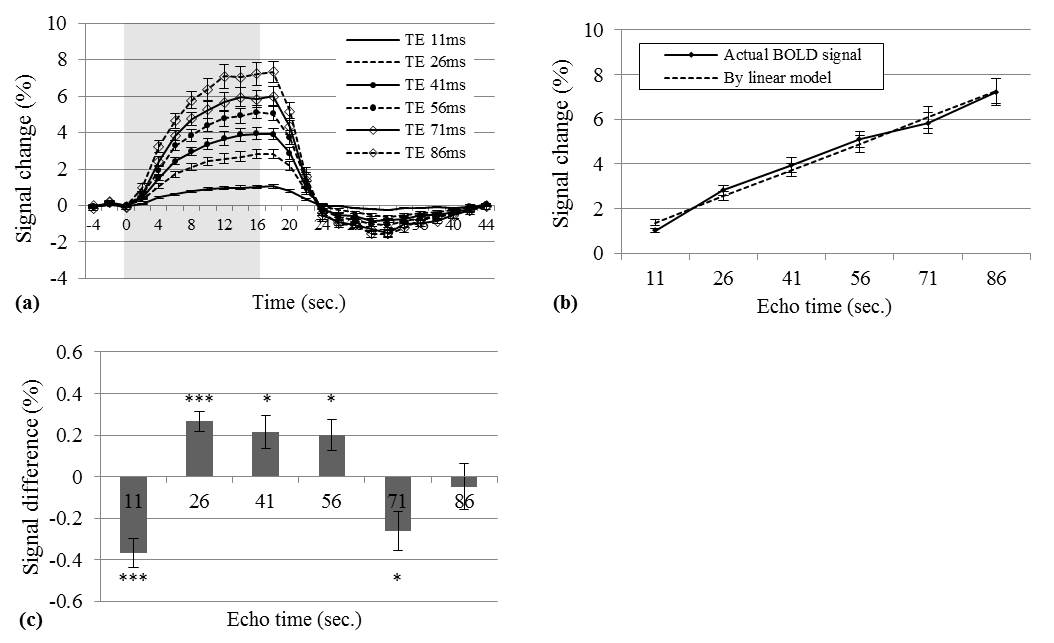
In Fig. 1, the nonlinearity of TE-dependent BOLD signals for TE intervals of 11 to 41 ms was compared with the results from a linear model.
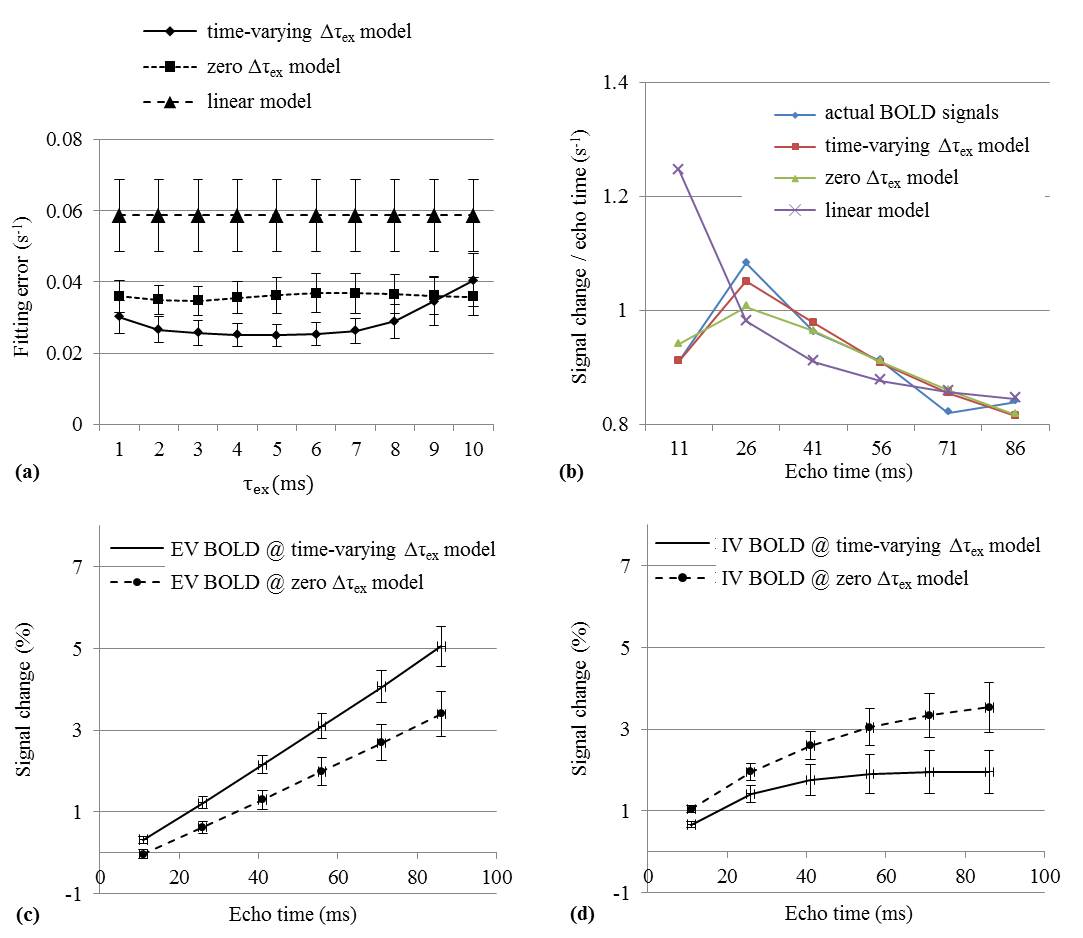
In Fig. 2a, the minimum fitting error for TV-model was significantly lower than for zero-model or for linear model (0.025±0.003s-1, 0.035±0.004s-1 and 0.059±0.010s-1, respectively). The values of $$$\tau_{ex}$$$ were chosen to 4 ms in TV-model and 2 ms in zero-model. The average blood volumes (V) were 5.7%±0.5% in TV-model and 6.4%±0.8% in zero-model, which were within a typical range of 2%–8%. AICc values were -66.6±8.3 in TV-model, -59.5±9.0 in zero-model and -56.0±19.9 in linear model. There was a significant difference of -6.6±3.8 (p<0.001, paired Student's t-test) between TV- and zero-models. TV-model was considered to improve the goodness of fit (Fig. 2b).
As the echo time increased from 26 to 86 ms, the ratios of IV signal to the actual BOLD signal decreased from 0.44 to 0.24 in TV-model and from 0.61 to 0.44 in zero-model (calculated by Fig. 2c and 2d). The result from TV-model was consistent with the result of the previous study showing that the IV fraction decreased from 0.40 to 0.22 in TE of 32.7 to 70.7 ms.10
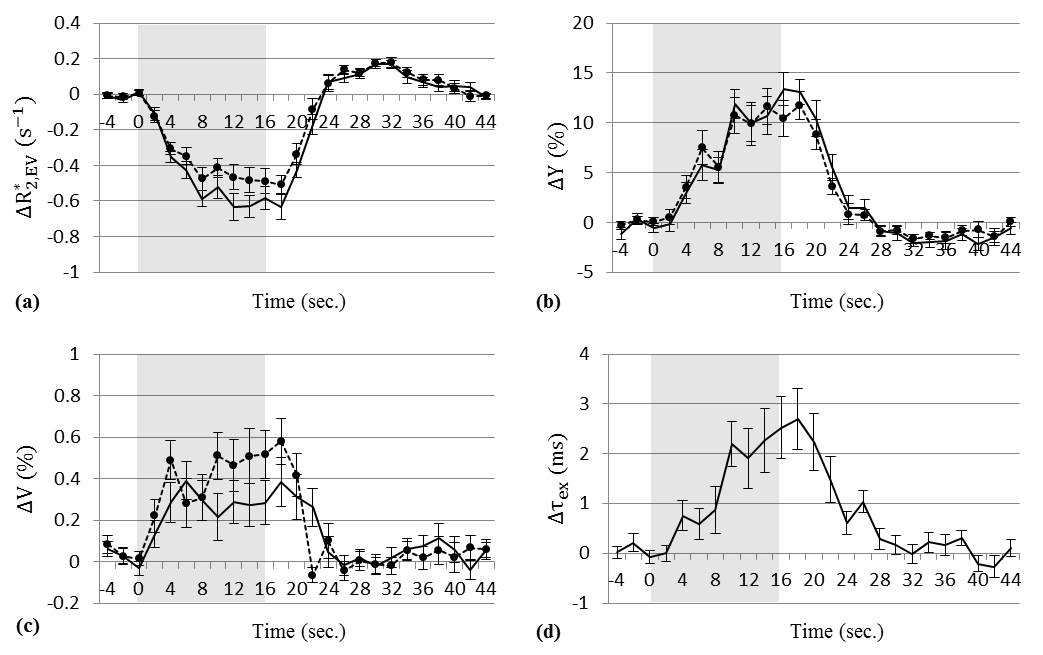
The stimulus-sensitive parameters were estimated (Fig. 3a–d). In Fig. 3b and d, the average values in the post-stimulus undershoot were almost zero for $$$\Delta\tau_{ex}$$$ (0.04±0.19 ms, p=0.54, one-sample t-test) and non-zero for $$$\Delta{Y}$$$ (-1.62%±0.66%, p<0.001, one-sample t-test). These implied that the source of $$$\Delta\tau_{ex}$$$ might be different from that of $$$\Delta{Y}$$$.
Discussion
The nonlinearity in TE-dependent BOLD signals was analyzed with the two-compartment model. The existence of $$$\Delta\tau_{ex}$$$ in the model produced better fitting results and IV/EV separation comparable for results of the previous study. $$$\Delta\tau_{ex}$$$ was considered to be influenced by a stimulus-related non-BOLD factor differing from $$$\Delta{Y}$$$.Conclusion
The proposed method is appropriate for simultaneous observations of several physiological sources that contribute to BOLD signals by using a single measurement modality.Acknowledgements
This study was supported by the MEXT-Supported program for the Strategic Research Foundation at Private Universities, 2014-2018, and JSPS KAKENHI under Grant number 17K01993.References
1. Duong TQ, Yacoub E, Adriany G, Hu X, Ugurbil K, Kim S-G, et al. Microvascular BOLD contribution at 4 and 7 T in the human brain: gradient-echo and spin-echo fMRI with suppression of blood effects. Magn Reson Med 2003;49:1019–27.
2. Jin T, Wang P, Tasker M, Zhao F, Kim S-G. Source of nonlinearity in echo-time-dependent BOLD fMRI. Magn Reson Med 2006;55:1281–90.
3. Kang D, Choi U-S, Sung Y-W. Microscopic functional specificity can be predicted from fMRI signals in ventral visual areas. Magn Reson Imaging 2014;32:1031–6.
4. Ogawa S, Menon RS, Tank DW, Kim SG, Merkle H, Ellermann JM, et al. Functional brain mapping by blood oxygenation level-dependent contrast magnetic resonance imaging. A comparison of signal characteristics with a biophysical model. Biophys J 1993;64:803–12.
5. Magnotta V a., Heo H-Y, Dlouhy BJ, Dahdaleh NS, Follmer RL, Thedens DR, et al. Detecting activity-evoked pH changes in human brain. Proc Natl Acad Sci 2012;109:8270–3.
6. Matthew JB, Richards FM. The pH Dependence of Hydrogen Exchange in Proteins *. J Biol Chem 1983;258:3039–44.
7. Luz Z, Meiboom S. Nuclear Magnetic Resonance Study of the Protolysis of Trimethylammonium Ion in Aqueous Solution-Order of the Reaction with Respect to Solvent. J Chem Phys 1963;39:366–70.
8. Kang D, Sung YW, Shioiri S. Estimation of physiological sources of nonlinearity in blood oxygenation level-dependent contrast signals. Magnetic Resonance Imaging 2017; Accepted.
9. Burnham KP, Anderson DR. Model Selection and Multimodel Inference: A Practical Information-Theoretic Approach. New York: Springer; 2002.
10. Donahue MJ, Hoogduin H, Van Zijl PCM, Jezzard P, Luijten PR, Hendrikse J. Blood oxygenation level-dependent (BOLD) total and extravascular signal changes and ΔR2* in human visual cortex at 1.5, 3.0 and 7.0 T. NMR Biomed 2011;24:25–34.
Figures