2384
Optimization of Serial Correlation Correction Methods Based on Autoregressive Model in Fast fMRI1Laureate Institute for Brain Research, Tulsa, OK, United States, 2Stephenson School for Biomedical Engineering, University of Oklahoma, Norman, OK, United States
Synopsis
Serial correlation (SC) of noise inflates T-statistics in simultaneous multi-slice excitation (SMS) fMRI studies with short repetition times (TR<2s). The SC can be corrected using noise pre-whitening methods based on the high-order autoregressive (AR) model. This study aims to determine the optimal order selection (OS) method of AR model to achieve the best SC correction accuracy. By evaluating the false positive characteristics in rest/null datasets, our study showed that the corrected Akaike information criterion (AICc) has the best performance among the OS criteria. We recommend use the AR model with AICc to correct the SC in SMS fMRI experiments.
Introduction
A repetition time (TR) of several hundred milliseconds
can be achieved in a whole brain fMRI scan with simultaneous multi-slice
excitation (SMS) EPI pulse sequences[1-3]. Due to the serial correlation (SC)
of noise[4], the T-statistics of task-induced BOLD activations can be highly inflated
at short TRs[5-7]. The previous studies[5-7] have suggested use the high-order
autoregressive (AR) model[8] to correct the SC effect. However, it is unknown
what order values should be chosen to achieve the best correction efficacy. This
study aims to optimize the order selection (OS) method of AR model used in fast
fMRI studies. By measuring the false positive characteristic (FPC) in rest data[9-10]
at TR=500ms, we compared the performances of four commonly used OS criteria in
SC correction and optimized the regularization parameter of estimated autocorrelations
in AR model[8]. Determination of the optimal OS criterion will improve the
reliability of detecting brain activation with SMS fMRI.Methods
Resting state fMRI (eyes open) scans from six healthy subjects were acquired using a 32-channel head coil at a 3T GE MR70 MRI scanner. One short TR (SMS-EPI) and one EPI standard TR, with in-plane Sensitivity Encoding (SENSE) acceleration fMRI scans were acquired for each subjects. The SME-EPI imaging parameters were: TR/TE=500/30ms, FOV/slice thickness=240/2.5mm, matrix=96×96, 36 axial slices, multiband factor=6 (no in-plane acceleration) with blipped-CAIPI[11], and a flip angle set to Ernst angle. For SENSE EPI imaging parameters were: TR/TE=2000/30ms, FOV/slice thickness=240/4mm, matrix=64×64, and acceleration R=2. Both fMRI scans lasted 360s.
The data was preprocessed with motion correction, RETROICOR[12], and RVHRCOR[13] using AFNI[14] and MATLAB scripts. A null dataset was created by extracting the data from 6 to 351s, and then analyzed with the GLM and a block-designed (23 OFF/ON epochs with 15s/epoch) task and six head motion nuisance regressors. The SC was corrected in the GLM using the AR model[8] with four commonly used OS criteria: corrected Akaike information criterion (AICc)[15], Bayesian information criterion (BIC)[7,16], partial autocorrelation function (pACF)[9], and 5/TR[5]. The first three criteria were performed in voxel-wise, while all voxels were assigned one fixed order value (rounded integer of 5/TR) in the last method. FWHM of 0, 6, and 15mm were used in the spatial regularization of autocorrelations[8]. The performances of OS methods were evaluated by calculating their FPC in the null dataset[9-10]. The accuracy is higher if the FPC less deviates from the theoretical curve, in which false positive rate = nominal specificity[9-10].
Results
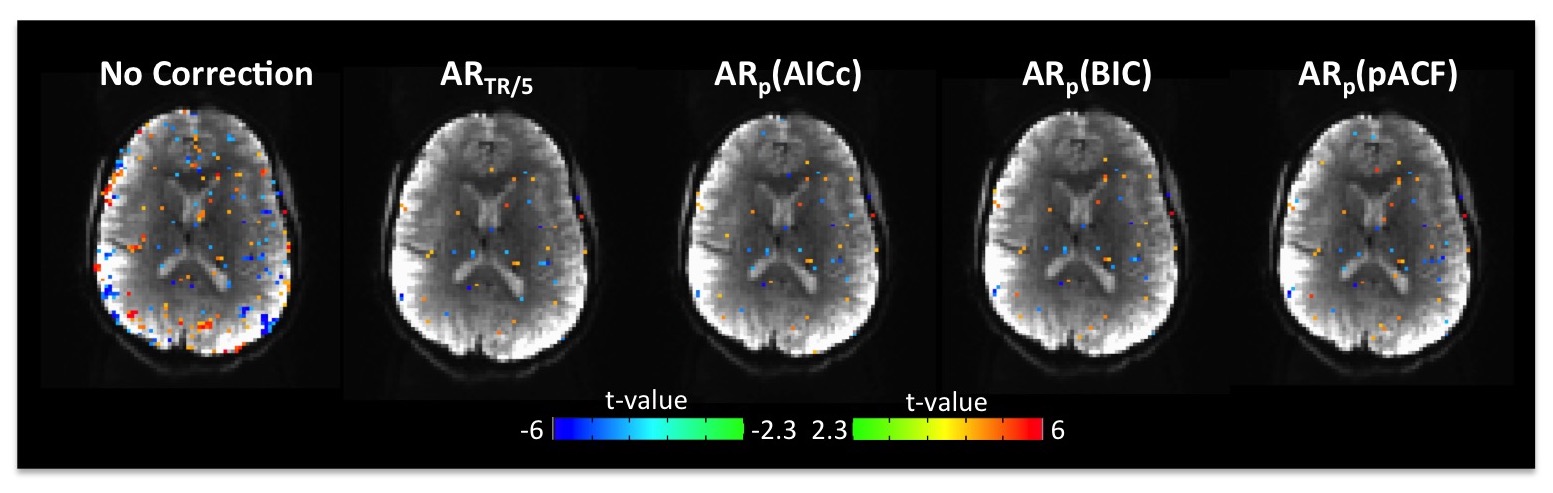
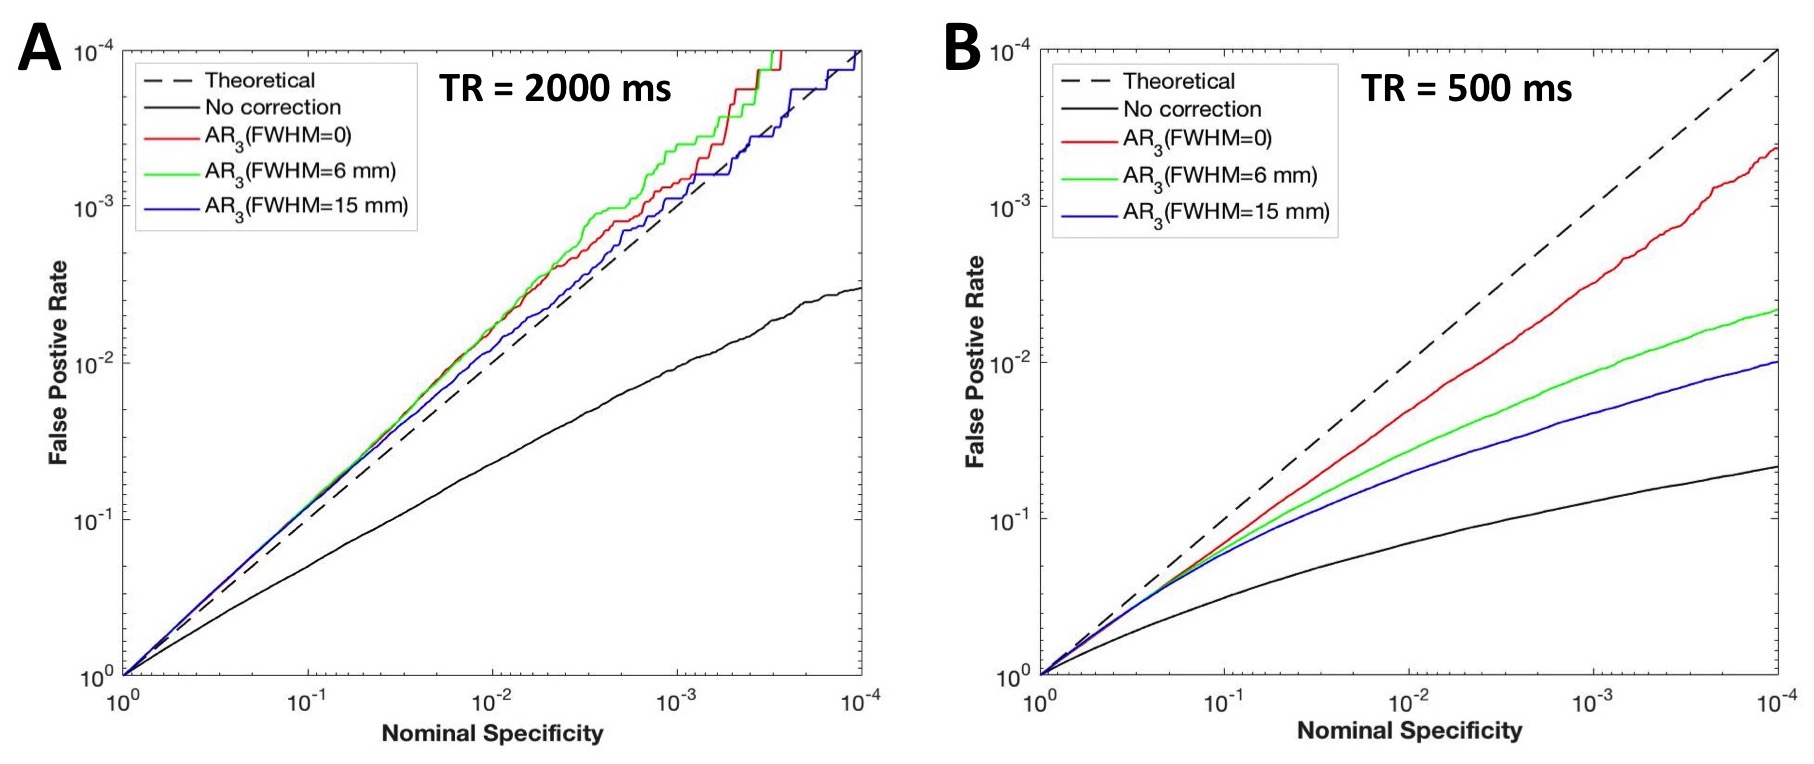
Fig. 1 shows, false activations present in the t-maps without SC correction. All the four OS methods substantially reduced the number of false positives. The FDCs (Fig. 2) without SC correction were far below the theoretical dashed line, suggesting that the t-scores were highly inflated. After the SC correction, the deviations between actual and theoretical FDCs were largely decreased. Also, the AR model performed best when using the spatial regularization of FWHM=15mm at TR=2000ms (Fig. 2A), but at TR=500ms the correction accuracy without regularization was higher than that with regularization (Fig. 2B).
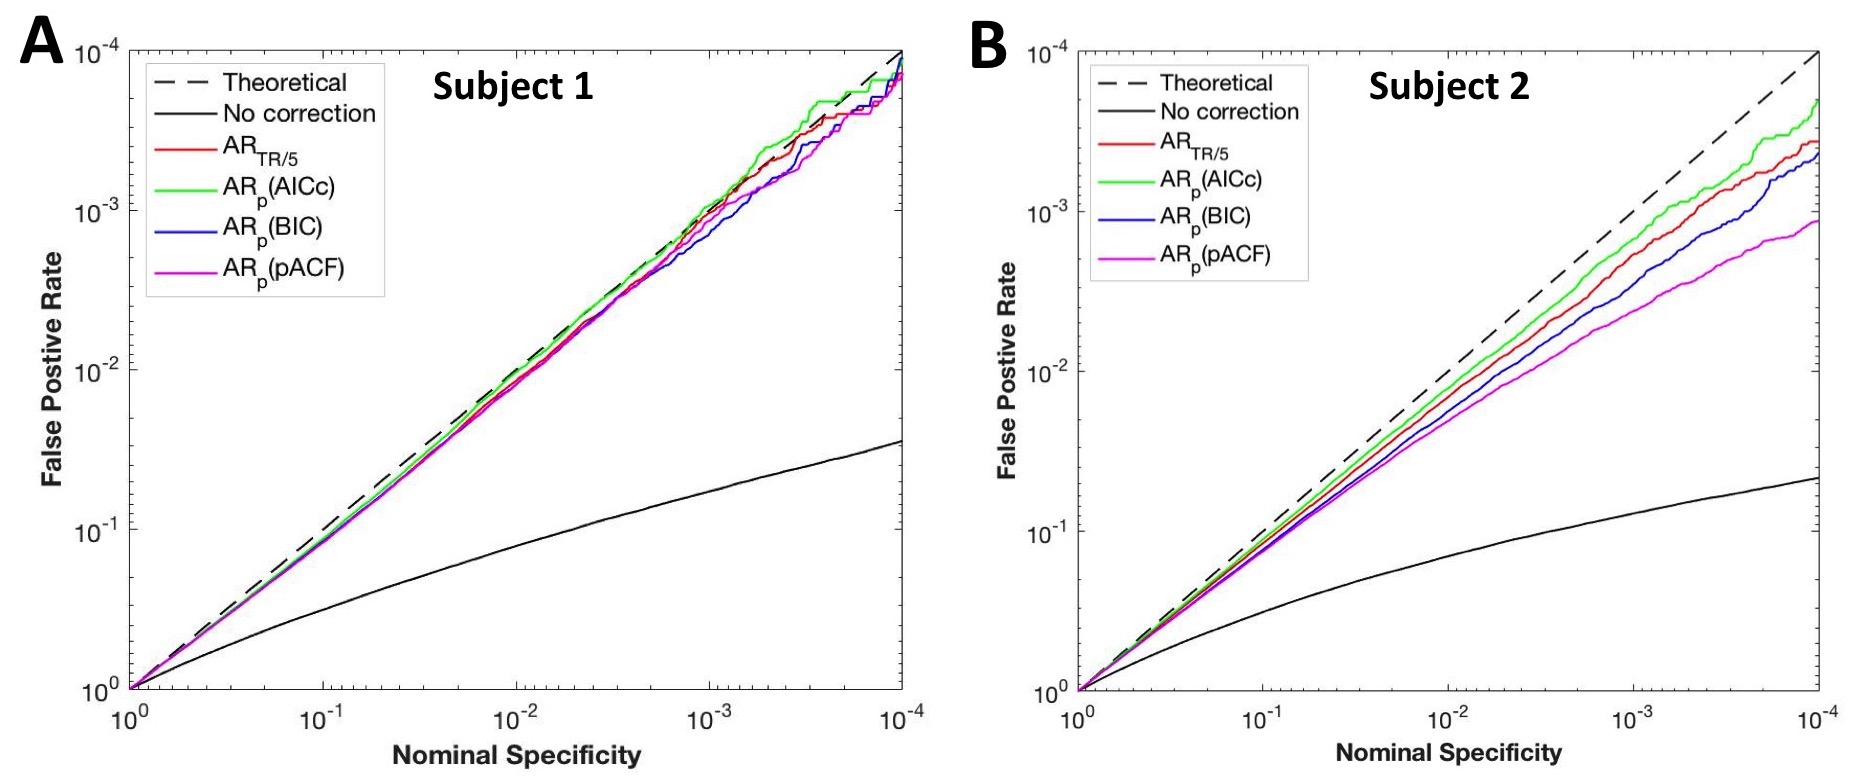
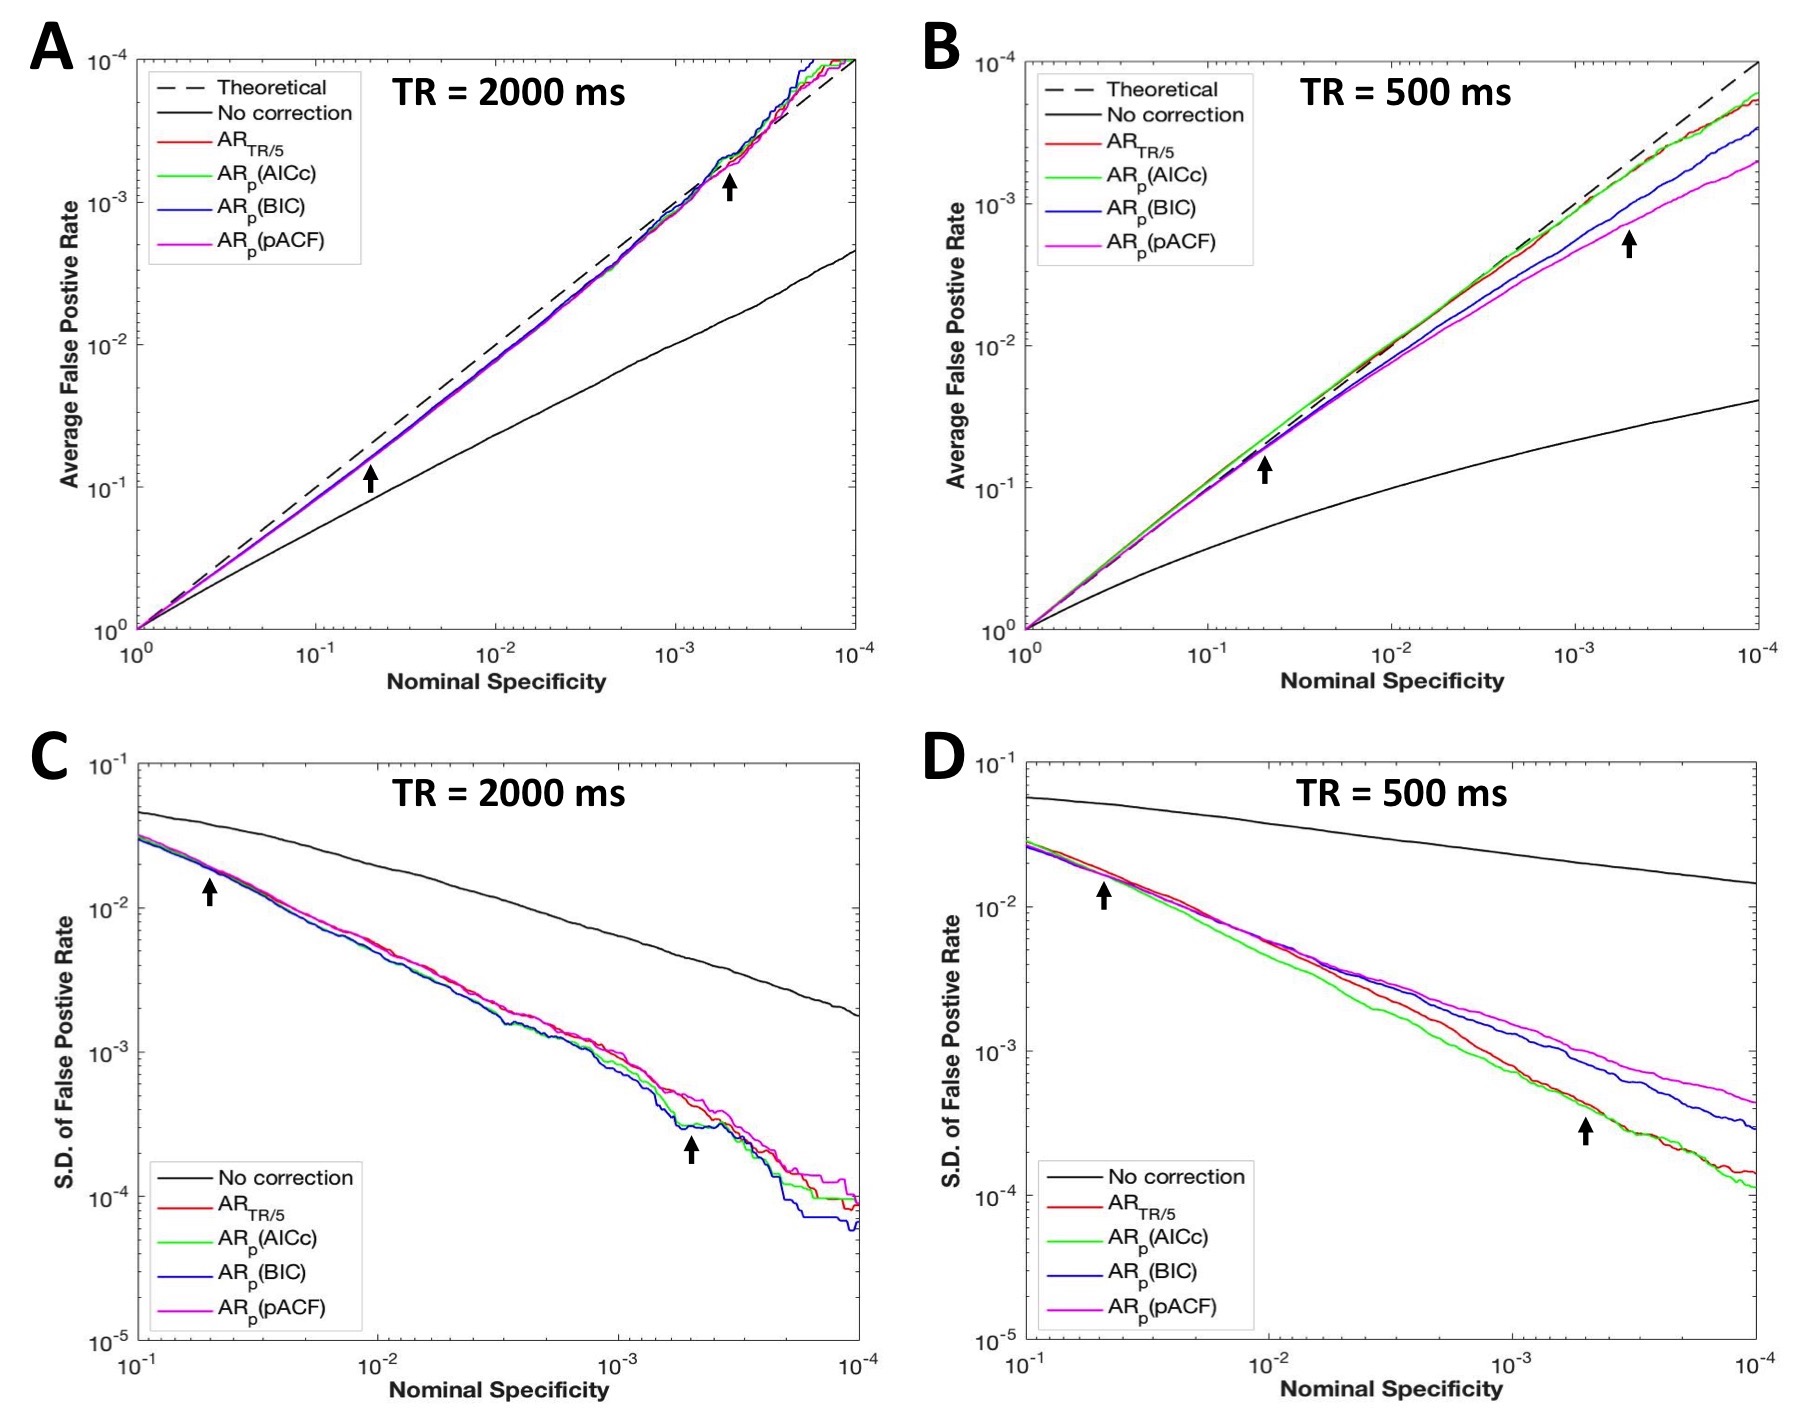
The performances of OS criteria varied within and between subjects (Fig. 3). At TR=500ms, the BIC and pACF methods showed relatively large overestimation in some subjects (Fig. 3B), while the FDC of the AICc and TR/5 methods were much closer to the theoretical prediction. The group average result (Fig. 4) indicated that in the range of nominal specificity (5x10⁻⁴ to 5x10⁻²) usually used in fMRI studies, all the methods can accurately correct the SC effect and had similar performance at TR=2000ms. At TR=500ms, the AICc and TR/5 criteria had smaller average FDC deviations and inter-subject variability than the BIC and pACF methods.
Conclusions and Discussion
We evaluated and compared the accuracies of AR model in SC correction using different OS criteria. Our results demonstrated that all the OS methods perform equally well in conventional fMRI experiments with TR=2s. For SMS-EPI with shorter TRs, we determined that the AICc and TR/5 methods without the spatial regularization provide the best correction accuracy.
Compared to the TR/5 method, the AICc is more computationally demanding. The AICc analysis took about 3min using 12 parallel MATLAB threads, while the TR/5 method only needed about 20sec with a single thread. Thus, the TR/5 method can be chosen if the computation efficiency is a concern in practice. However, the performance of AICc has slightly smaller inter-subject variability than the TR/5 criterion (Fig. 4D), so we recommend the use of AICc method to achieve the best correction for serial correlation in SMS-EPI fMRI studies.
Acknowledgements
No acknowledgement found.References
1. Nunes, R., Hajnal, J.V., Golay, X., Larkman, D.J., 2006. Simultaneous slice excitation and reconstruction for single shot EPI. The Annual Meeting of ISMRM, Seattle.
2. Moeller, S., et al., 2010. Multiband multislice GE-EPI at 7 Tesla, with 16-fold acceleration using partial parallel imaging with application to high spatial and temporal whole-brain fMRI. Magn Reson Med 63: 1144–1153.
3. Feinberg, D.A., et al., 2010. Multiplexed echo planar imaging for sub-second whole brain FMRI and fast diffusion imaging. PLoS ONE 5: e15710.
4. Friston, K. J., Jezzard, P. J., and Turner, R., 1994. Analysis of functional MRI time-series. Hum Brain Mapp 1: 153–171.
5. Sahib, A.K., et al., 2016. Effect of temporal resolution and serial autocorrelations in event-related functional MRI. Magn Reson Med 76:1805-1813.
6. Chen, J., Glover, G.H., 2017. Modeling serial correlations of fMRI time series collected by faster TRs. The Annual Meeting of ISMRM, Honolulu.
7. McDowell, A., Carmichael, D., 2017. Effect of short TRs on fMRI sensitivity while controlling for temporal auto-correlation. The Annual Meeting of OHBM, Vancouver.
8. Worsley, K.J., et al., 2002. A general statistical analysis for fMRI data. Neuroimage 15:1–15.
9. Woolrich, M.W., Ripley, B.D., Brady, M., Smith, S.M., 2001. Temporal autocorrelation in univariate linear modeling of FMRI data. NeuroImage 14: 1370–1386.
10. Purdon, P. L., and Weisskoff, R. 1998. Effect of temporal autocorrelations due to physiological noise stimulus paradigm on voxel-level false positive rates in fMRI. Hum Brain Mapp 6: 239–249.
11. Setsompop, K., et al., 2012. Blipped-controlled aliasing in parallel imaging for simultaneous multislice echo planar imaging with reduced g-factor penalty. Magn Reson Med 67:1210–1224.
12. Glover, G., Li, T.Q., Rees, D. 2000. Image-based method for retrospective correction of physiological motions effects in fMRI: RETROICOR. Magn Reson Med. 44:162-167.
13. Chang, C., Glover, G.H., 2009. Effects of model-based physiological noise correction on default mode network anti-correlations and correlations. Neuroimage 47:1448–1459.
14. Cox, RW. 1996. AFNI: software for analysis and visualization of functional magnetic resonance neuroimages. Comput Biomed Res 29:162-173.
15. Hurvich, C. M., Tsai, C. L., 1989. Regression and time series model selection in small samples. Biometrika 76:297-307.
16. Schwarz, G., 1978. Estimating the dimension of a model. Annals of Statistics 6:461–464.
Figures