2382
Mouse BOLD fMRI at 15.2 T: Detection of the entire somatosensory pathway including thalamic nuclei1Cener for Neuroscience Imaging Research (CNIR), Institute for Basic Science (IBS), Suwon, Republic of Korea, 2Department of Biomedical Engineering, Sungkyunkwan University, Suwon, Republic of Korea, 3Department of Health Sciences and Technology (SAIHST), Sungkyunkwan University, Seoul, Republic of Korea
Synopsis
BOLD-functional MRI is a useful tool to identify the brain function and to examine the functional effects on development, recovery, and reorganization. The most common stimulus-paradigm is the electrical forepaw/hindpaw stimulation to generate the evoked BOLD response. Although specific brain areas are involved in the somatosensory system, most studies in the anesthetized rodents have focused on the somatosensory cortex as it is difficult to detect activation in the subcortical areas. BOLD sensitivity is dependent on the field strength and affected by physiological condition under the anesthesia. Here, we demonstrated the thalamo-cortical BOLD response in mice under the ketamine-xylazine at 15.2T.
Purpose
In functional somatosensory pathway, afferent peripheral fibers in forepaw project into ventral thalamic nuclei (Thal), and finally to primary (S1) and secondary somatosensory cortex1. If fMRI measures index of neural activities with high fidelity, it should detect signal changes in entire sensory network. However, most of the rodent fMRI studies under anesthesia have reported responses mostly in the somatosensory cortex2. Even if BOLD response was observed in the thalamus region, it was very weak3. These animal fMRI observations are acceptable for biophysics research, but not for functional network analysis and neuroscience research. Here, we performed mouse BOLD-fMRI studies of the whole brain at 15.2T and found activities at the entire sensory network in the first time on the best of our knowledge.Materials & Methods
Seven C57BL/6 mice (23-27g) were performed fMRI studies on 15.2T/11cm MRI system (Bruker BioSpec, Billerica, MA, USA) with surface Tx/Rx coil (15mm i.d). Mice were initially anesthetized with mixture of ketamine and xylazine (100mg/kg and 10mg/kg, respectively, IP). To maintain the anesthesia condition, supplementary anesthesia (25mg/kg and 1.25mg/kg, respectively, IP) was administrated intermittently. The electrical stimulus parameters on left forepaw were pulse width of 0.5ms, frequency of 4Hz and current intensity of 0.3mA. BOLD-fMRI data were acquired using two-shot GE-EPI sequence: TR for each shot = 750ms, flip angle=50°, number of segment=2, FOV=18×12mm2, matrix=96×64, echo spacing=320μs, in-plane resolution=188×188μm2, slice thickness=500μm, number of slice=9 coronal slices, and dummy scans=10. Each stimulus run consisted of 30-volume pre-stimulus, 10-volume stimulus, 35-volume inter-stimulus, 10-volume stimulus and 35-volume post-stimulus period. To determine the source of BOLD signals, three-echo times of 10, 15, and 20ms were interleaved. 9-15 fMRI trials were obtained for each TE. Anatomic images were obtained using FLASH: TR/TE=435ms/2.8ms, NEX=5, FOV=20x20mm2, matrix=256×256, in-plane resolution=78×78μm2, slice thickness=300μm, and 50 coronal slices. To measure relative CBV, baseline R2* changes induced by monocrystalline iron oxide nanoparticles(MION, 5mg/kg) were acquired using multi-gradient echo sequence before and after the intravenous injection of MION, respectively. All data for each animal were averaged and BOLD response was identified using AFNI and ANTs packages.Results
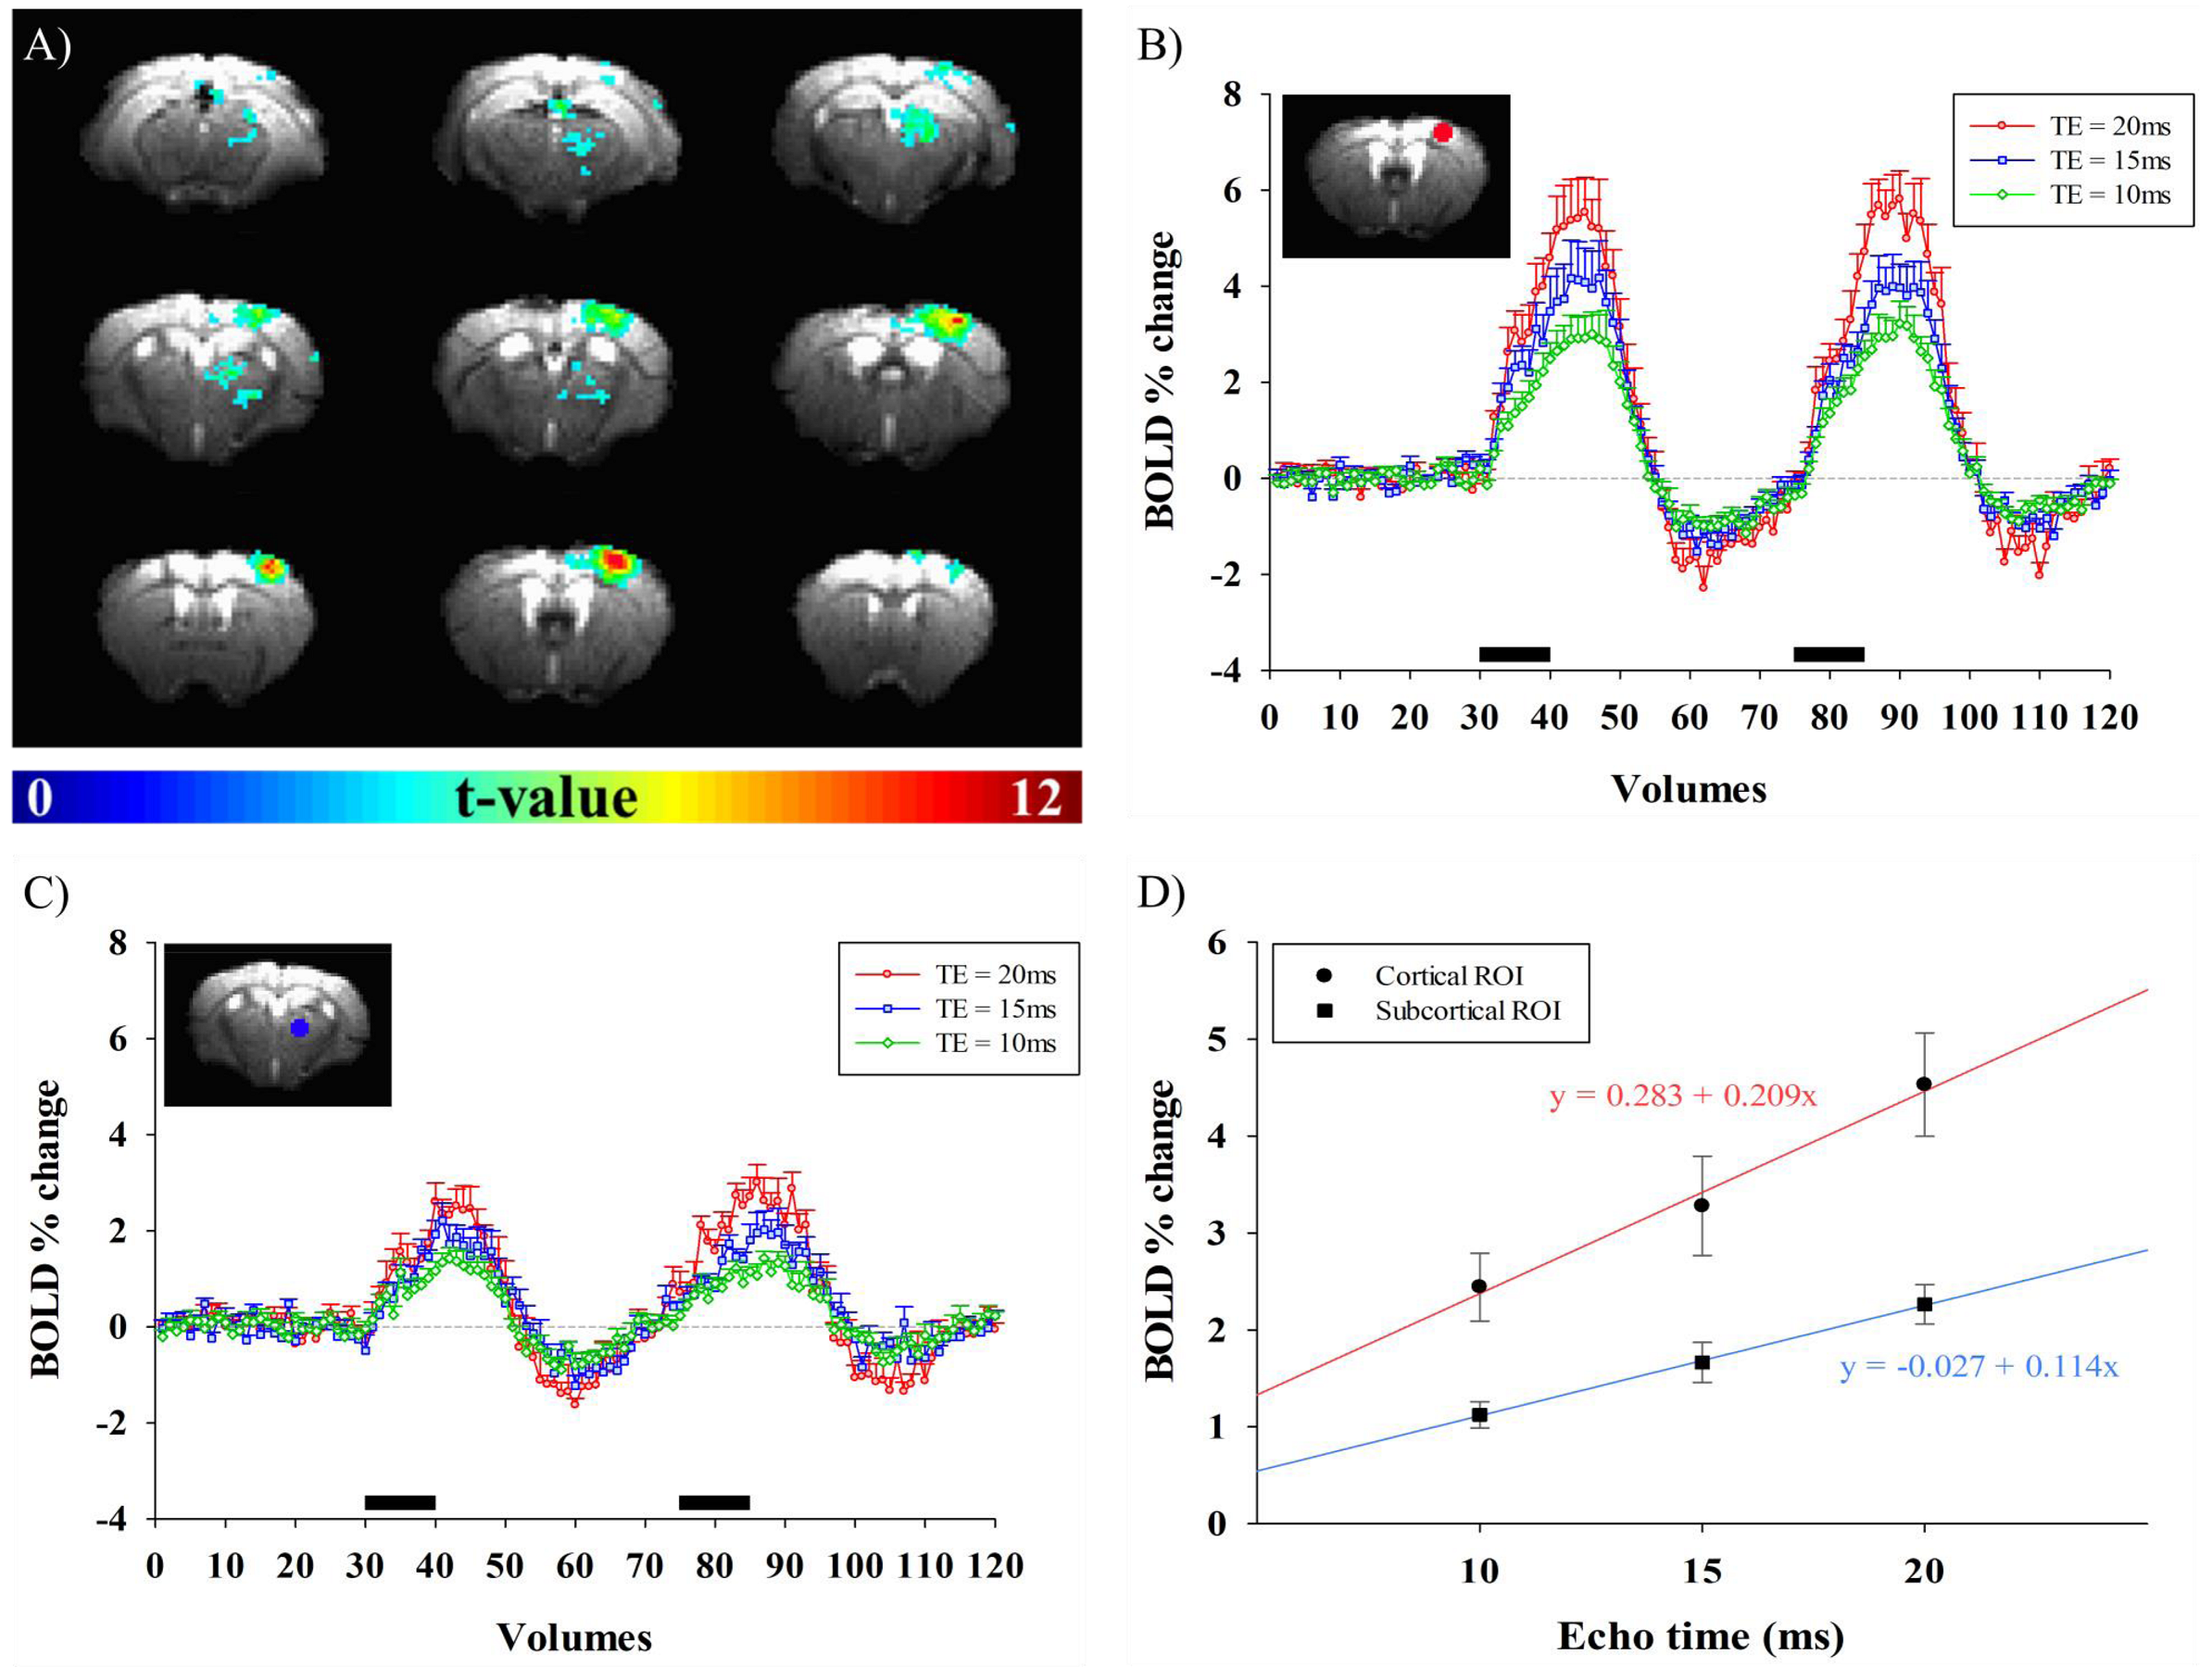
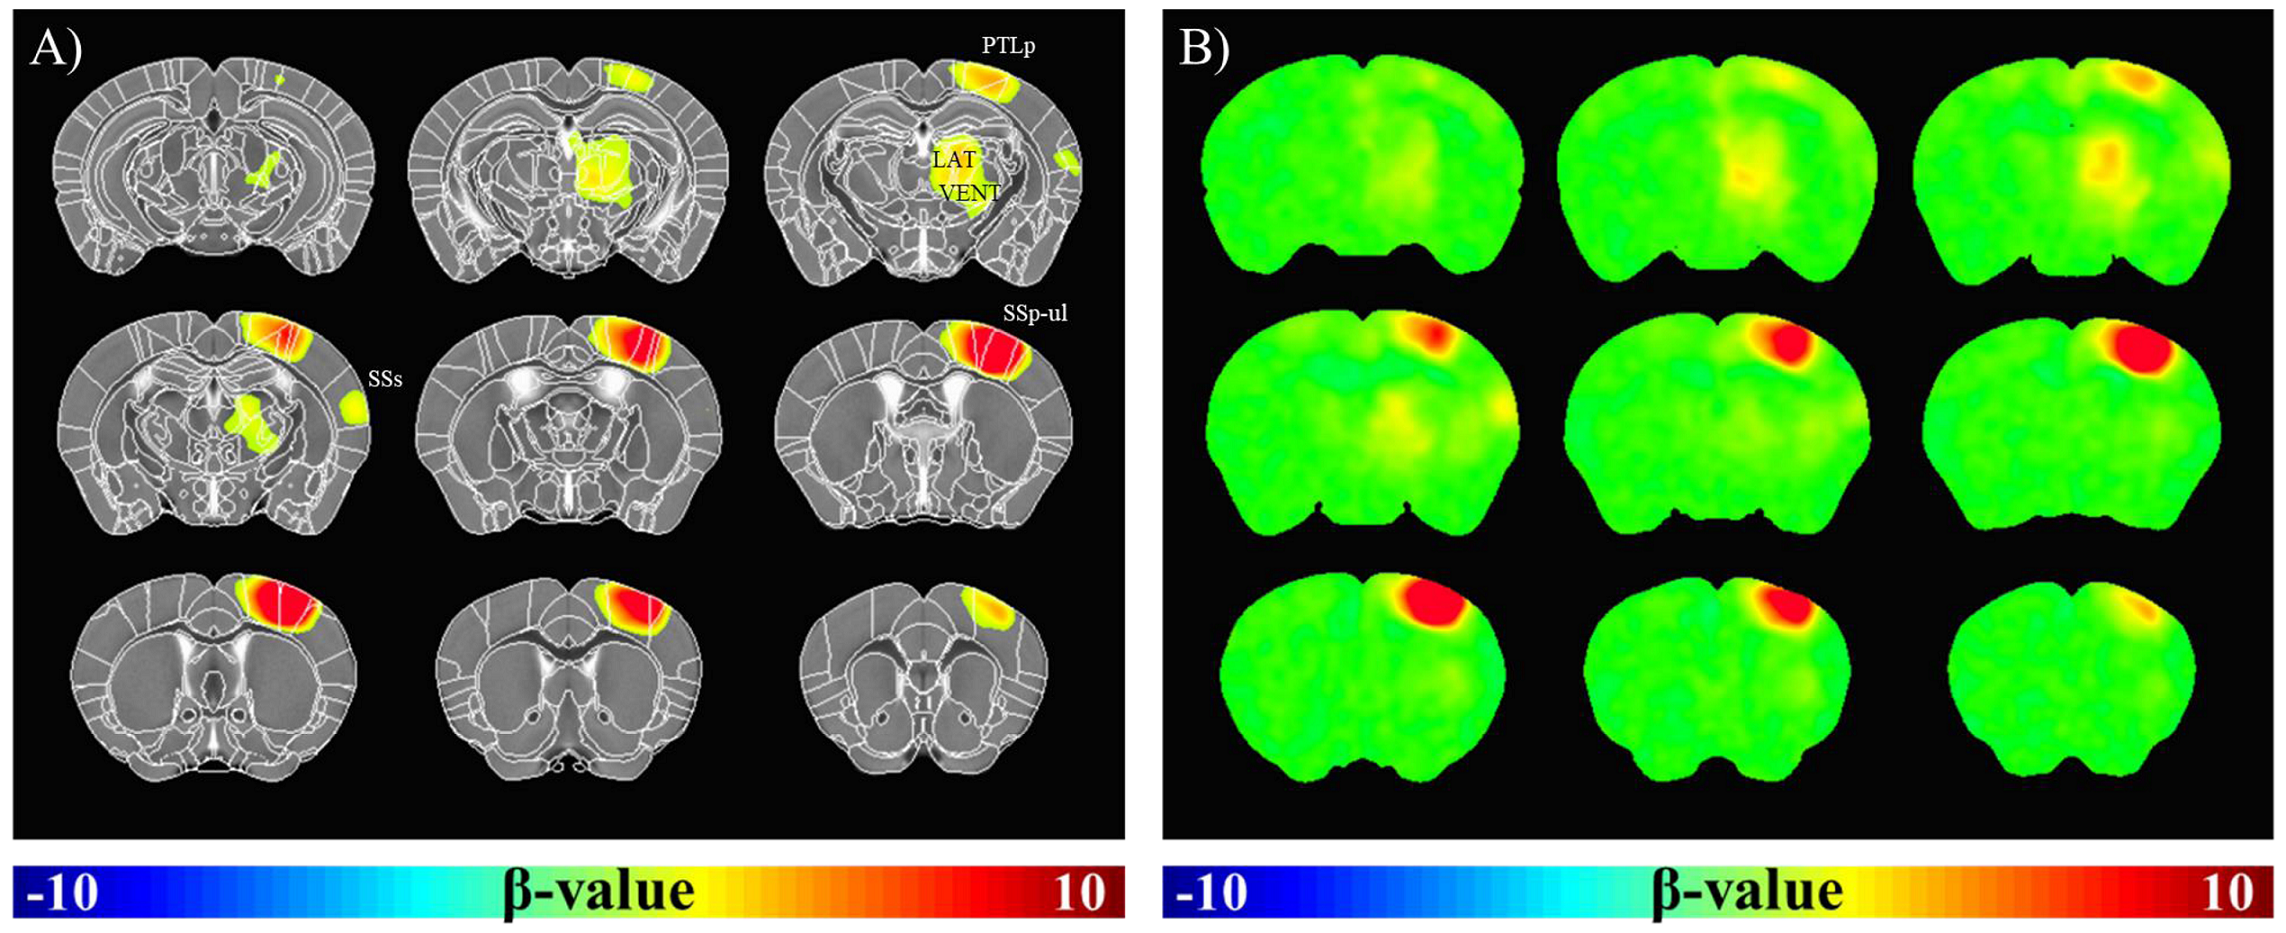
Fig.1A shows BOLD fMRI maps with TE of 10ms, overlaid on the original EPI images of one representative animal. Clearly, BOLD response was observed not only in the right somatosensory cortex, but also in the right thalamus. TE-dependence of BOLD percent change can provide an insight into source of fMRI signals. Thus, mean signal time series were calculated within spherical S1 and Thal ROIs in each animal and plotted in Fig.1B-C. We observed that percent changes in both regions were linearly dependent on TE (Fig.1D). The intercept means the non-BOLD sources such as inflow effects, while the slope is extravascular BOLD effect (ΔR2*)4,5. Our data suggests that S1 has higher inflow and BOLD effects than Thal. Functional ΔR2* is related to change in total # of deoxyhemoglobins (≈ baseline blood volume × oxygen saturation change)6. The ratio of functional R2* changes (S1/Thal=1.83) may simply reflect baseline CBV. Thus, relative baseline CBV distribution was determined by injection of contrast agent; a ratio of CBV (S1/Thal) is 0.92. Therefore, difference in functional ΔR2* between S1 and Thal is indeed related to different oxygen saturation level change. To generate group-averaged fMRI maps, multi-TE data were averaged. In group fMRI maps (Fig.2), BOLD response was localized in contralateral cortical and subcortical areas, including primary/secondary somatosensory cortex and lateral/ventral nuclei of dorsal thalamus.Discussion & Conclusion
Unlike the most rodent fMRI studies, we clearly observed TE-dependent BOLD fMRI responses in contralateral sensory network during forepaw stimulation in mice. In our 9.4T mouse fMRI studies, localized S1 activity was detected at somatosensory cortex contralateral to the stimulating paw, but not obvious in the thalamus. The reason to observe the entire sensory network at 15.2T is partly due to the enhanced functional sensitivity with higher magnetic field; i) higher signal intensity and ii) higher percent change at 15.2T than 9.4T. With extremely high spatial resolution, tSNR is closely related to SNR and SNR is linearly related to magnetic field strength. BOLD percent change is at least linearly dependent on magnetic field strength. Combining these enhancements will allow us to detect the entire sensory network in single animal basis. Group averaging is possible due to minimal image distortions in EPI images. Our fMRI maps are consistent with anatomical tracing data obtained with the viral tracer injected into the S1 by Allen Mouse Brain Connectivity Atlas7. Ultra-high-field fMRI of mouse opens a new research avenue for investigating functional circuits in whole brain noninvasively and repeatedly, allowing investigations of functional development, recovery, and reorganization in normal and transgenic models.Acknowledgements
This work was supported by IBS-R015-D1.References
1. Paxinos G. The rata nervous system, 4th ed. Academic press; 2014.
2. Weber R, Ramos-Cabrer P, Wiedermann D, et al. A fully noninvasive and robust experimental protocol for longitudinal fMRI studies in the rat. Neuroimage. 2006;29(4):1303-10.
3. Keilhoz SD, Silva AC, Raman M, et al. Functional MRI of the rodent somatosensory pathway using multislice echo planar imaging. Magn Reson Med. 2004;52(1):89-99.
4. Bandettini PA, Wong EC, Jesmanowicz A, et al. Spin-echo and gradient-echo EPI of human brain activation using bold contrast: A comparative study at 1.5 T. NMR in Biomedicine. 1994;7(1-2):12-20.
5. Jin T. Wang P, Tasker M, et al. Source of Nonlinearity in Echo-Time-Dependent BOLD fMRI. Magn Reson Med. 2006;55(6):1281-1290.
6. Kim SG, Ogawa S. Biophysical and Physiological Origins of Blood Oxygenation Level-Dependent fMRI Signals. J Cereb Blood Flow Metab. 2012;32(7):1188-206.
7. Oh SW, Harris JA, Lydia NG, et al. A mesoscale connectome of the mouse brain. Nature. 2014;508(7495):207-14.
Figures