2381
Field strength dependent somatosensory-evoked mouse fMRI: 9.4 T vs. 15.2 T1Cener for Neuroscience Imaging Research (CNIR), Institute for Basic Science (IBS), Suwon, Republic of Korea, 2Department of Biomedical Engineering, Sungkyunkwan University, Suwon, Republic of Korea, 3Department of Health Sciences and Technology (SAIHST), Sungkyunkwan University, Seoul, Republic of Korea
Synopsis
BOLD fMRI is highly sensitive to magnetic field strength. However, there is a notion that 7–9.4T is an optimal field strength for fMRI and higher fields do not increase BOLD signal changes. Here, we compared the BOLD response in the mouse somatosensory cortex at both magnetic fields of 9.4T and 15.2T to determine the BOLD dependence on magnetic field strength and found that the BOLD fMRI response is indeed increased as the field strength increases.
Purpose
BOLD fMRI is highly sensitive to magnetic field strength. Two important issues are related to field strength; temporal SNR (tSNR) and stimulus-induced BOLD percent change. In general, higher fields increase SNR, but physiological fluctuations cause no improvement in tSNR. However, when the thermal noise is dominant such as extremely high resolution, higher fields will improve SNR and tSNR1. Secondly, there is a notion that 7–9.4T is an optimal field strength for fMRI2,3 and higher fields do not increase BOLD percent changes. To investigate whether the BOLD percent change is indeed a plateau at 9.4T, we measured GE BOLD fMRI of mouse brain induced by forepaw stimulation at both magnetic fields of 9.4T and 15.2T.Materials & Methods
Fourteen C57BL/6 mice (23-27g) were initially anesthetized with a mixture of ketamine and xylazine (100mg/kg and 10mg/kg, respectively, IP). To maintain the anesthesia condition, supplementary anesthesia (25mg/kg and 1.25mg/kg, respectively, IP) was administrated intermittently. Seven mice were performed fMRI studies each on 9.4 T and 15.2 T MR systems (Bruker BioSpec, Billerica, MA, USA). The 9.4T used a volume Tx coil (86mm i.d) and surface Rx coil (10mm i.d) combination, while 15.2T used a surface Tx/Rx coil (15mm i.d). Parameters of left forepaw sensory stimulation were a pulse width of 0.5ms, a frequency of 4Hz and a current intensity of 0.5mA at 9.4T and 0.3mA at 15.2T. GE EPI parameters were similar between two magnetic fields except # of segment and TR; same spatial resolution (188×188×500μm3), echo time spacing=320μs, sampling frequency=300KHz, TE=16 or 15ms, FOV=18×12mm2, matrix=96×64, and number of slice=9. The different parameters were number of segment (1 for 9.4T vs. 2 shots for 15.2T) and TR (1 vs. 1.5s). Stimulation paradigms consisted of 40 control–20 stimulation–60 control for 9.4T (120s) and 30 control–10 stimulation–35 control–10 stimulation–35 control images for 15.2T (180s). For the group analysis in a common space, anatomic images were also acquired. All data for each animal were averaged and evoked BOLD response was identified using the Analysis of Functional NeuroImages (AFNI) and Advanced Normalization Tools (ANTs) packages.Results
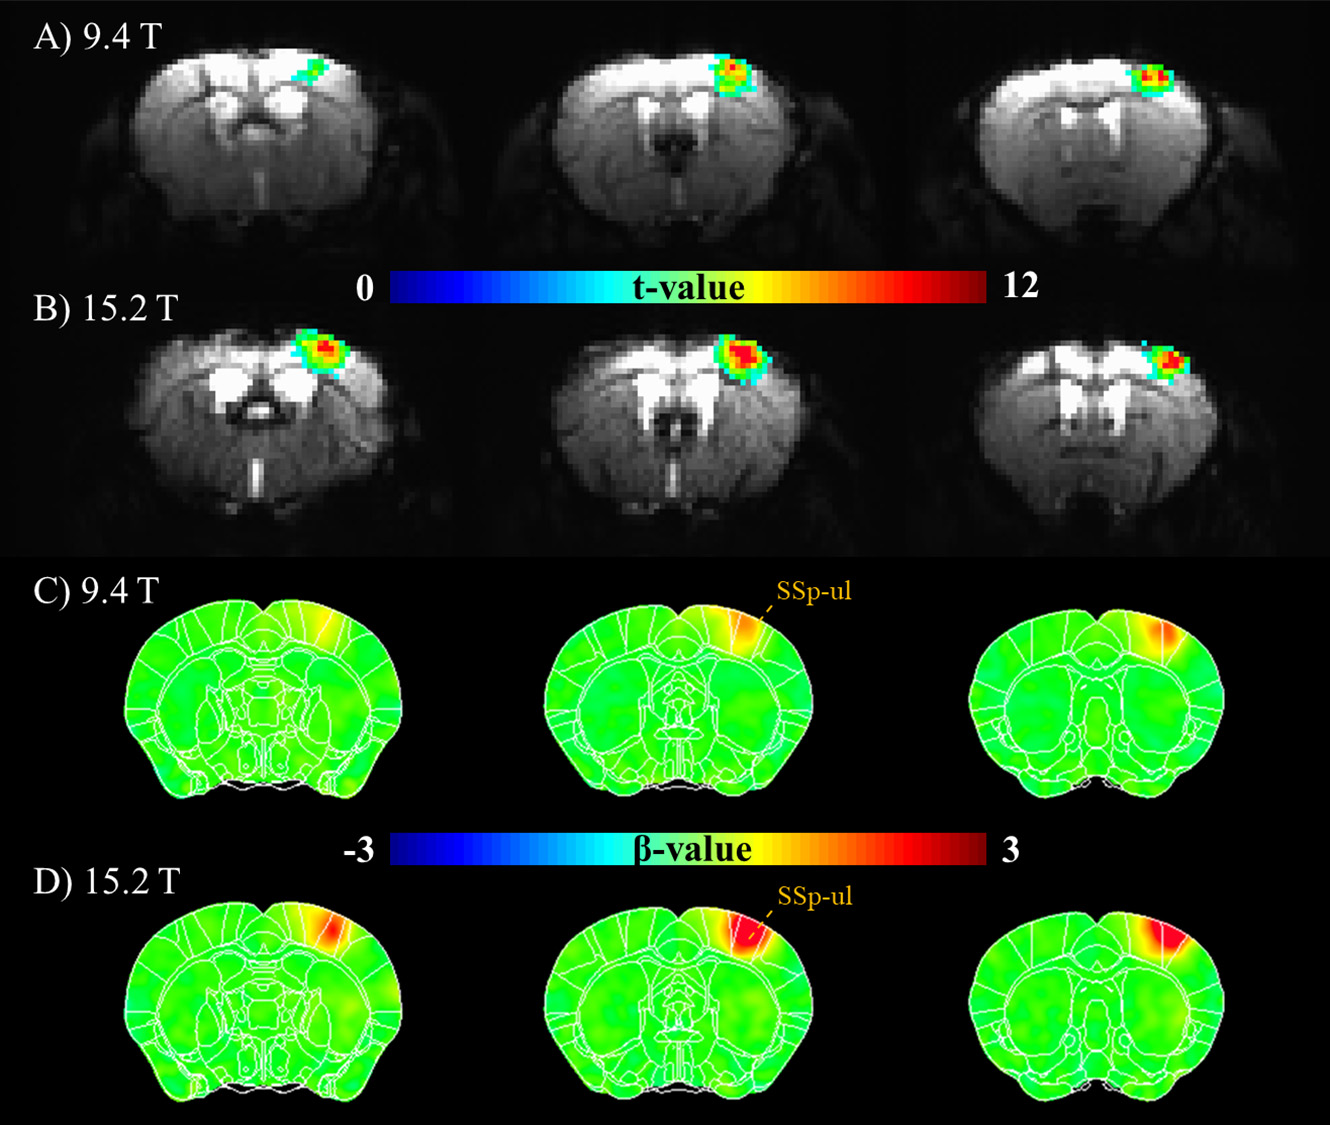
Fig. 1A and 1B show BOLD fMRI maps (t value > 3, cluster size > 20) overlaid on EPI images in one representative animal. Clearly, localized right somatosensory cortex responding to left forepaw stimulation was activated in both fields. Higher t-values were observed at 15.2T. Due to the difference of RF coils and imaging parameters used, it is difficult to compare SNR and tSNR. However, the number of active voxels above thresholds were detected significantly higher at 15.2T than 9.4T (340±30 SEM vs. 230±35, p=0.034, independent t-test). In the group-averaged analysis (n=7), the activated area was again localized spatially in the contralateral primary somatosensory area of upper limbs (SSp-ul) as defined in the Allen brain atlas in Fig. 1C and 1D. The mean t-values within the SSp-ul ROI were also higher at 15.2T than 9.4T (12.9±0.98 SEM vs. 8.0±0.8, p=0.003). BOLD peak amplitudes within contralateral SSp-ul ROI were 1.56±0.38 % at 9.4T and 2.69±0.38 % at 15.2T (p=0.017).Discussion & Conclusion
In this study, we demonstrated the localized BOLD signal in the contralateral somatosensory cortex, which is increased with an increase in field strength. A smaller receiver coil at 9.4T (10mm vs. 15mm i.d), and a higher stimulation current (0.5 vs. 0.3mA) favor the 9.4T sensitivity over 15.2T. However, our finding is opposite to the expected results from literature2,3. Clearly, t-value and # of active voxels increase at 15.2T, indicating that tSNR and contrast-to-noise ratio are improved at 15.2T. Since TE sets similarly for both fields, it is fair to compare percent change; a percent change ratio of 1.7 is higher than a magnetic field ratio of 1.6 even though a lower stimulation current was used at 15.2T (0.3 vs. 0.5mA). If the same stimulation strength is applied, it is expected at least 2 times BOLD percent change improvement at 15.2T compared to 9.4T. This is quite different from previous rat fMRI data at 7.0T and 11.7T3, which may be due to different species. However, in our previous rat BOLD fMRI studies, we also observed similar sensitivity gain at 15.2T4, indicating difference species (mouse vs. rat) is not the major reason and the exact sources of differences are unknown. With further optimization of 15.2T with coil improvements, an ultra-high-field fMRI can be a viable tool for transgenic mouse research in determining gene vs. function at a longitudinal manner.Acknowledgements
This work was supported by IBS-R015-D1.References
1. Triantafyllou C, Hoge RD, Krueger G, Comparison of physiological noise at 1.5 T, 3 T and 7 T and optimization of fMRI acquisition parameters. Neuroimage. 2005;26(1):243-50.
2. Uludag K, Muller-Bierl B, Ugurbil K. An integrative model for neuronal activity-induced signal changes for gradient and spin echo functional imaging. Neuroimage 2009;48:150-165.
3. Seehafer JU, Kalthoff D, Farr TD, et al. No increase of the blood oxygenation level-dependent functional magnetic resonance imaging signal with higher field strength: implications for brain activation studies. J Neurosci. 2010;30(15):5234-41.
4. Han SH, Park JY, Jeong WC and Kim SG, Spin echo and Gradient echo BOLD fMRI at ultrahigh magnetic field of 15.2T. Proc. Intl. Soc. Mag. Reson. Med. 2017;25:5254.
Figures