2380
Comparing cortical layer activation using gradient echo with phase regression and spin echo in the human visual cortex1Medical Biophysics, The University of Western Ontario, London, ON, Canada, 2Centre for Functional and Metabolic Mapping, The University of Western Ontario, London, ON, Canada
Synopsis
High resolution fMRI sequence selection is often a compromise between specificity to tissue (SE-EPI) and sensitivity to the BOLD effect (GE-EPI). Our work compared the laminar activation profiles of SE-EPI and GE-EPI once phase regression based macrovascular filtering has been applied. We demonstrated that GE-EPI with macrovascular filtering produces a laminar profile more similar to SE-EPI than GE-EPI without filtering. This shows that GE-EPI could be used for high resolution imaging and achieve a more sensitive profile when phase regression is included.
Purpose
High resolution functional MRI has the potential to unlock a greater understanding of cortical organization and to bridge the gap between invasive animal work and large scale network studies. One current consideration when using high resolution fMRI is the choice of which sequence to use during imaging, as every sequence comes with sensitivity and specificity tradeoffs1. Two commonly used sequences are spin-echo echo planar imaging (SE-EPI) which is more selective to microvascular BOLD contrast and gradient-echo EPI (GE-EPI), which is the most sensitive technique but suffers from contamination from large draining veins on the pial surface of the cortex. In addition, SE-EPI requires more transmit power thus increasing the SAR constraints of the imaging protocol and therefore practically limiting imaging parameters such as repetition time, number of slices and/or imaging volume. Here we investigate the effect of phase regression2 on GE-EPI and hypothesize that this method could provide a more sensitive solution to SE but with higher specificity than standard GE methods, ultimately optimizing laminar functional imaging.Methods
Two subjects underwent both GE-EPI (0.8mm isotropic voxels, TE=23ms, FA=60o, TR=2.5s, with GRAPPA factor 3) and SE-EPI (same except TE=41ms and FA=90o)3 fMRI at 7T using an 8 channel transmit, 32 channel receive coil optimized for imaging the occipital and parietal cortices4. Data was acquired on a 7 T neuro-optimized system with an AC84II gradient set (Siemens MAGNETOM, Erlangen, Germany) at the Centre for Functional and Metabolic Mapping in London, Ontario, Canada and had the approval of the University of Western Ontario Research Ethics Board. Three five-minute runs of visual stimulus were completed for each of the GE-EPI and SE-EPI acquisitions using a contrast reversing checkerboard paradigm with 20 seconds of stimulus and 30 second rest blocks. Phase data was combined from the GE-EPI sequences using receive sensitivity mapping5. An MP-RAGE volume (0.8mm isotropic voxels) was also collected to allow for surface reconstruction.
Analysis of the functional data was completed using FSL6 in a Nipype pipeline7. The magnitude data in each of the runs was motion corrected and registered to the first functional run, and percent signal change was calculated. The phase data was processed by temporally unwrapping the data, detrending the phase to compensate for frequency drift, and motion correcting and registering the phase images using the magnitude transformation parameters. Phase data was then regressed with the magnitude data using orthogonal distance regression and the resulting time series were used to filter the macrovascular signal out of the GE-EPI magnitude images. The percent signal change of these new time series was also calculated.
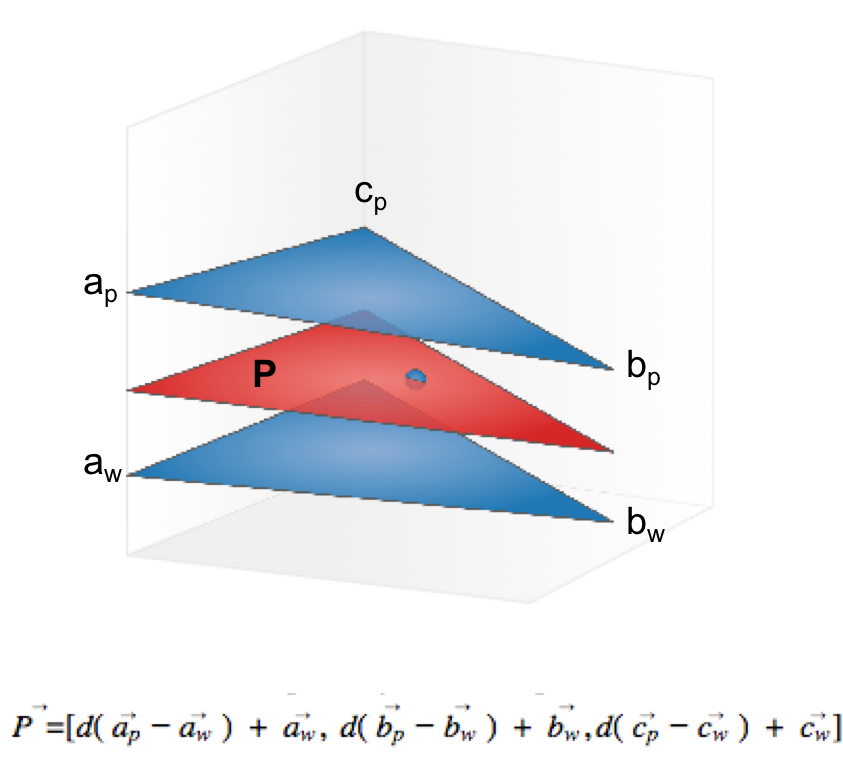
Structural data was intensity corrected and white matter and pial surfaces were created using Freesurfer tools8. Due to the partial nature of the occipital coil being incompatible with the full-brain image requirements of Freesurfer, all layer analysis was completed using in-house matlab code. The depth of each voxel was calculated by determining the plane between the cortical surface meshes that contains the voxel centroid (Figure 1). This depth was then used to sample the functional results and provide depth profiles across V1. This is not an anatomically based segmentation but instead was calculated to allow comparison of the cortical profiles for the different imaging methods. Registration of functional data to the structural data was completed using the AFNI9. V1 was delineated manually through labelling of the calcarine fissure.
Results
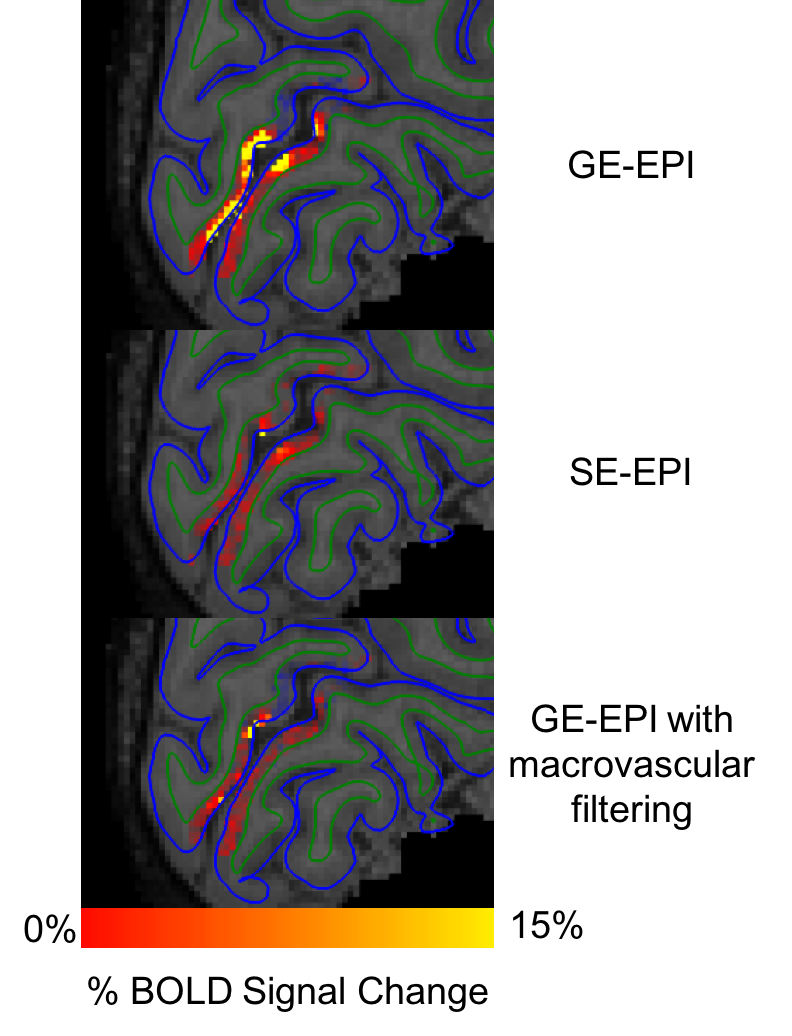
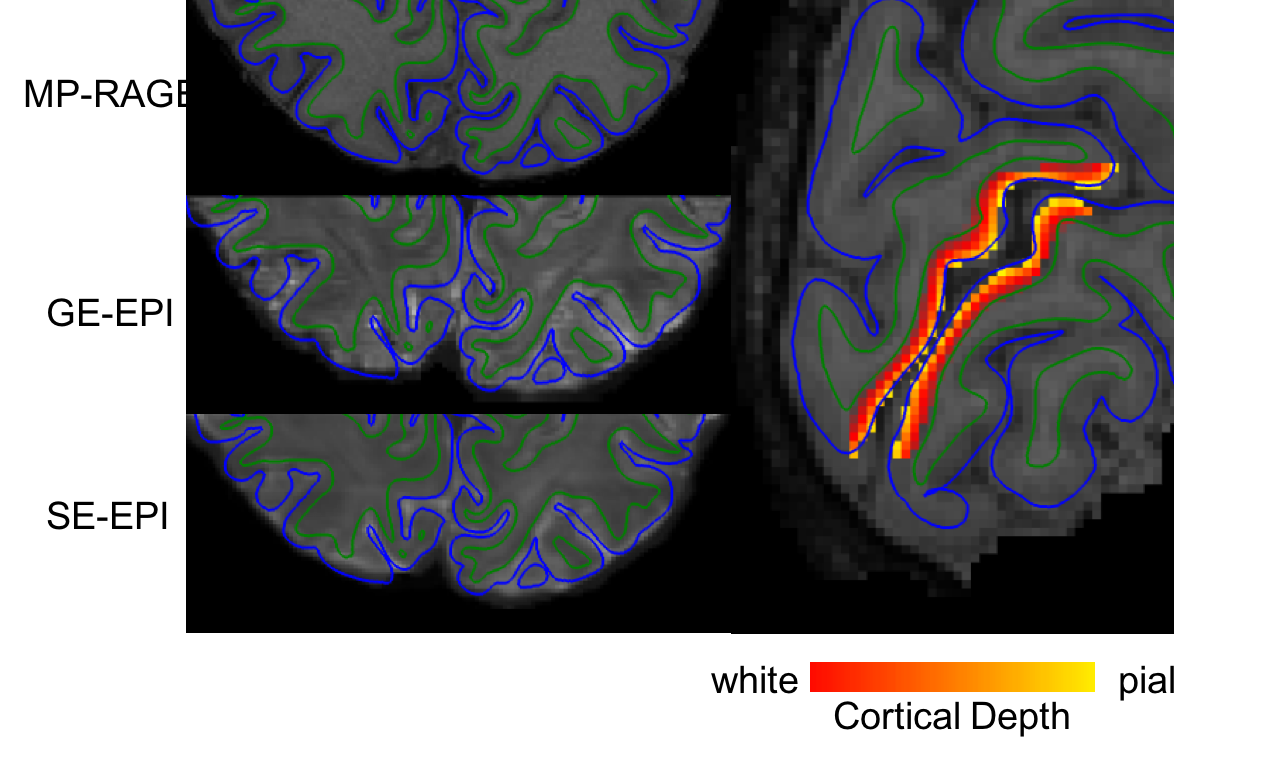
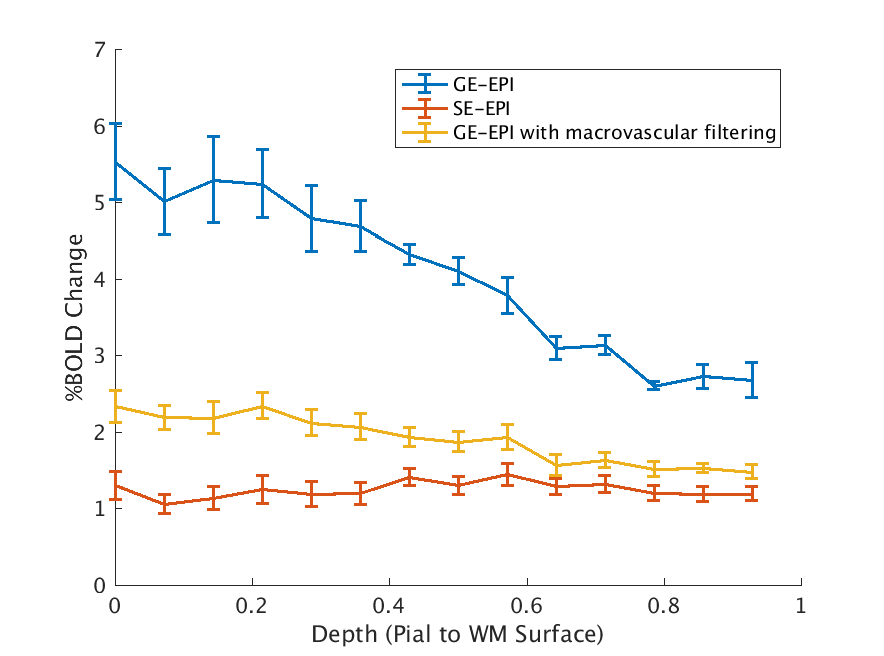
Figure 2 shows volumetric results of SE vs GE vs GE filtered data in % BOLD change. Figure 3 shows the registration quality from the functional data to structural surfaces as well as the depth calculations projected onto the structural data. Figure 4 shows the laminar profile of both subjects for GE-EPI, SE-EPI and GE-EPI with macrovascular filtering. This figure shows that there is a reduction in pial vessel bias when macrovascular filtering is used.Discussion and Conclusions
Due to the limitations of high resolution SE-EPI imaging when considering factors like echo time and SAR constraints, it would be advantageous to extract the same profiles from the GE-EPI method. Our work shows that GE-EPI with macrovascular filtering has a similar laminar profile to SE-EPI than to GE-EPI. This means that with the inclusion of phase processing it is possible to achieve SE-EPI type profiles with increased sensitivity using a GE-EPI sequence with fewer SAR restrictions.Acknowledgements
This work was supported by the Canadian Institutes of Health Research Foundation Grant to Dr. Ravi MenonReferences
1. Yacoub E, Shmuel A, Logothetis N, Uğurbil K. Robust detection of ocular dominance columns in humans using Hahn Spin Echo BOLD functional MRI at 7 Tesla. Neuroimage 2007;37:1161–1177.
2. Menon RS. Postacquisition suppression of large-vessel BOLD signals in high-resolution fMRI. Magn. Reson. Med. 2002;47:1–9.
3. Moeller S, Yacoub E, Olman CA, et al. Multiband multislice GE-EPI at 7 tesla, with 16-fold acceleration using partial parallel imaging with application to high spatial and temporal whole-brain fMRI. Magn. Reson. Med. 2010;63:1144–1153.
4. Gilbert KM, Gati JS, Menon RS. Occipital-Parietal Coil with variable-density element distribution for 7T functional imaging. Proc. Intl. Soc. Mag. Reson. Med. 2017;25.
5. Olivia W Stanley, Ravi S Menon, L Martyn Klassen. Absolute B1- estimation without a homogeneous receive coil.
6. Jenkinson M, Beckmann CF, Behrens TEJ, et al. FSL. Neuroimage 2012;62:782–790.
7. Gorgolewski K, Burns CD, Madison C, et al. Nipype: a flexible, lightweight and extensible neuroimaging data processing framework in python. Front. Neuroinform. 2011;5:13.
8. Dale AM, Fischl B, Sereno MI. Cortical surface-based analysis. I. Segmentation and surface reconstruction. Neuroimage 1999;9:179–194.
9. Cox RW. AFNI: Software for Analysis and Visualization of Functional Magnetic Resonance Neuroimages. Comput. Biomed. Res. 1996;29:162–173.
Figures