2379
Simultaneous acquisition of $$$T_1$$$ Maps and BOLD fMRI Signal During Brain Activation Using Multi-Echo EPI1School of Electrical and Computer Engineering, Purdue University, West Lafayette, IN, United States, 2Functional MRI facility, NIMH, National Institute of Health, Bethesda, MD, United States, 3Weldon School of Biomedical Engineering, Purdue University, West Lafayette, IN, United States
Synopsis
A quantitative $$$T_1$$$ map and blood oxygenation level-dependent (BOLD) signals are simultaneously measured during a flickering checkerboard using a multi-echo echo-planar imaging (ME-EPI) based fMRI sequence. The acquired EPI-based $$$T_1$$$ maps provide a means of tissue identification and allow direct comparison with BOLD activation maps on a voxel-wise basis, and thus offer an alternative of tissue segmentation and avoid the need for image registration between anatomical and functional imaging data
Introduction
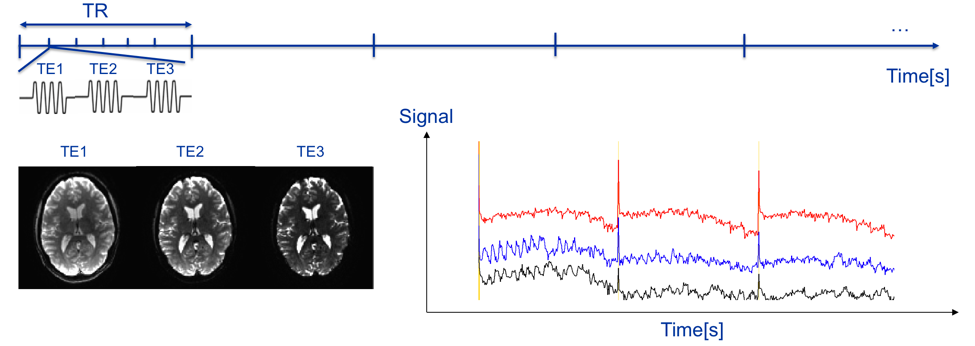
In multi-echo echo-planar imaging (ME-EPI)-based functional magnetic resonance imaging (fMRI), tissue activation is inferred from the blood oxygenation level dependence (BOLD) of the MR signal, which manifests as change in the apparent transverse magnetization time, $$$T_2^*$$$. The multi-echo EPI sequence is sensitive to changes in and, hence, a time-series of ME-EPI images can be used to infer local brain activation. In addition, the overall ME-EPI signal level is dependent on the longitudinal relaxation time, $$$T_1$$$, (which is often used to characterize the brain tissue), and the imaging flip angle. In this work, we aim to generate maps of the longitudinal relaxation time while detecting BOLD activation by employing a ME-EPI pulse sequence with varied flip angle scheme (ME-EPI-VF, see Fig. 1). The flip angle of the RF pulse is varied during the data acquisition to simulate the steady-state gradient echo sequence, in order to obtain the $$$T_1$$$ map; while the multi-echo scheme captures the BOLD signal changes. 1,2Methods
Two subjects (one male, one female) were scanned using a GE MR750, 3T MRI scanner with the GE 32-channel head coil.
For simultaneous fMRI and $$$T_1$$$ mapping, the vendor-supplied fMRI sequence was modified to create the ME-EPI-VF sequence which can collect images at multiple echo times (TEs), permits RF-spoiling and the use of time-varying flip angle schemes. For fMRI imaging, sequence parameters were: field-of-view 216mm; and acquisition matrix 108x108 with R=3 parallel imaging using ASSET. The use of 2mm isotropic voxels was chosen as a compromise between the desire for high resolution $$$T_1$$$ maps and the SNR requirements for BOLD imaging. Scan timing was TR=1000ms, to provide sensitivity to the difference in $$$T_1$$$ between grey and white matter; and TE=14.5ms, 38.0ms, 61.5ms for sensitivity to the BOLD contrast mechanism. Ten oblique slices were prescribed to cover the primary virtual cortex with 2mm thickness and 2mm spacing. The fMRI stimulation/task comprised a 600s scan composed of 10 cycles of a 20s exposure to a flickering checkerboard followed by 40s of fixation. BOLD and non-BOLD MR signal components were differentiated using the independent component analysis (ICA) based on TE-dependence in multi-echo fMRI.3
Images were acquired using several different flip angle schemes as follows. (1) A constant (80 degrees) flip angle. (2) A piecewise constant flip angle employing 5 different flip angles [10o, 30o, 50o, 70o, 90o] and each flip angle lasts for 20 TRs. (3) A gradually changing method in which 600 different flip angles (from 90o to 10o) are applied to avoid significantly disturbing magnetization steady-state; and (4) a rapidly varying flip angle scheme.
Inversion recovery (IR-FSE) was also employed to validate our acquired $$$T_1$$$ maps. IR-FSE images (FOV=256mm, matrix 256x256, slice thickness 2mm, ETL=16) for the same 10 slices were acquired with either 5 or 8 different inversion times (TIs) (TR=7000ms, TE=12.84ms, TIs=[100ms, 550ms, 900ms,1250ms, 1700ms, 2050ms, 2400ms, 3000ms]) with phase-sensitive image reconstruction used to construct $$$T_1$$$ maps.
Results and Discussion
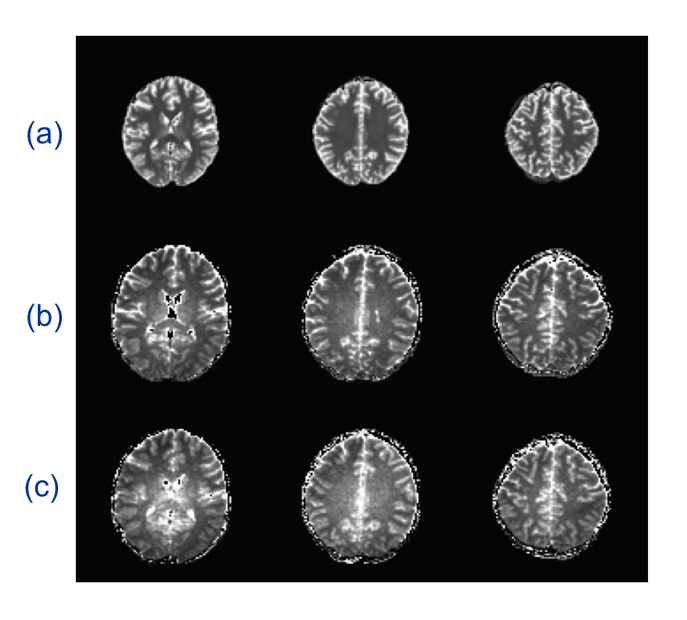
Representative images are shown for the piecewise constant flip angle, and gradually varied flip angle studies on the female subject.
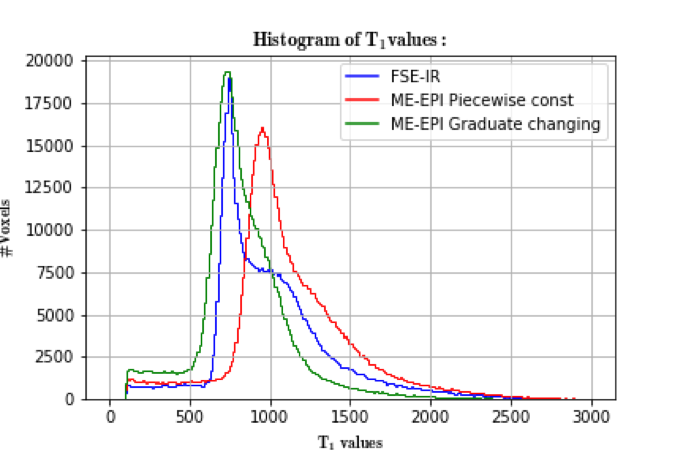
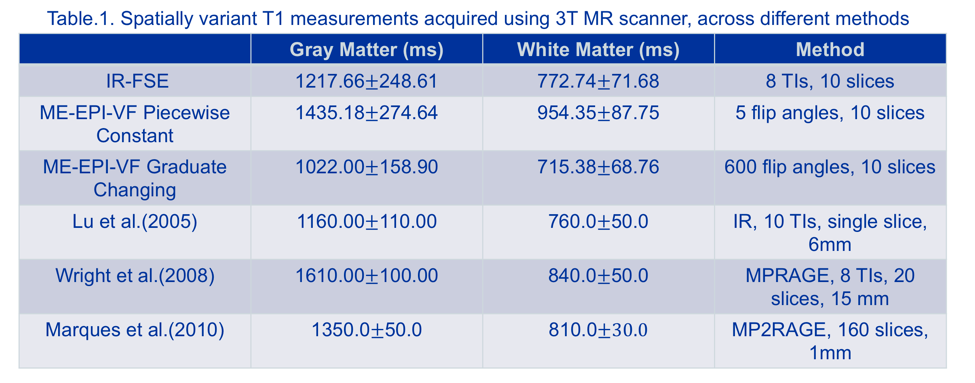
Fig. 2 depicts the $$$T_1$$$ map generated by the IR-FSE sequence and two different ME-EPI-VF sequences. Both ME-EPI-VF methods show the T1 contrast, however the piecewise constant method provides more image contrast in the ventricle area. Fig. 3 illustrates the $$$T_1$$$ histogram obtained through the IR-FSE sequence, and two ME-EPI-VF sequences. The $$$T_1$$$ histogram obtained from the ME-EPI-VF sequence with gradually changing flip angles is similar to the IR-FSE $$$T_1$$$ histogram. However, piecewise constant method reaches higher $$$T_1$$$ values in white matter and gray matter, which can be seen in Fig. 4. This is probably due to limited range of flip angles and short steady-state times. We speculate that the $$$T_1$$$ histogram could be improved if we choose 10 flip angles and hold each flip angle lasts for 60 TRs.
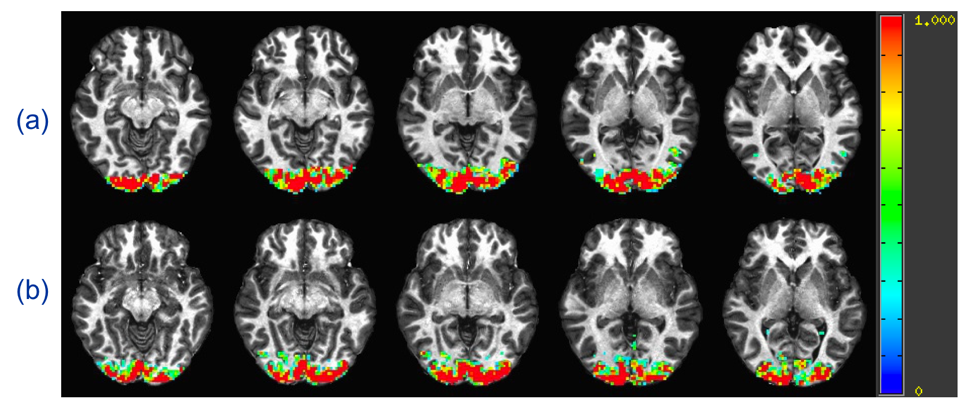
Fig. 5 plots the BOLD activation map from the standard ME-EPI sequence and ME-EPI-VF sequence with gradually changing flip angles. It is evidenced that ME-EPI-VF sequence with gradually changing flip angles, analogous to the regular fMRI sequences, is able to detect the brain activation without losing much sensitivity.
Conclusions
ME-EPI-VF with varied flip angles provides a rapid measurement of EPI-based $$$T_1$$$ map, and it is able to generate the $$$T_2^*$$$ map that can be used to extract the BOLD components. This novel pulse sequence can essentially acquire two different image modalities simultaneously. The overall goal of this study is to determine the extent that researchers can simultaneously embed other contrast information (diffusion coefficients, flip angle distribution, magnetization transfer, etc.) into an EPI time series.Acknowledgements
No acknowledgement found.References
[1] Cheng, H. L. M., & Wright, G. A. (2006). Rapid high‐resolution T1 mapping by variable flip angles: Accurate and precise measurements in the presence of radiofrequency field inhomogeneity. Magnetic resonance in medicine, 55(3), 566-574.
[2] Kundu, P., Inati, S. J., Evans, J. W., Luh, W. M., & Bandettini, P. A. (2012). Differentiating BOLD and non-BOLD signals in fMRI time series using multi-echo EPI. Neuroimage, 60(3), 1759-1770.
[3] Luh, W. M., Wong, E. C., Bandettini, P. A., Ward, B. D., & Hyde, J. S. (2000). Comparison of simultaneously measured perfusion and BOLD signal increases during brain activation with T1‐based tissue identification. Magnetic resonance in medicine, 44(1), 137-143.
[4] Marques, J. P., Kober, T., Krueger, G., Van de Zwaag, W., Van de Moortele, P. F., & Gruetter, R. (2010). MP2RAGE, a self bias-field corrected sequence for improved segmentation and T1-mapping at high field. Neuroimage, 49(2), 1271-1281.
Figures