2378
Quantifying Cerebral Activity during a Visual Stimuli using QSM and Multiband-EPI1Center for Functional and Metabolic Mapping, Robarts Research Institute, Western University, London, ON, Canada, 2Medical Biophysics, Western University, London, ON, Canada
Synopsis
Phase imaging and QSM abet the magnitude fMRI by revealing and quantifying the draining veins of the activation areas. Consequently, QSM sheds light on calibrating the % BOLD change and, when combined with CBF, has a potential to determine the basis of negative BOLD signal; in particular if it is due to increased oxygenation during rest periods or reduced oxygenation during the activation.
INTRODUCTION
INTRODUCTION: Quantitative susceptibility mapping (QSM) utilizes the MRI signal phase to generate a quantitative measure of the tissue susceptibility (χ)1. For a functional experiment, a higher temporal resolution can be attained by employing the multiband echo planar imaging (MB-EPI), which involves application of a multiband radio-frequency (RF) pulse2. In this study, we present (a) the feasibility of detecting and quantifying the change in oxygenation level for the draining veins tending to the activation region (visual cortex) during a visual task using MB-EPI; and (b) demonstrate the consistency of activation between functional MRI (fMRI) and QSM approaches.MATERIAL AND METHODS
Data Acquisition: Four healthy volunteers were scanned at 7T on a head-only system (Siemens, Magnetom Step 2.3, Erlangen, Germany) with a 2D MB-EPI (multiband factor=3) sequence (TE/TR=25ms/1250ms, flip-angle=50o, voxel size=1.6x1.6x1.6mm3) for 176 measurements during a 20-second block design of visual stimuli with a concentric checkerboard (flickering at 8Hz), presented on a grey background. Phase images were combined using the coil receive sensitivity (B1-) profiles3. Data Processing: After RF phase correction for inter-band phase differences introduced by the MB RF pulse4, the phase images were unwrapped5, demeaned, then center of k-space zeroed to adjust for any constant phase drift introduced between time points (TPs). A second order global polynomial fit was used to reduce remnant background components while preserving the phase from the activation region. The pre-processing of magnitude data was carried out in FMRI Expert Analysis Tool (FEAT) of FSL6. Motion correction parameters from the magnitude data were then applied to the demeaned phase. The ‘resting’ (excluding the undershoot TPs) and ‘active’ TPs were identified by selecting the bottom and top 25% of the design matrix (to avoid TPs acquired during the transitional states), and then averaged, respectively. ‘Active’ and ‘resting’ phase difference was utilised to generate a Dc map using the morphology enabled dipole inversion7. Δχ distributions were measured in both draining veins and areas of cortical activation. The draining vein contours were manually drawn to measure the mean of Δχ (or Δχv). Venous oxygenation level (Yv) of the draining vein was quantified by setting Δχdo to 4π×0.27ppm and the hematocrit to 0.44.RESULTS
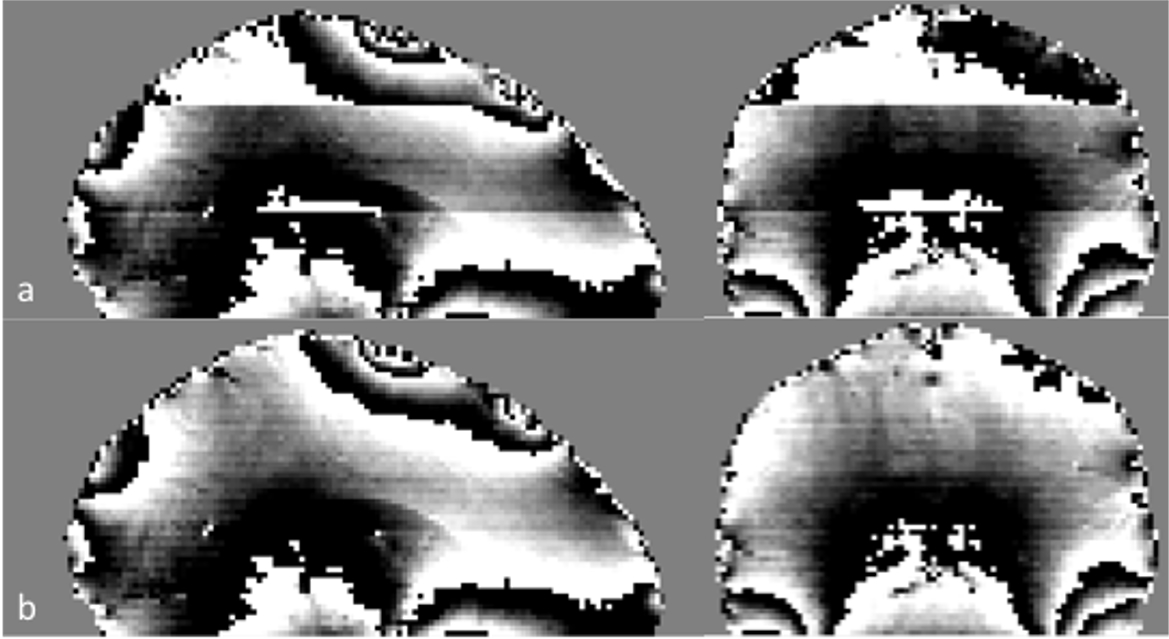
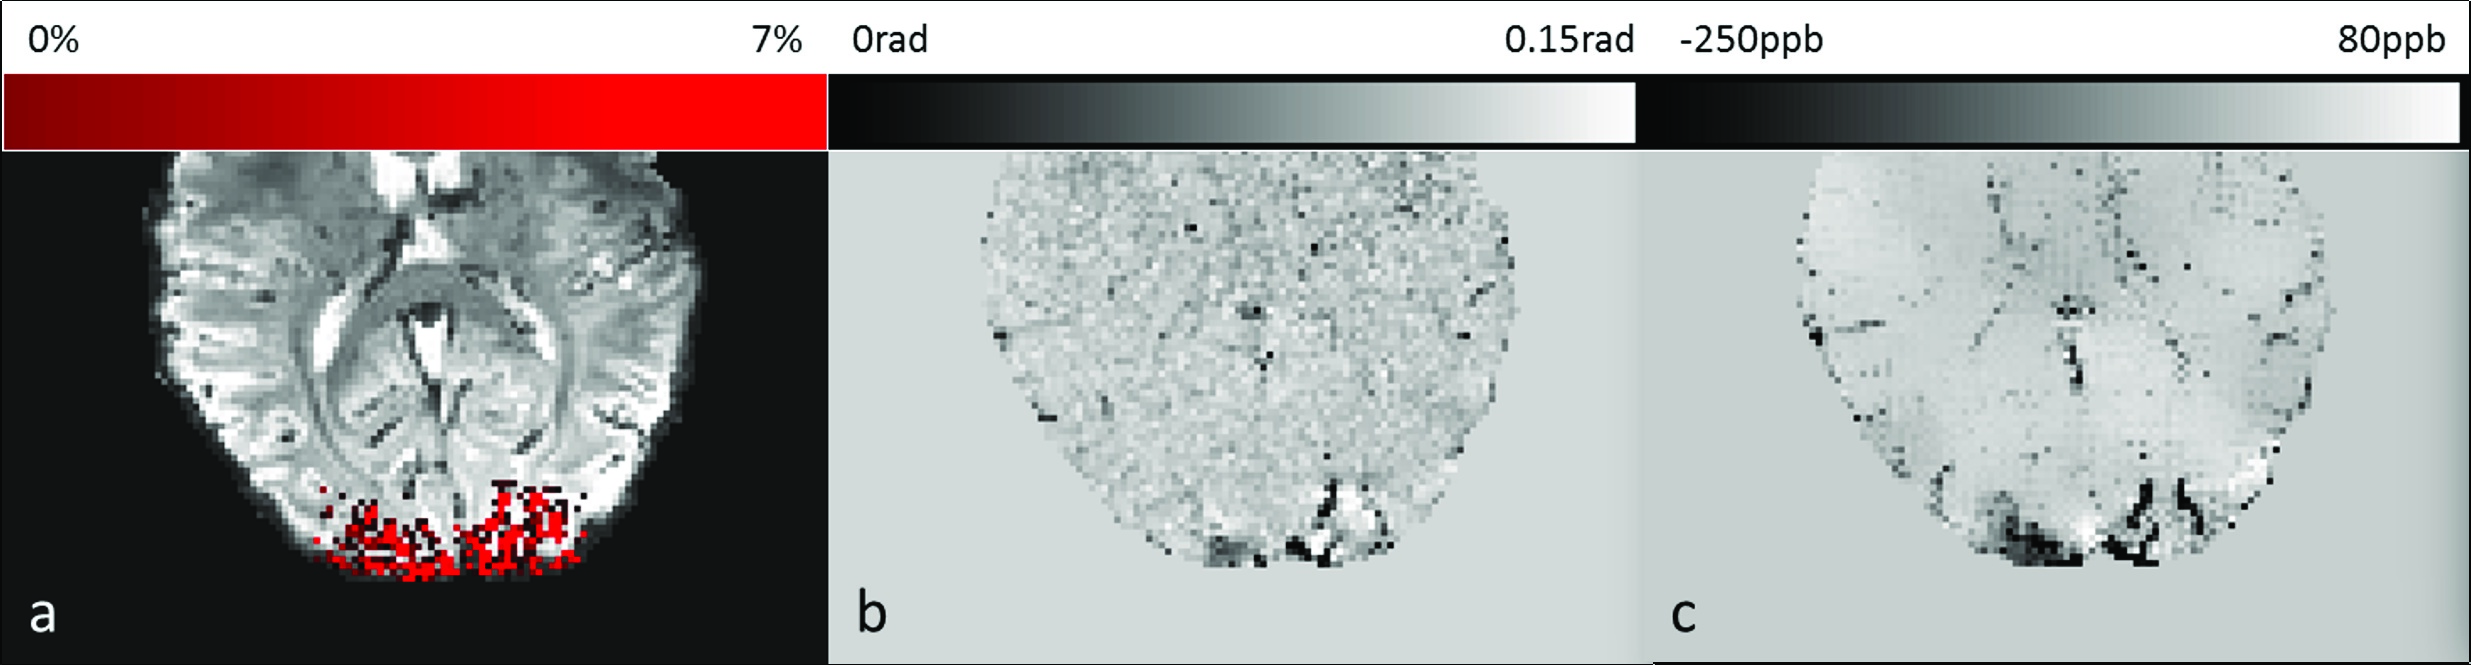
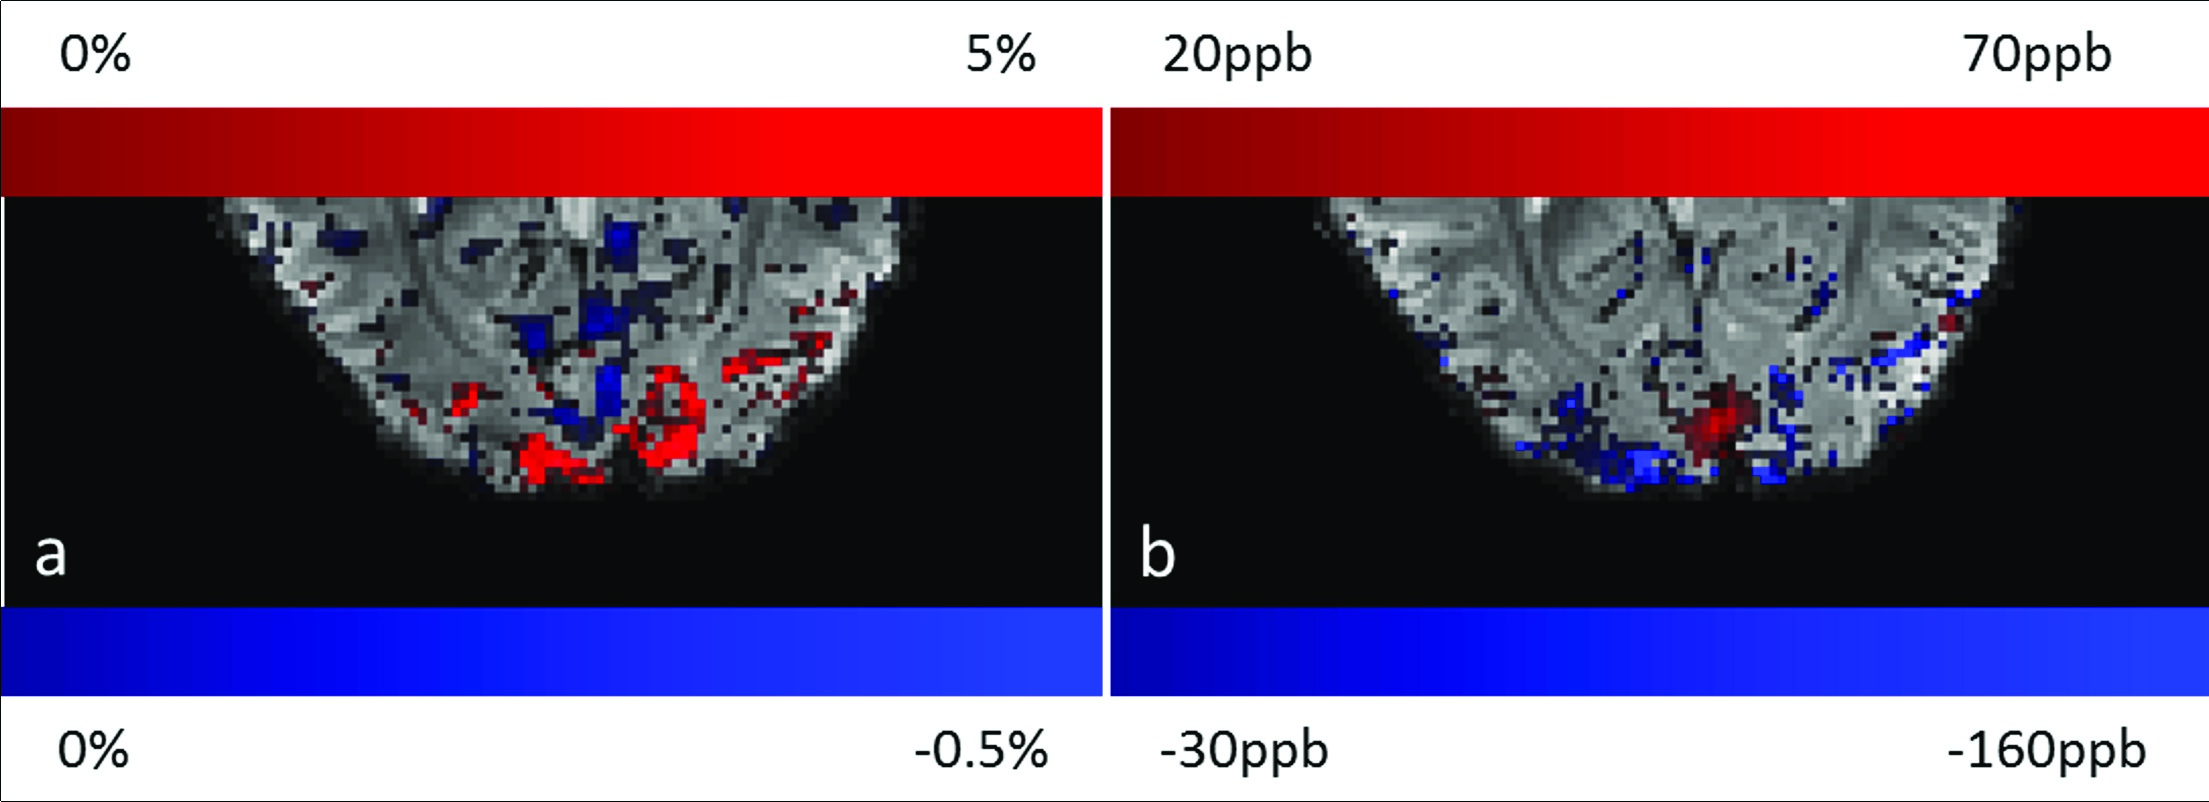
Figure 1 shows the results of the RF phase correction step that was used to remove the additional multiband phase term (Fig.1). Fig.2 shows the draining veins on QSM data (Fig.2c) appearing in the same area as the activation on the percentage magnitude signal change (%-change) image (Fig.2a). The inter-subject mean±variability of the Δχv and ΔYv over the scanned subjects in the resting/active state was measured to be 0.15±0.04ppm and 12.5±3%, respectively. The visual cortex activation, shown in Fig.3, demonstrates the agreement between the %-change map and the QSM reconstruction. The signal from the veins was removed to focus on QSM of the tissues, displayed in Fig.3b, by generating a venous mask from the averaged QSM of ‘resting’ time points. The positive blood-oxygen-level-dependent (BOLD) effect of about 7% in visual cortex correlates with the susceptibility decrease of ~100ppb in the visual cortex. On the other hand, the negative BOLD effect detected on the %-change maps correlates with increased susceptibility areas. This quantified region was reduced by -0.5% on magnitude, which corresponds to an increase of susceptibility by 50ppb.DISCUSSIONS and CONCLUSION
Phase imaging and QSM are more capable of revealing and quantifying the underlying veins than magnitude fMRI, consistent with a similar study with functional QSM [8]. We have chosen to generate a single QSM data by utilizing the final phase difference map (active - rest) to reduce any artifacts that may be introduced by dipole inversion process. The reduction in Δχv value (≈0.15ppm) is in agreement with the notion of the blood flow effect dominating the increase in Dc due to oxygen consumption, resulting in overall decrease in the effective Δχv. From the 13% Yv increase, we can expect an increase in cerebral blood flow (CBF) by 65-71% using Fick’s principle, ΔYv/(1-Yv)≈ΔCBF/CBFactive9. This is consistent with the reported 60-100% CBF change during a visual task10. In addition, the region with an increased %-change was identical to the region with decreased Δχ, as expected under hyperperfusion conditions. Similarly, the negative %-change coincides with increased Δχ on QSM data, which may be caused by either neuronal inhibition or the vascular steal effect11. QSM sheds light on calibrating the % BOLD change and, when combined with CBF, may help in determining the basis of negative BOLD signal, in particular if it is due to increased oxygenation during rest periods or reduced oxygenation during the visual stimulation.Acknowledgements
The authors acknowledge Kathryn Manning and Hacene Serrai for reviewing the abstract as well as Trevor Szekeres for collecting the MRI data. This work was supported by the Canadian Institutes of Health Research Foundation grant (grant # 353372) and a Brain Canada Platform Support Grant.References
[1] Balla DZ, Sanchez-Panchuelo RM, Wharton SJ, Hagberg GE, Scheffler K, Francis ST, Bowtell R. Functional quantitative susceptibility mapping (fQSM). Neuroimage. 2014 Oct 15;100:112-24.
[2] Moeller S, Yacoub E, Olman CA, Auerbach E, Strupp J, Harel N, Uğurbil K. Multiband multislice GE-EPI at 7 tesla, with 16-fold acceleration using partial parallel imaging with application to high spatial and temporal whole-brain fMRI. Magn Reson Med. 2010;63(5):1144-1153.
[3] Stanley O, Menon RS, Klassen LM. Absolute B1- estimation without a homogeneous receive coil. Proceedings of the 25th Annual Meeting of ISMRM; Honolulu, HI, USA. 2017. p. 5177.
[4] Wong E. Optimized Phase Schedules for Minimizing Peak RF Power in Simultaneous Multi-Slice RF Excitation Pulses. Proceedings of the 20th Annual Meeting of ISMRM; Melbourne, Australia. 2012. p. 2209.
[5] Abdul-Rahman HS, Gdeisat MA, Burton DR, Lalor MJ, Lilley F, Moore CJ. Fast and robust three-dimensional best path phase unwrapping algorithm. Appl Opt. 2007 Sep 10;46(26):6623-35.
[6] Jenkinson M, Beckmann CF, Behrens TE, Woolrich MW, Smith SM. FSL. Neuroimage. 2012 Aug 15;62(2):782-90.
[7] Liu J, Liu T, de Rochefort L, Ledoux J, Khalidov I, Chen W, Tsiouris AJ, Wisnieff C, Spincemaille P, Prince MR, Wang Y. Morphology enabled dipole inversion for quantitative susceptibility mapping using structural consistency between the magnitude image and the susceptibility map. Neuroimage. 2012 Feb 1;59(3):2560-8.
[8] Özbay PS, Warnock G, Rossi C, Kuhn F, Akin B, Pruessmann KP, Nanz D. Probing neuronal activation by functional quantitative susceptibility mapping under a visual paradigm: A group level comparison with BOLD fMRI and PET. Neuroimage. 2016 Aug 15;137:52-60.
[9] Ogawa S, Menon RS, Kim SG, Ugurbil K. On the characteristics of functional magnetic resonance imaging of the brain. Annu Rev Biophys Biomol Struct. 1998;27:447-74
[10] Duong TQ, Yacoub E, Adriany G, Hu X, Ugurbil K, Vaughan JT, Merkle H, Kim SG. High-resolution, spin-echo BOLD, and CBF fMRI at 4 and 7 T. Magn Reson Med. 2002 Oct;48(4):589-93.
[11] Harel N, Lee SP, Nagaoka T, Kim DS, Kim SG. Origin of negative blood oxygenation level-dependent fMRI signals. J Cereb Blood Flow Metab. 2002 Aug;22(8):908-17.
Figures