2377
Hypercapnic manipulation of baseline blood volume alters coupling between BOLD and CBV visual responses1School of Physics and Astronomy, Cardiff University Brain Research Imaging Centre (CUBRIC), Cardiff University, Cardiff, United Kingdom, 2SFIM, NIMH, Bethesda, MD, United States, 3Max-Planck-Institut für Kognitions- und Neurowissenschaften, Leipzig, Germany
Synopsis
The utility of VASO to study disease-related alterations in CBV is demonstrated. Manipulation of baseline CBV with hypercapnia mimicking arteriolar disease states produces a change in dynamic coupling of BOLD and CBV visual evoked responses. Although no significant changes in signal amplitude were detected, the expected trend for amplitude reduction was observed in the VASO signals with increasing CO2 levels. The time-to-peak of BOLD responses lengthens but CBV peak times, being longer at baseline, remain the same. This study indicates that combining VASO and BOLD contrasts can be sensitive enough to investigate the consequences of patho-physiological changes in baseline CBV.
INTRODUCTION
Cerebral autoregulation, i.e. the homeostatic
process in which arterioles change resistance to maintain constant blood supply
to brain tissue remains poorly understood, especially in a diseased state. In
this study, we demonstrate that this process can be monitored indirectly by measuring
changes in cerebral blood volume (CBV). Here, we combine measures of CBV response to
neural stimuli with manipulations of the arterial tension of carbon dioxide to
model disease states.
Using this approach, we have previously shown that changes in cerebral
blood flow are independent of baseline perfusion [1]. In this study, we sought to investigate whether a similar relationship
applies to ΔCBV measured with Slice-Saturation Slab-Inversion Vascular Space Occupancy (SS-SI-VASO) [2]. Given that the VASO CBV-weighting is sensitive to partial volumes of
CSF [3] we select a mask of voxels in an independent scan displaying the expected changes in CBV. We perturbed
baseline CBV with hypercapnia and quantified changes in the visual responses
for BOLD and VASO contrasts.METHODS
Data were acquired with the SS-SI-VASO sequence [2] in 10 healthy subjects on a Siemens 7T scanner equipped with a 32 channel NOVA head-coil. Sequence parameters: TI 1000ms, SMS 4, GRAPPA 2, 20 slices, 1.5 mm isotropic voxels. A grayscale radial checkerboard flickering at 8Hz (100% contrast) was presented to subjects in blocks lasting 20s. Subjects wore a mask and end-tidal CO2 levels were manipulated by manually adjusting inspired CO2 concentrations above baseline: 0 mmHg (no CO2 delivery), +4 and +8 mmHg (each block 220s). T1 quantitative maps were obtained as previously described [4]. Each participant was scanned in a visual localizer run (no CO2) and three further runs where the order of each block +0, +4, +8 mmHg was randomized. Motion correction censoring was set to 0.5 mm (AFNI Euclidian Norm of motion parameters). Scans in which more than 30% of the TRs were censored were excluded from the analysis. Fits for visual and hypercapnia responses for each condition were obtained with boxcar models. Statistical differences were analyzed with paired t-tests unless otherwise stated.RESULTS
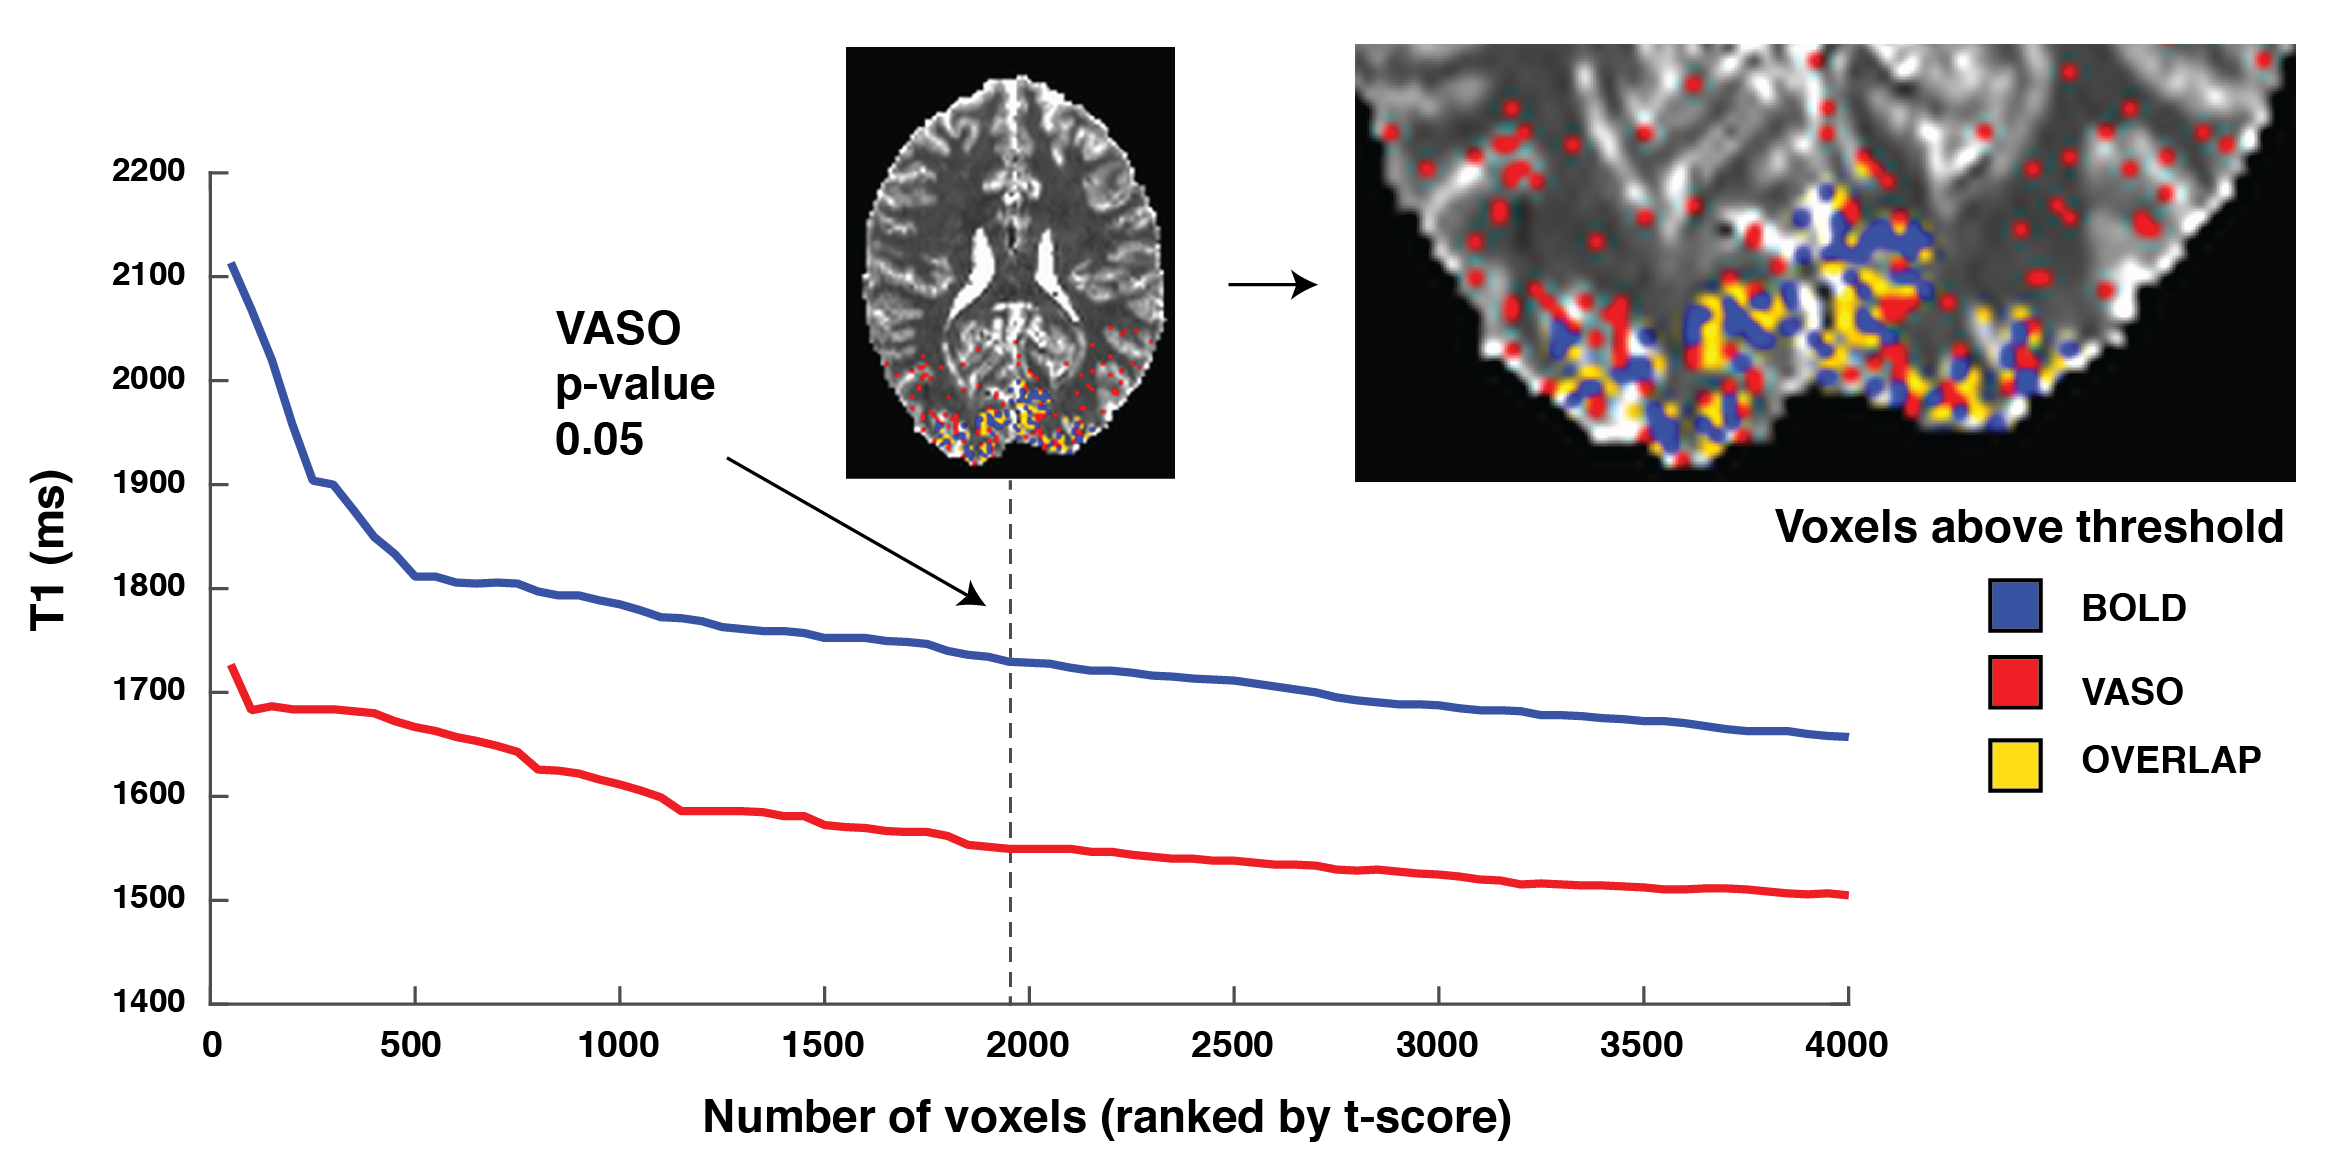
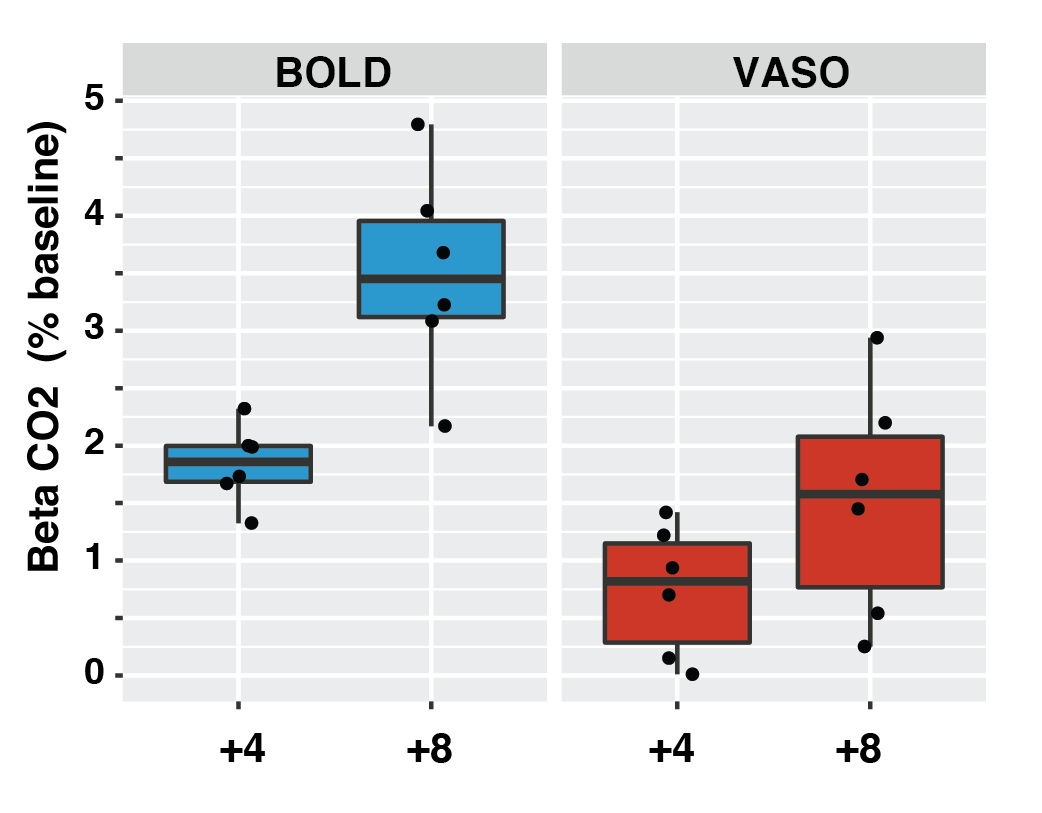
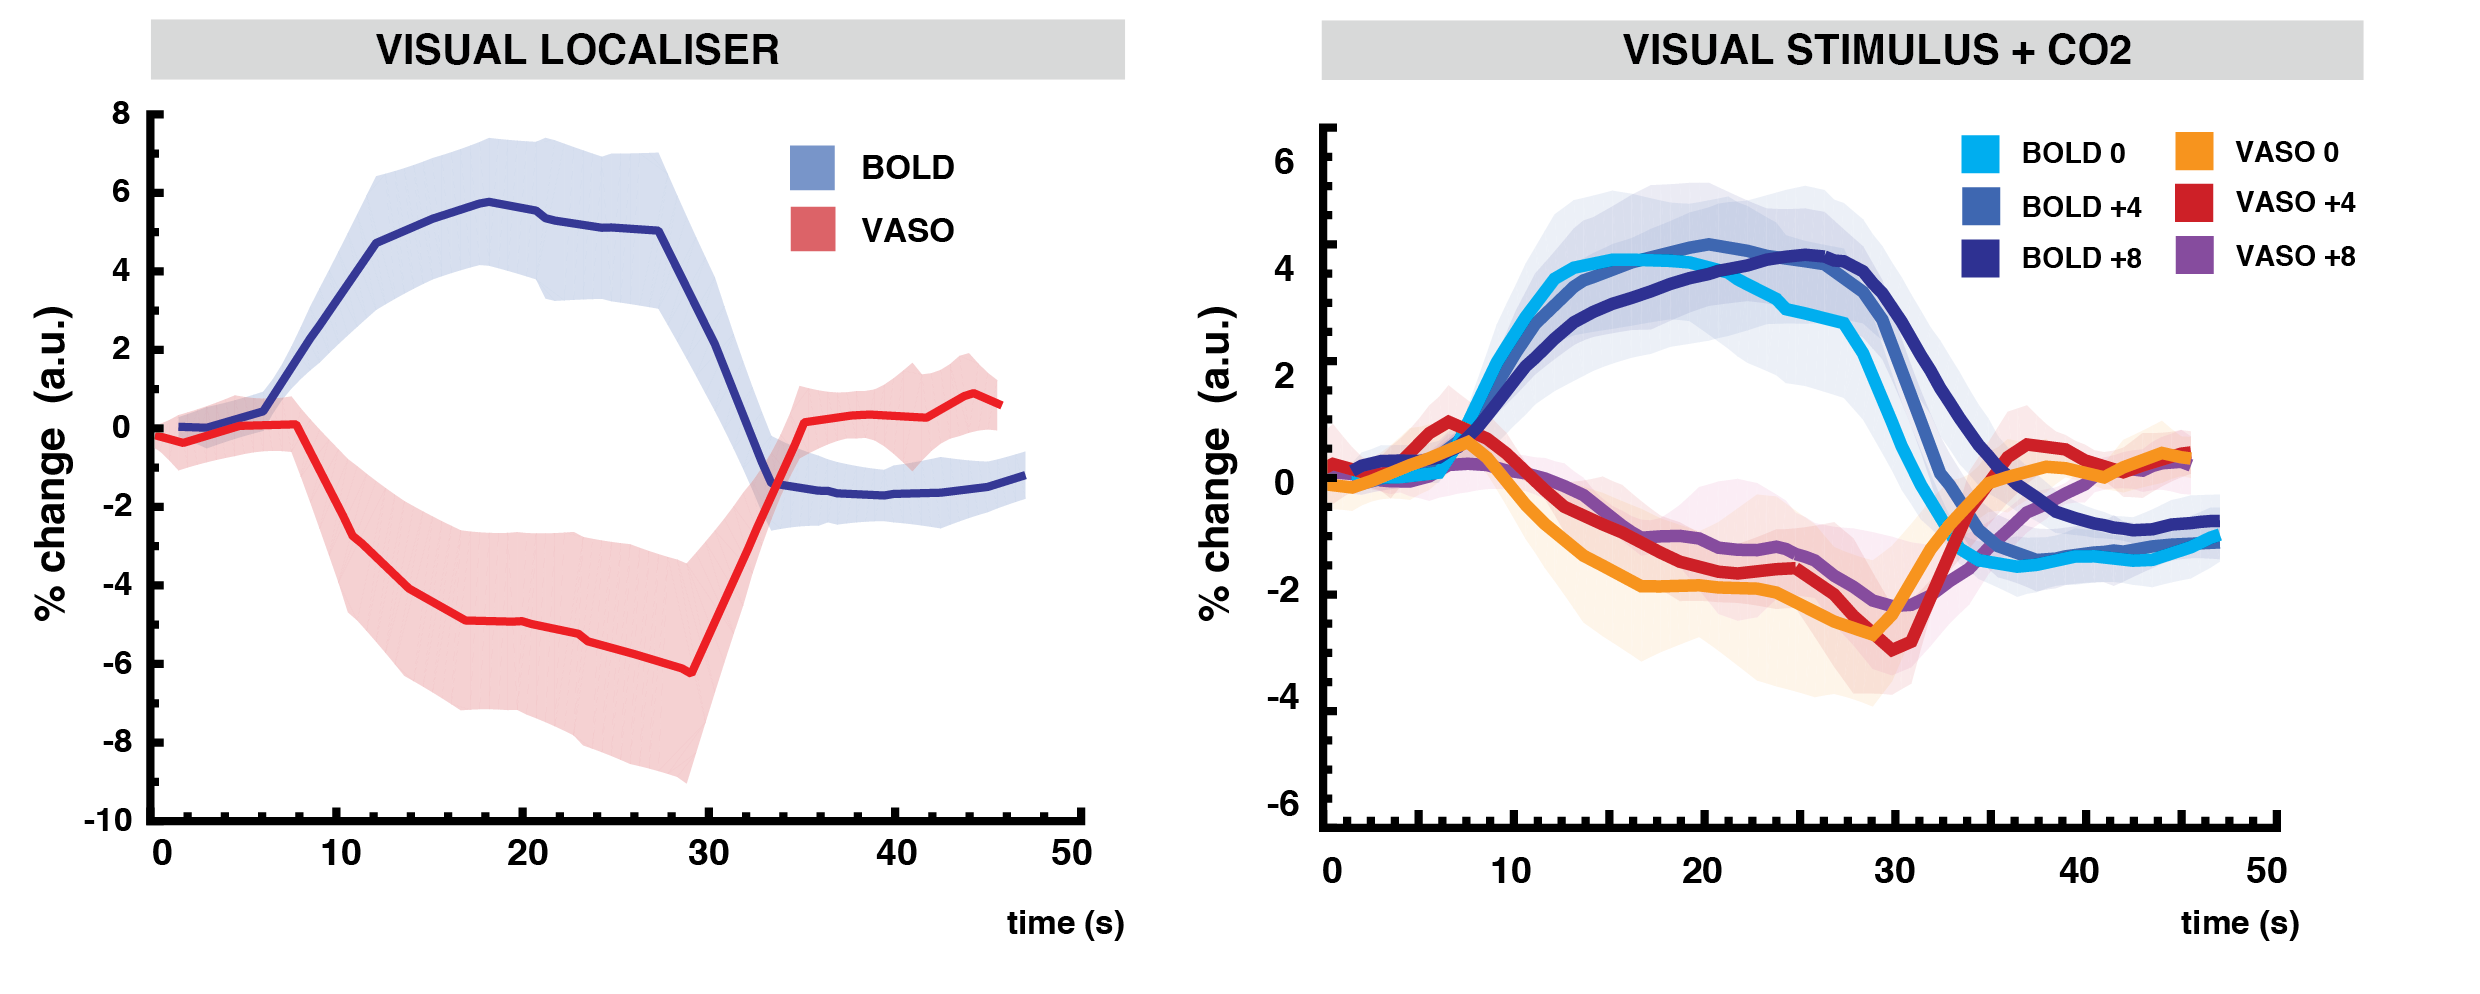
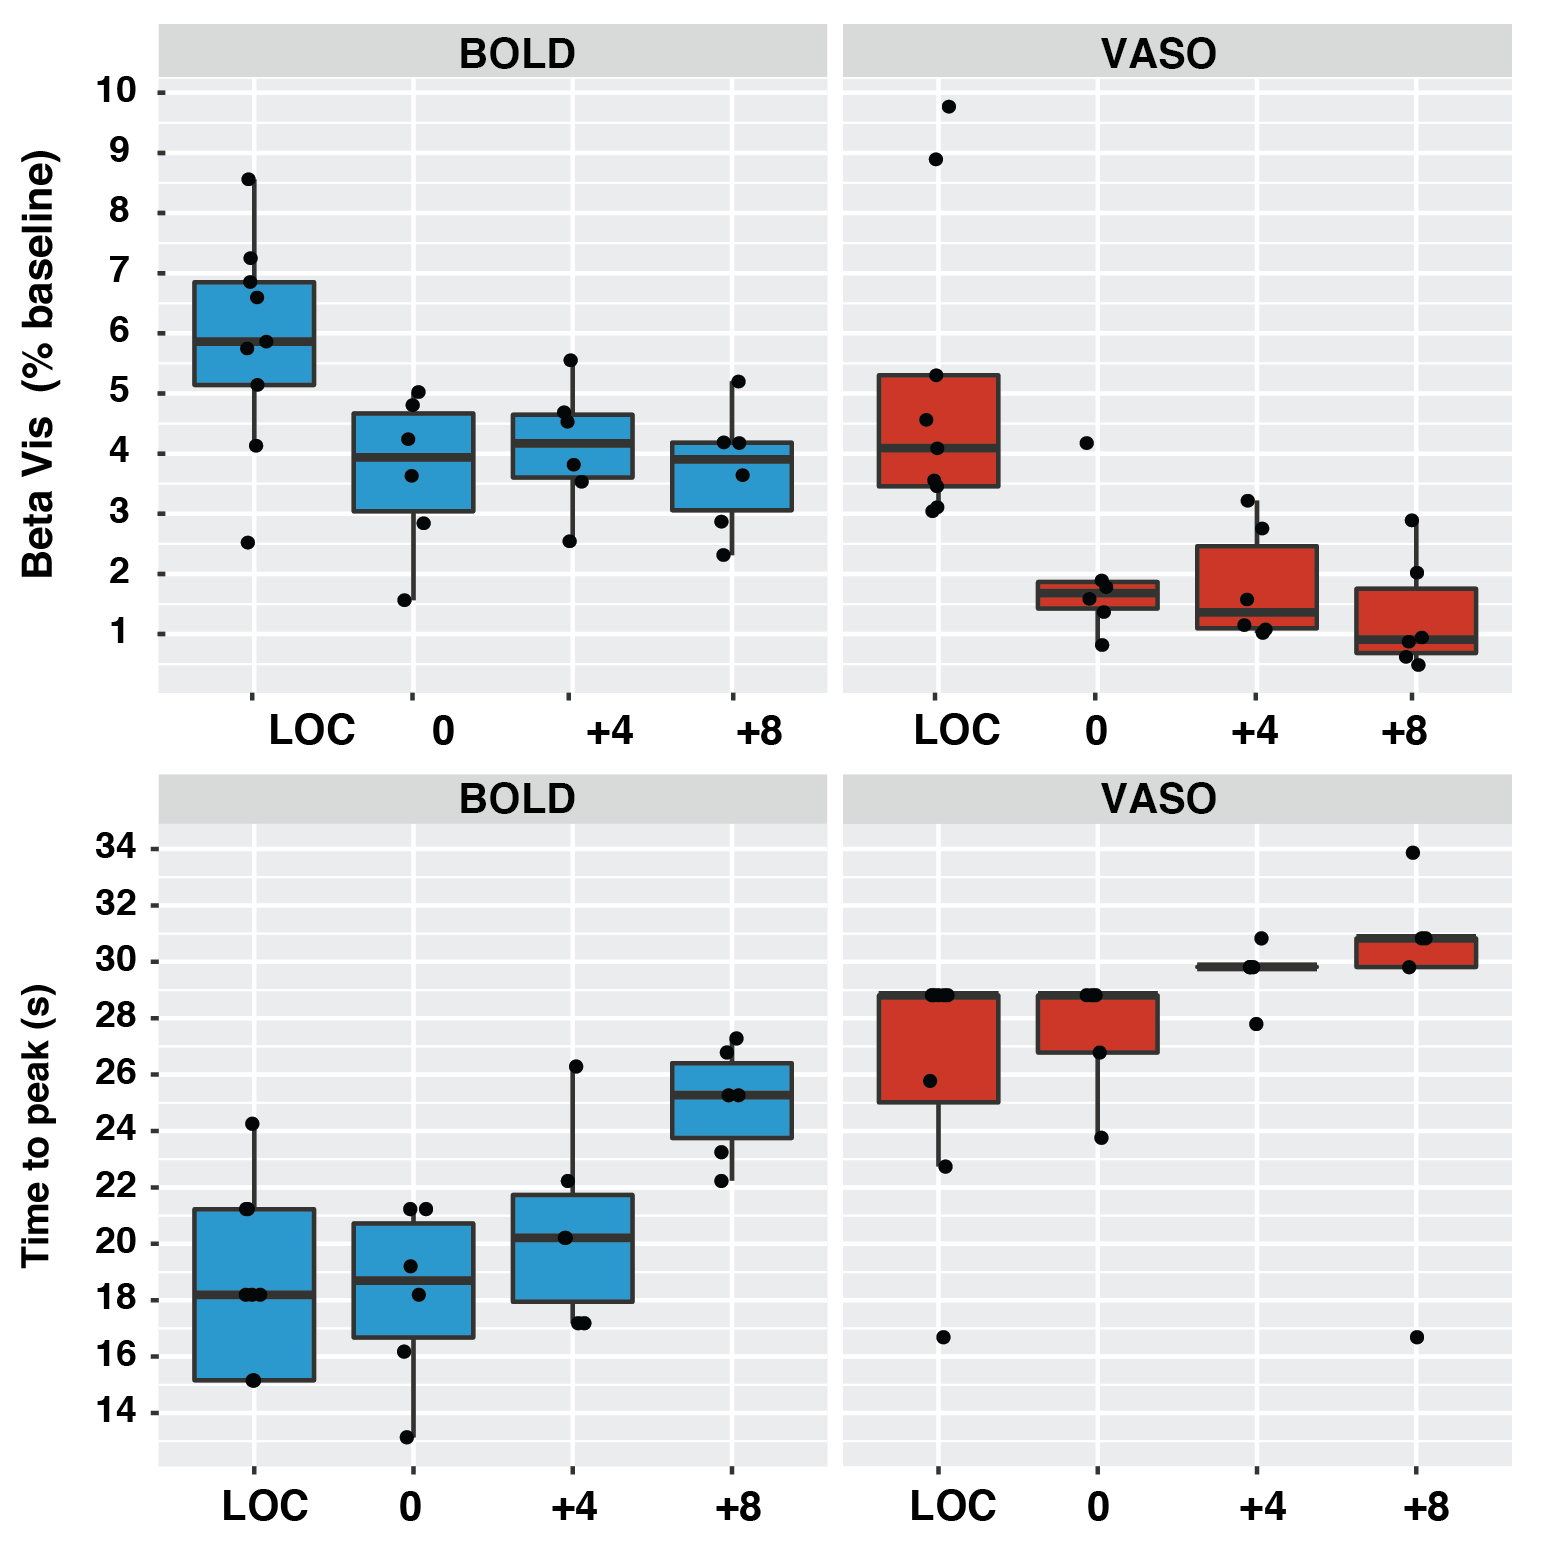
A single subject example of the VASO CBV-weighted masking derived from the visual localizer run is shown in Fig.1. Voxels with the highest t-score in BOLD and VASO only partially overlap and display a different median T1. Targeting +4 and +8 mmHg increased the baseline BOLD (0 vs +4: mean difference 1.83 %, p-value<0.01; +4 vs +8: mean difference 1.65%, p-value = 0.021) and CBV (0 vs +4: mean difference 0.74 %, p-value=0.024; +4 vs +8: mean difference 0.77%, p-value = 0.027) signals in a dose dependent fashion when averaged over the VASO visual mask (Fig.2). The amplitude of both BOLD and VASO visual responses were not significantly modulated by CO2. (Fig 3 and 4). However, at the CO2 baseline level, time to peak (TTP) for BOLD visual responses was shorter than for CBV-weighted responses (mean BOLD = 20.3 s, mean VASO = 27.6 s, p-value<0.001) (Fig.4). In BOLD, the TTP increased with increasing CO2 end-tidal (BOLD +4 TTP vs BOLD +8 TTP, mean difference 4.4 s p=0.015), while no TTP change was detected for the VASO contrast.DISCUSSION
Masks of visual responsive voxels that show a significant increase in CBV are limited to voxels with lower T1 values compared to significant BOLD voxels, suggesting that the voxels are less confounded by CSF partial voluming which is detrimental to the VASO contrast. As expected the CO2 manipulation produced an increase in CBV and BOLD signals. Although not significant, a trend was apparent in the VASO contrast for a reduction in visual response amplitude that was absent in the BOLD. This suggests that CBV-weighted measure may be more suited to detect subtle changes in visual evoked responses caused by disease-related changes in baseline CBV. Moreover, the dynamic of BOLD and CBV responses were not identical. A similar TTP for the visual localizer and the 0mmHg condition for both the BOLD and CBV responses indicates that the dynamic shape of the response is maintained across runs. As previously shown [5] the time to peak in BOLD lengthens at increasing levels of arterial CO2, whereas since the VASO response increases monotonically until the end of the stimulus, its TTP stays constant. The results suggest that the hypercapnic manipulation alters the coupling between BOLD and CBV in a dose dependent fashion and demonstrates the utility of this VASO method in detecting such alterations in a diseased brain.Acknowledgements
Funded by support from the Wellcome Trust [WT200804]. We thank Benedikt Poser and Dimo Ivanov for their contributions to the VASO-sequence and Maria Guidi for help with sequence setup.References
[1] Whittaker JR, Driver ID, Bright MG, Murphy K (2016) The absolute CBF response to activation is preserved during elevated perfusion: Implications for neurovascular coupling measures. Neuroimage 125, 198–207.
[2] Huber L, Ivanov D, Krieger SN, Streicher MN, Mildner T, Poser BA, Möller HE, Turner R (2014) Slab-selective, BOLD-corrected VASO at 7 tesla provides measures of cerebral blood volume reactivity with high signal-to-noise ratio. Magn. Reson. Med. 72, 137–148.
[3] Donahue MJ, Lu H, Jones CK, Edden RAE, Pekar JJ, Van Zijl PCM (2006) Theoretical and experimental investigation of the VASO contrast mechanism. Magn. Reson. Med. 56, 1261–1273.
[4] Huber L, Marrett S, Handwerker DA, Thomas A, Gutierrez B, Ivanov D, Poser BA, Bendettini PA (2016) Fast dynamic measurement of functional T1 and grey matter thickness changes during brain activation at 7T. Proc. Int. Soc. Magn. Reson. Med. 633.
[5] Cohen ER, Ugurbil K, Kim S-G (2002) Effect of basal conditions on the magnitude and dynamics of the blood oxygenation level-dependent fMRI response. J. Cereb. Blood Flow & Metab. 22, 1042–1053.
Figures