2368
Piriform cortex involvement in odor imagery1IADI, U947, Université de Lorraine, INSERM, Nancy, France, 2Myrissi, Nancy, France, 3InnoCIM, ENSAIA, Université de Lorraine, Nancy, France, 4CIC1433, CHRU Nancy, INSERM, Université de Lorraine, Nancy, France
Synopsis
Current research relies on the piriform cortex as an indicator of successful odor imagery. Using colored arrangements as visual stimulation, we seek to show that the piriform cortex is mainly linked to odor perception. Our results support this hypothesis by showing a clear lack of activation in this area during odor imagery. Furthermore this study definitively highlights the use of colored arrangements in an odor imagery study compared to other visual stimulation and its benefits.
Purpose
Current research findings show that odor imagery relies mainly on the piriform cortex (PC). However, the PC belongs to the secondary olfactory structures which are mainly linked to odor perception. We therefore argue that this structure should not be solicited when odor imagery is occurring. In order to explore the involvement of the secondary and tertiary olfactory structures (hippocampus, amygdala, orbitofrontal cortex and insular cortex), an fMRI study was conducted using an original visual stimulation: colored arrangements1. To this end, we compared both colored and black and white arrangements.Methods
23 healthy right handed women ranging from 18 to 25 years old and with no color vision deficiency were recruited for this study. Handedness was assessed using the Edinburgh Handedness Inventory (EHI) and color vision deficiency was tested using Ishihara’s test. All subjects gave their written informed consent, dated and signed as required by the institutional review board.
Our experimental paradigm was constituted of two sessions (see figure 1). Both used the same block design paradigm and were composed of seven 60 seconds cycles. Each cycle was built with a 25 seconds control period that showed a uniform gray background and 35 seconds of visual stimulation. These visual stimuli consisted in 7 arrangements that were shown to the subjects in a random order. Subjects were instructed to focus on the odor suggested by the arrangements.
The paradigm was programmed using E-Prime 2.0 (Psychology software tools) software and projected onto a screen.
Functional and anatomical images were acquired using a 3T scanner (Siemens, Prisma) and a 64 channel head coil. All images were later processed and analyzed using SPM12 (SPM12, Wellcome Department of Cognitive Neurology, London,UK) software. Finally, whole brain analyses were carried out using one-t test for each session.
Results
Compared to the control period, colored arrangements presentation showed a significant bilateral activation in the insular cortex, hippocampus, cerebellum, occipital lobe (fusiform gyrus, lingual gyrus, and inferior occipital gyrus), parietal inferior lobe, parietal superior lobe, cingulate cortex and supplementary motor area. Furthermore, we found lateralized significant activation in the left orbitofrontal cortex, left putamen, left precentral gyrus and left frontal operculum. The main results are illustrated in figure 2.
Black and white colored arrangements, showed a significant bilateral activation in the occipital lobe (fusiform gyrus, lingual gyrus and inferior occipital gyrus), cerebellum, parietal inferior lobe, parietal superior lobe and supplementary motor area. Lateralized significant activations were also found in left frontal operculum, left frontal lobe, left cingulate cortex, left precentral gyrus, left caudate nucleus and left anterior insular cortex. The main results are illustrated in figure 3.
Discussion
As expected, our results showed the recruitment of tertiary olfactory structures during the colored arrangements presentation: hippocampus, insular cortex and orbitofrontal cortex. These areas have already been widely reported in many odor imagery2,3 and olfactory perception studies4. Moreover, during odor imagery and olfactory perception, overlap of activation in these areas is well known.
Similarly, we did not observe any activation in the PC. Royet et al.5 argued that the PC is not a good indicator of whether there is odor imagery occurring or not. Indeed, the PC can be activated by simply reading odor labels6. Therefore, linguistic cues might not be the best suited for an odor imagery study.
Considering that we did not use any linguistic cues and we have not reported any activation in the PC, we can assume that the PC is indeed not a reliable indicator.
A previous study7 compared colored arrangements to figurative representations of odorous sources and found no activations in the tertiary structures of olfaction for the latter. Their results highlighted the need to rely on an abstract spatial structure to suggest an odor. In our case when shown black and white arrangements, subjects were not able to successfully imagine odors as highlighted by the lack of activation in most of the tertiary olfactory structures.
Conclusion
Our findings lend support to the hypothesis that the piriform cortex is mainly linked to odor perception and not odor imagery. Nonetheless, if a link exists it might only be a purely linguistic one since presentation of colored arrangements did not solicit the PC unlike odors labels.
Furthermore, this study definitively highlights that colored arrangements capability to suggest an odor seems to rely on a complex association between colors and a unique abstract spatial structure.
Finally, colored arrangements reliably activated the tertiary olfactory cortex, thereby making them a good alternative to odors labels for odor imagery studies.
Acknowledgements
This research was supported by the financial help of the FEDER program and the “Région Lorraine”.References
1. Jacquot, M, Noel, F, Velasco, C, Spence, C. On the Colours of Odours. Chem. Percept. 9: 79 (2016)
2.
Bensafi, M, Sobel, N, Khan, RM. Hedonic-specific activity in piriform cortex during odor imagery mimics that during odor perception. J. Neurophysiol., 98, 6:3254-62. (2007)
3. Plailly, J, Delon-Martin, C, Royet, JP. Experience induces functional reorganization in brain regions involved in odor imagery in perfumers. Hum Brain Mapp, 33, 1:224-34. (2012)
4. Gottfried, JA, Deichmann, R, Winston, JS, Dolan, RJ. Functional heterogeneity in human olfactory cortex: an event-related functional magnetic resonance imaging study. J. Neurosci., 22, 24:10819-28. (2002)
5. Royet, JP, Delon-Martin, C, Plailly, J. Odor mental imagery in non-experts in odors: a paradox?. Front Hum Neurosci, 7:87. (2013)
6.
González,
J, Barros-Loscertales, A, Pulvermüller, F, Meseguer, V, Sanjuán, A, Belloch, V,
Avila, C. Reading cinnamon activates olfactory brain regions.
Neuroimage, 32, 2:906-12. (2006)
7. Charroud,
C, Jacquot, M, Tonnelet, R, Boyer, J, Nehmé, L,
Noël, F, Felblinger, J, Braun, M,
Hossu, G.Olfactory suggestion
capacity of colors: a functional MRI study. ISMRM abstract ,1242.
(2017)
Figures
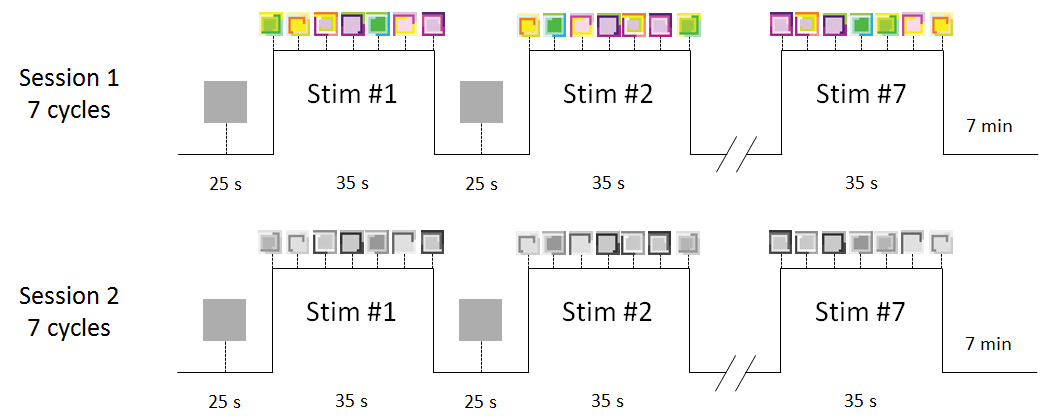
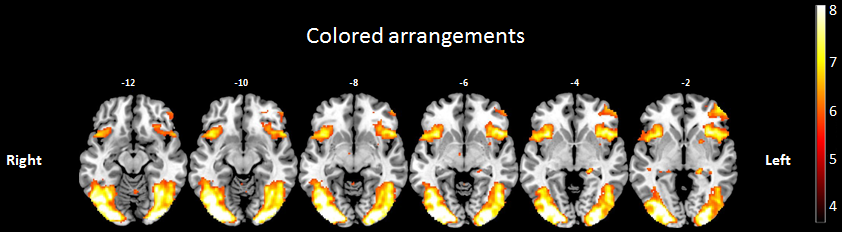
Figure 2: Brain areas significatively activated by colored arrangements presentation.
Significant activations were displayed on axial sclices using MRIcron software. One T test was used with an uncorrected p-value p < 0.001 and a minimum cluster size of 10 voxels.
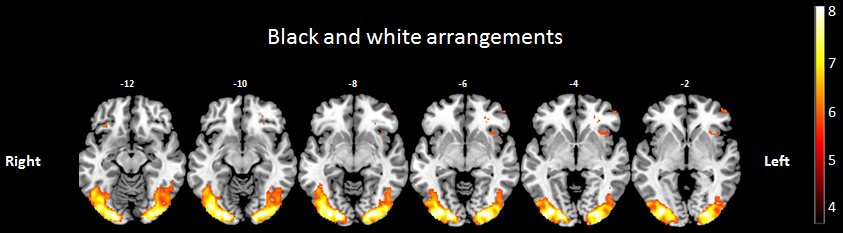
Figure 3: Brain areas significatively activated by black and white arrangements presentation.
Significant activations were displayed on axial sclices using MRIcron software. One T test was used with an uncorrected p-value p < 0.001 and a minimum cluster size of 10 voxels.