2364
Linear systems analysis of laminar sub-millimetre GE-EPI fMRI1Spinoza Centre for Neuroimaging, Amsterdam, Netherlands, 2Experimental Psychology, Utrecht University, Utrecht, Netherlands, 3Radiology, University Medical Centre Utrecht, Utrecht, Netherlands, 4Applied and Experimental Psychology, VU University, Amsterdam, Netherlands
Synopsis
Nearly all fMRI analysis methods assume a linear relationship between local neuronal activity and the BOLD signal. This assumption is supported for fMRI at conventional resolutions (>1 mm isotropic). We assess whether linearity of the BOLD signal holds at sub-millimetre resolution, over cortical depth. We acquired functional GE 3D-EPI data at 0.7 mm isotropic resolution (TR/TE = 57/28 ms). Stimuli consisted of moving circular sine gratings at 80%, 20%, and 5% contrast. Our results suggest that response profiles for one contrast are linearly scaled response profiles of any other contrast.
Introduction
A fundamental assumption of nearly all fMRI analysis methods is that the relationship between local neuronal activity and the blood oxygenation dependent (BOLD) signal is linear. Experimental evidence supports this notion for fMRI at conventional resolutions (>1mm isotropic). Recent advances in ultra-high field MRI (7T) allowed for high-resolution (sub-millimetre) fMRI1. A novel and promising application of sub-millimetre fMRI is laminar imaging, i.e. measuring BOLD (and other responses) across the thickness of the cortex, in particular to dissociate feed forward and feedback signals as they arrive at different lamina2. However, blood supply over cortical depth is mainly dependent on diving vessels that strongly affect the BOLD response3. This may also affect the BOLD linearity over cortical depth. In this study, we collected 0.7 mm isotropic fMRI data to assess the linearity of the BOLD response over cortical depth.Methods
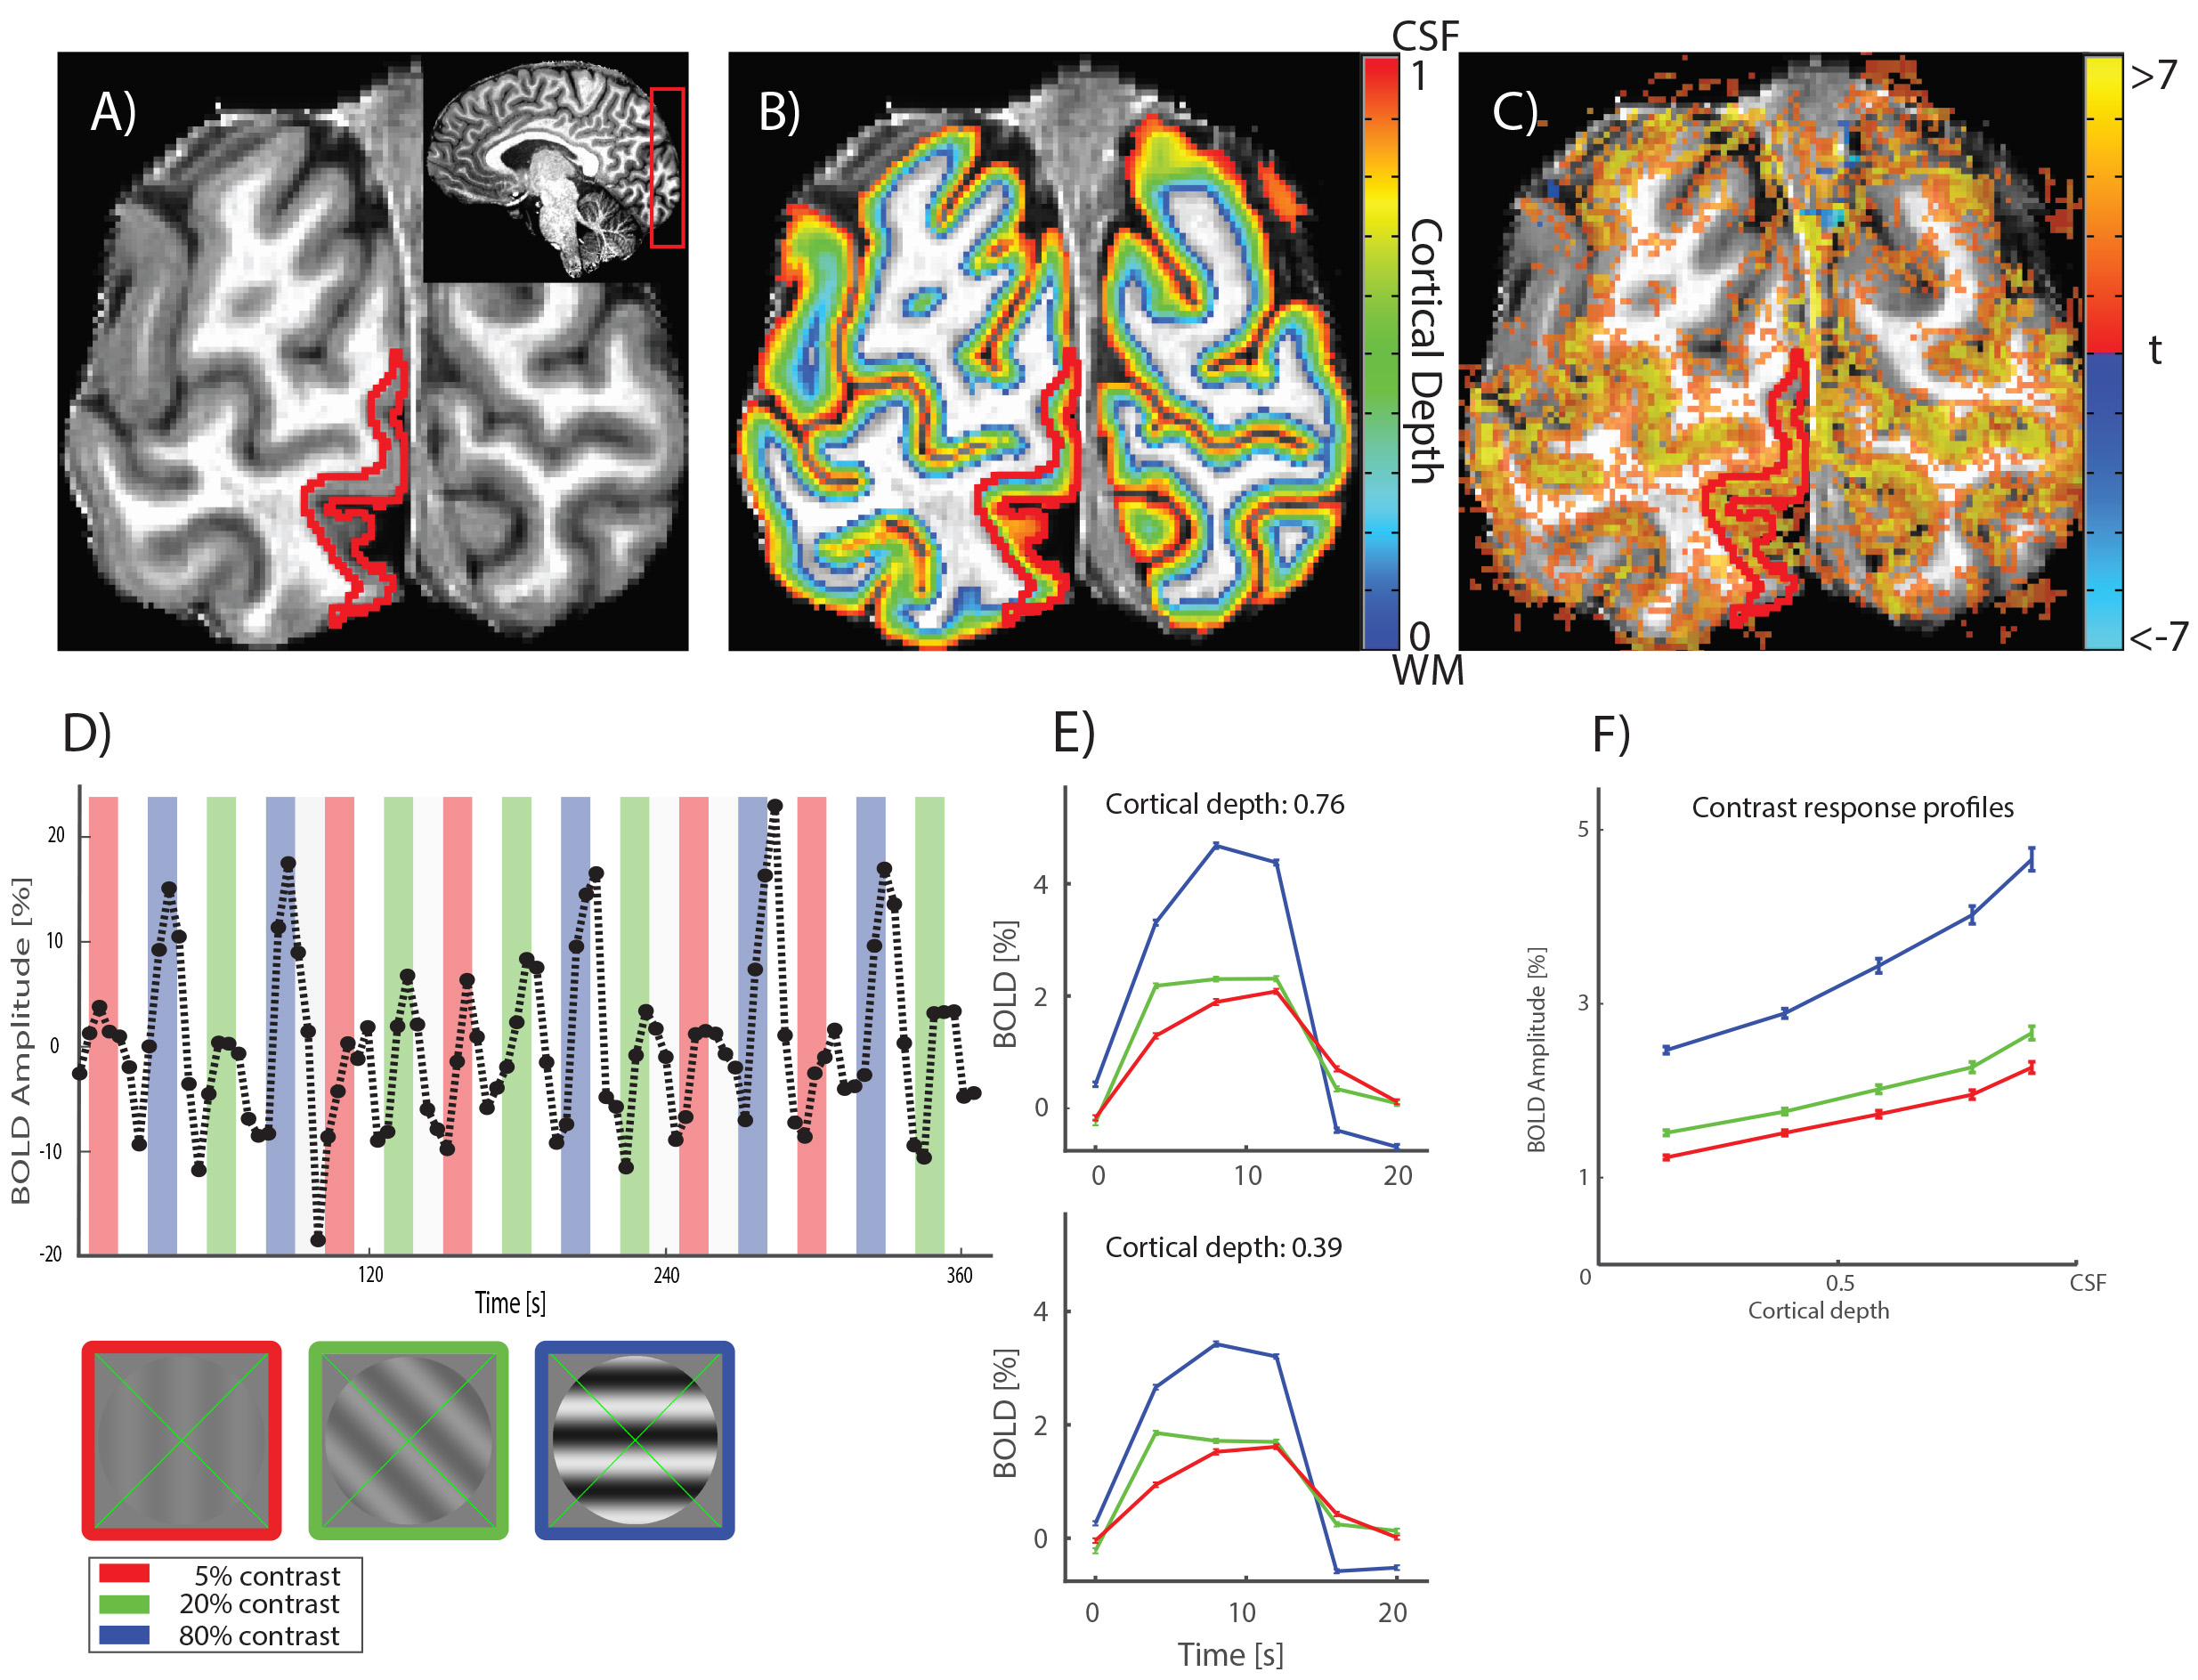
The data were acquired using a gradient echo 3D echo planar imaging sequence (EPI, 2 shots per slice, 34 slices) on a Philips Achieva 7T scanner with custom-built 32-channel surface receive coils. Imaging parameters: TR/TE = 57/28 ms, flip angle: 20°, FOV = 131 x 131 x 24 mm (34 slices). We collected 91 dynamics per run, and 6-7 functional runs per participant, per task condition, acquiring a total of 72 minutes of fMRI data per subject. For each run, we additionally collected 5 volumes with the opposite phase encoding direction to correct for geometrical distortions induced by the B0 field. Participants (5, all male, age range 23-44 years) viewed sine-wave gratings in a circular aperture (4.75 deg radius) for 12 seconds, with 5, 20, or 80% luminance contrast, alternated with 12 seconds rest. Stimuli are shown in Figure 1, left bottom corner. All contrasts were shown for 5 blocks per run. Subjects were asked to either passively view the stimulus while fixating the centre, or perform a one-back task (grating orientation). We computed percentage BOLD amplitude change for each contrast. The statistical maps were distortion-corrected using the top up method4, and co-registered to a high-resolution (0.65 mm isotropic) MP2RAGE5 (TI1 = 900 ms, TI2 = 2750 ms, TR = 5000 ms, TE = 2.45 ms) whole brain anatomy (Figure 1C). Computational cortical layers were defined using a volume-preserving distance estimation between the white matter-grey matter border, and the grey matter-cerebrospinal fluid border, using CBS tools6 (Figure 1B). Early visual cortex regions of interest were defined using separate population receptive field (pRF) mapping7 sessions (Figure 1A, V1).Results & Discussion
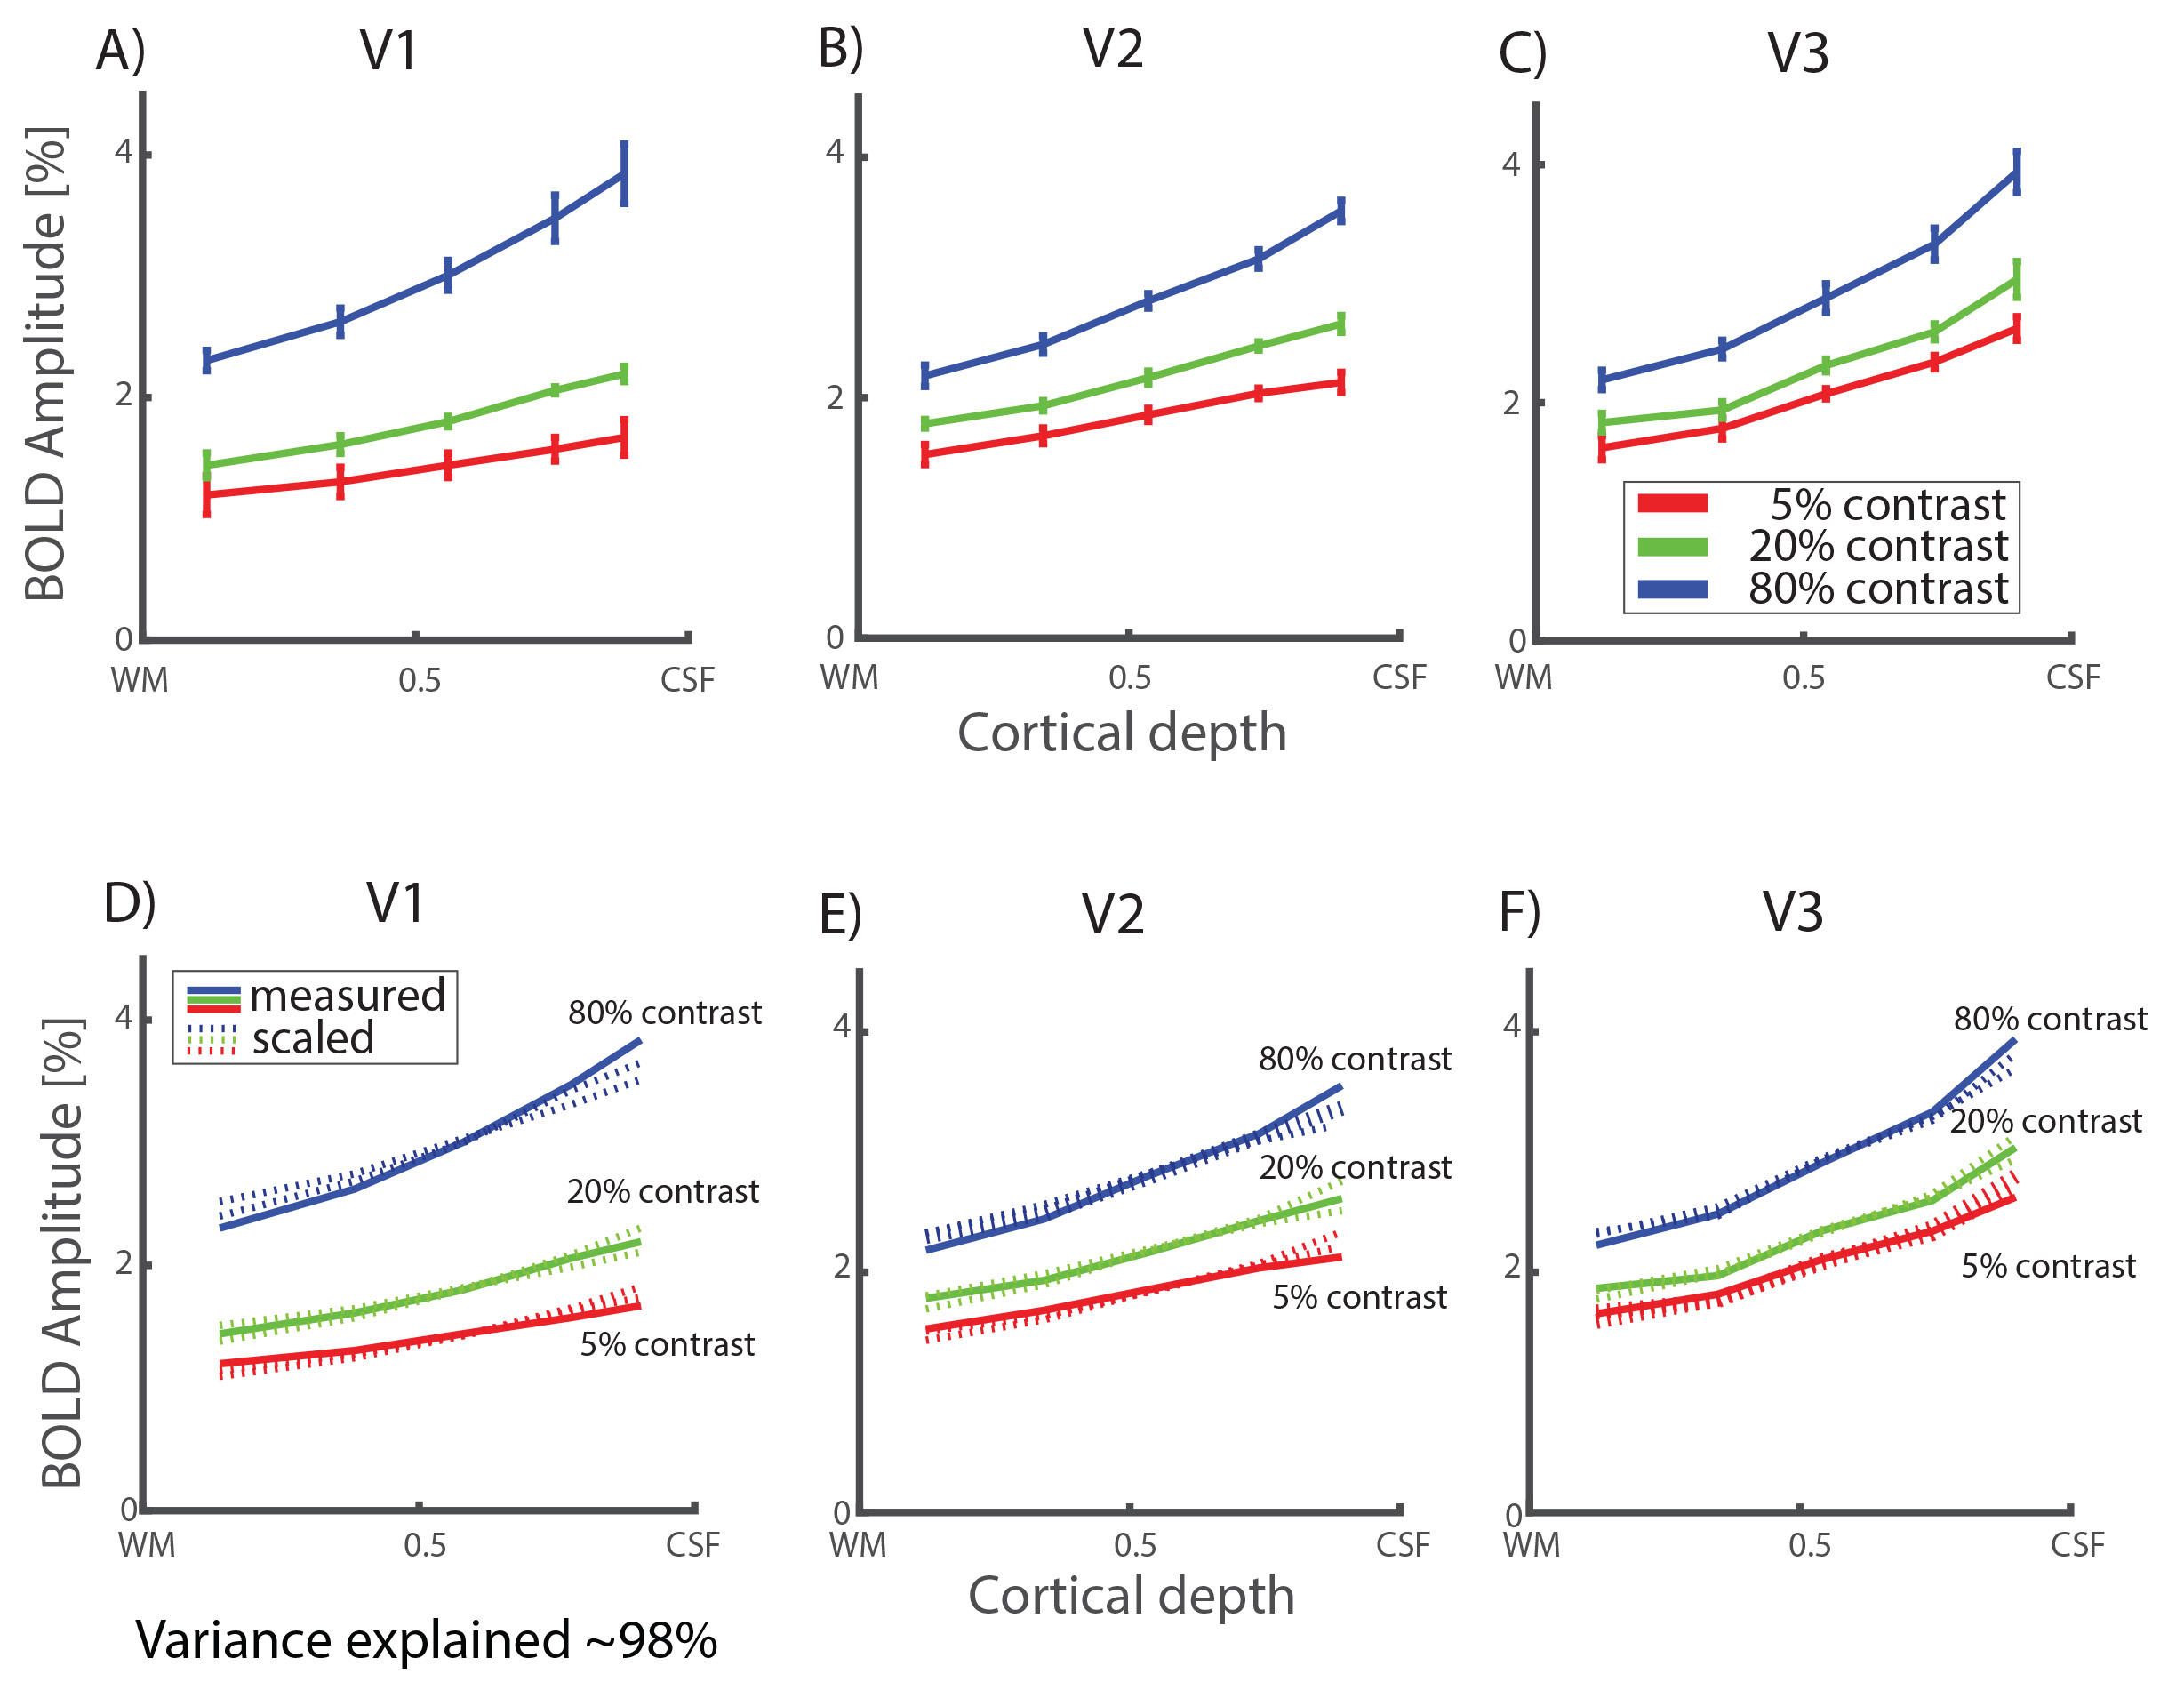
We obtained strong (>1%) BOLD responses throughout early visual cortex for all contrasts and for all subjects (for an example see Figure 1D). Signal amplitudes systematically increased with increasing stimulus contrast (Figure 1E and F). This increase was non-linear, as expected from the known non-linear contrast response function in visual cortex. The BOLD amplitude also increased consistently as a function of cortical depth, where BOLD amplitude systematically increased towards the pial surface (example subject Figure 1F). Average results are shown in Figure 2A-C. Increases in BOLD signal amplitude towards the pial surface were largest in V1 and smaller in V2 and V3, though not significantly different. The BOLD response profile over cortical depth for a specific contrast, could be accurately modelled (variance explained of approximately 98%) by applying a single, linear scaling factor to the response profile of any other contrast, as shown by the dashed lines in Figure 2D-F. This linear dependence strongly suggests a laminar response profile that is independent of the stimulus strength. We found no significant differences between the passive viewing and one-back task conditions. Our results provide evidence for a linear response function across cortical depth, despite known blood supply differences across lamina.Conclusion
Our results suggests that the assumption that BOLD responses are linear holds not only for standard resolution fMRI, but also for sub-millimetre fMRI, and in particular for laminar imaging.Acknowledgements
This project has received funding from the European Union’s Horizon 2020 research and innovation programme under the Marie Sklodowska-Curie grant agreement No 641805.References
1. Dumoulin, S. O., Fracasso, A., van der Zwaag, W., Siero, J. C. W., & Petridou, N. (2017). Ultra-high field MRI: Advancing systems neuroscience towards mesoscopic human brain function. NeuroImage, (September 2016), 0–1. https://doi.org/10.1016/j.neuroimage.2017.01.028
2. Felleman, D. J., & Van Essen, D. C. (1991). Distributed hierachical processing in the primatecerebral cortex. Cerebral Cortex, 1(1), 1–47. https://doi.org/10.1093/cercor/1.1.1
3. Siero, J. C. W., Petridou, N., Hoogduin, H., Luijten, P. R., & Ramsey, N. F. (2011). Cortical depth-dependent temporal dynamics of the BOLD response in the human brain. Journal of Cerebral Blood Flow and Metabolism : Official Journal of the International Society of Cerebral Blood Flow and Metabolism, 31(10), 1999–2008. https://doi.org/10.1038/jcbfm.2011.57
4. Truong, T. K., Chen, B., & Song, A. W. (2008). Integrated SENSE DTI with correction of susceptibility- and eddy current-induced geometric distortions. NeuroImage, 40(1), 53–58. https://doi.org/10.1016/j.neuroimage.2007.12.001
5. Marques, J. P., Kober, T., Krueger, G., Van Der Zwaag, W., Van De Moortele, P.-F., & Gruetter, R. (2009). MP2RAGE, a self bias-field corrected sequence for improved segmentation and T 1 -mapping at high field. NeuroImage, 49, 1271–1281. https://doi.org/10.1016/j.neuroimage.2009.10.002
6. Bazin, P. L., Weiss, M., Dinse, J., Schäfer, A., Trampel, R., & Turner, R. (2014). A computational framework for ultra-high resolution cortical segmentation at 7 Tesla. NeuroImage, 93, 201–209. https://doi.org/10.1016/j.neuroimage.2013.03.077
7. Dumoulin, S. O., & Wandell, B. A. (2008). Population receptive field estimates in human visual cortex. NeuroImage, 39(2), 647–660. https://doi.org/10.1016/j.neuroimage.2007.09.034
Figures