2363
CMRO2 Changes During Sleep in Humans1Radiology, University of Pennsylvania, Philadelphia, PA, United States, 2Neurology, University of Pennsylvania, Philadelphia, PA, United States, 3Division of Sleep Medicine, University of Pennsylvania, Philadelphia, PA, United States
Synopsis
Synaptic transmission is well known to be reduced during sleep, and yet very little is known about the extent to which the various stages of sleep affect neurometabolism. Here, we measured whole-brain CMRO2 in test subjects by means of the OxFlow technique while collecting data continuously for a period of 30 minutes, first during wakefulness and, in a second set of experiments, during sleep and subsequent arousal. During wakefulness CMRO2 was stable (average CV~7%). Following onset of sleep there was a rapid decrease in CMRO2 by up to 25%, along with increased SvO2 but almost unaltered CBF.
Introduction
The literature on the effect of sleep on cerebral metabolism is extremely sparse. During slow-wave-sleep synaptic transmissions are reduced, along with brain glucose utilization1 and cerebral metabolic rate of oxygen (CMRO2)2. Madsen et al2 quantified cerebral blood flow (CBF) and CMRO2, in young healthy subjects using the Kety-Schmidt technique. CBF was measured by infusing 133Xe intravenously, along with arterial and venous blood sampling for extraction of hemoglobin oxygen saturation levels in arterial (SaO2) and venous (SvO2) blood during sleep. The invasiveness of this approach is a deterrent to the study of this important physiologic parameter during states of reduced consciousness. Here, we have attempted to address this question using the OxFlow technique, which quantifies whole-brain SvO2 and CBF simultaneously3,4. Phantom measurements were performed to evaluate the temporal stability of the imaging system and the physiologic variations were assessed during wakefulness and sleep.Methods
Imaging technique: CMRO2 can be quantified via Fick’s principle as CMRO2 = Ca·CBF·(SaO2-SvO2) where Ca is the blood oxygen carrying capacity. The radial OxFlow technique5 enables high temporal resolution SvO2 and CBF measurements in the superior sagittal sinus (SSS), thereby yielding CMRO2 with separately measured SaO2 over the time-course. Data were acquired at 3 T (Siemens Prisma): TR/TE1/TE2 = 88.2/5.5/13.5 ms, FOV = 240x240 mm2, voxel size = 1x1x5 mm3, flip-angle=15°, velocity-encoding = 76.42 cm/s. As in ref. 5, peripheral k-space areas were filled with view-sharing among temporally adjacent projections, leading to an effective temporal resolution of 6 s. Time-series images were then corrected for rigid body motion.
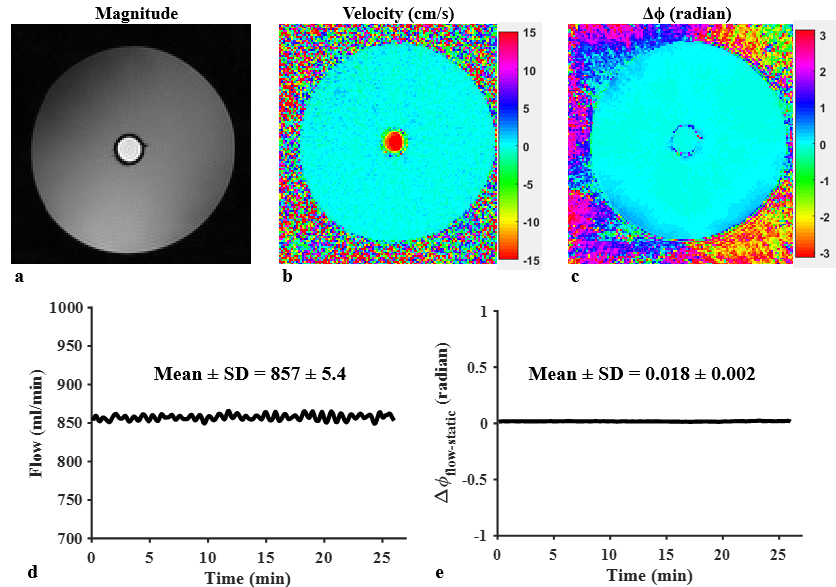
Phantom imaging: To evaluate the stability of the imaging system, data was acquired on a flow phantom for 28 minutes with the above protocol. Flow velocity and background field-corrected, dual-echo phase difference (Δϕ) maps were generated, from which total flow and Δϕ in flow voxels relative to surrounding stationary water (Δϕflow-static) were calculated over the time-course.
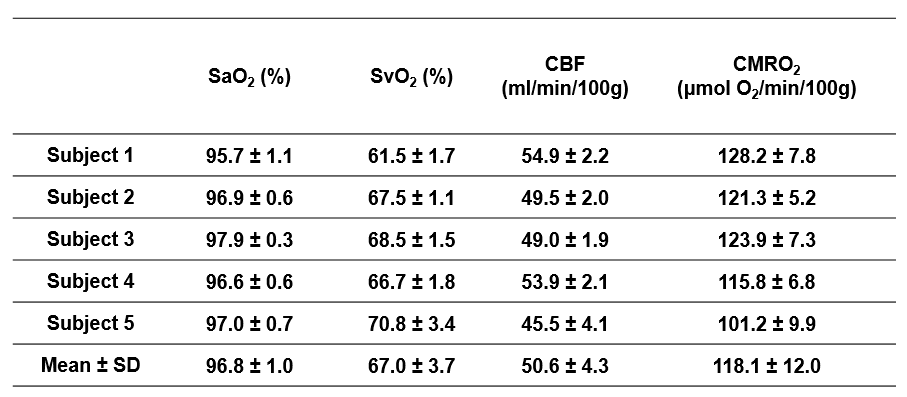
CMRO2 during wakefulness: Data were continuously collected for 32 minutes in five healthy subjects (ages 29 ̶ 33 years; two females) during wakefulness. Subjects were instructed to watch a video and self-attested that they were awake during the entire imaging period. Mean and standard deviation (SD) of quantified parameters (SaO2, SvO2, CBF, CMRO2) over the time-course were calculated in each subject for all 300 temporal frames.
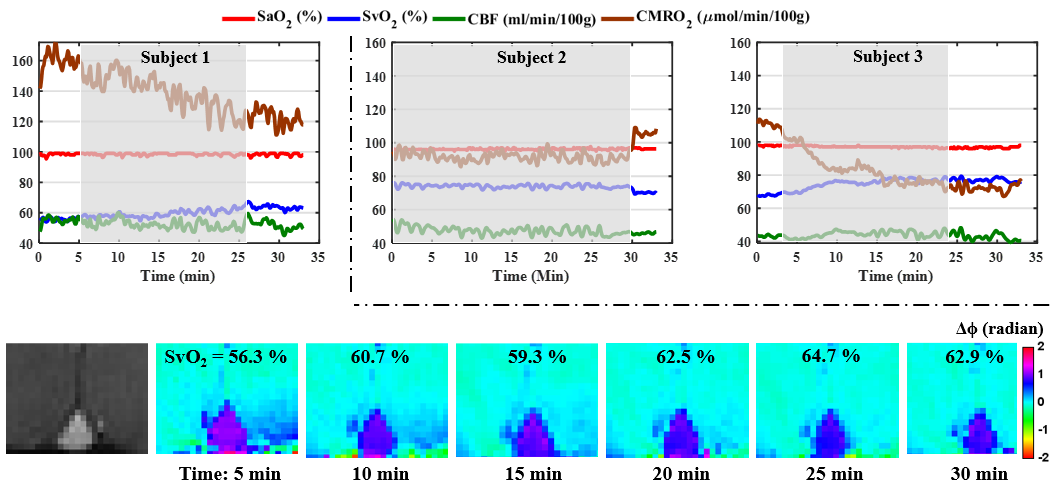
CMRO2 during sleep: Three healthy subjects (ages ranging 31 ̶ 33 years; one female), two drawn from the group who participated in the study during wakefulness (subjects 1 and 3), volunteered in this study conducted late in the day. All indicated that they would be able to fall asleep during scanning. To determine whether or not subjects were asleep or awake, they were instructed to respond by squeezing the scanner’s squeeze ball via a visual cue administered every 3-5 minutes. Subjects deemed to be asleep (no response) were awakened by the operator after 30 minutes and asked to stay awake for the final 5 minutes of the study. Time-courses of the measured parameters were plotted in each subject for all 330 temporal frames.
Results
Figure 1 shows phantom images along with the temporal evolution of flow and Δϕflow-static measurements, yielding coefficients of variation (CV) along the time series of ~ 0.6 % in flow rate (Fig. 1d) and negligible phase difference Δϕflow-static (~ 0.018 radians; Fig. 1e), suggesting excellent scanner stability. Figure 2 shows group-averaged time-courses of the four physiologic quantities during wakefulness. The derived functional parameters for each subject are provided in Table 1. In all subjects (except #5 who showed evidence of significant head motion), CVs were less than 7%. In Fig. 3, the effect of sleep on CMRO2 is clearly evident from the time courses of physiologic parameters in the three subjects. Compared to wakefulness, CMRO2 during sleep decreased by approximately 20 % primarily due to increased SvO2 (by about 11 %) with nearly imperceptible change in CBF.Discussion and Conclusions
Continuous scanning via high temporal-resolution whole-brain blood flow and oximetry enables monitoring of the trajectory of CMRO2 during wakefulness and sleep. The three subjects exhibited variable responses of the physiologic parameters during sleep, perhaps reflecting different stages of sleep. However, common to all three study subjects was decreased CMRO2 during sleep without apparent reduction in CBF, which may suggest flow-metabolism uncoupling.
The method could be useful to evaluate subjects with sleep disorders. One limitation of this work is that the stage of sleep is not known in the absence of polysomnography, which requires EEG monitoring during scanning, currently in progress of being implemented.
Acknowledgements
NIH grant RO1-HL122754References
1. Boyle PJ, Scott JC, Krentz AJ, Nagy RJ, Comstock E, Hoffman C. Diminished brain glucose metabolism is a significant determinant for falling rates of systemic glucose utilization during sleep in normal humans. J Clin Invest. 1994;93:529-535.
2. Madsen PL, Schmidt JF, Wildschiodtz G, Friberg L, Holm S, Vorstrup S, Lassen NA. Cerebral O2 metabolism and cerebral blood flow in humans during deep and rapid-eye-movement sleep. J Appl Physiol. 1991;70:2597-2601
3. Jain V, Langham MC, Wehrli FW. MRI estimation of global brain oxygen consumption rate. J Cereb Blood Flow Metab. 2010;30:1598-1607.
4. Jain V, Langham MC, Floyd TF, Jain G, Magland JF, Wehrli FW. Rapid magnetic resonance measurement of global cerebral metabolic rate of oxygen consumption in humans during rest and hypercapnia. J Cereb Blood Flow Metab. 2011;31:1504-1512.
5. Cao W, Chang YV, Englund EK, Song HK, Barhoum S, Rodgers ZB, Langham MC, Wehrli FW. High-speed whole-brain oximetry by golden-angle radial MRI. Magn Reson Med 2017;Early view.
Figures