2360
Spatial- and category-based attention have distinct functional organizations in human visual cortex1MRC-Cognition and Brain Sciences Unit, University of Cambridge, Cambridge, United Kingdom, 2BIO-X, Stanford University, Stanford, CA, United States
Synopsis
Recent studies have challenged the two-streams division of primate visual cortex into a ventral object identity stream (‘what’) and a dorsal object location stream (‘where’). We collected fMRI data while human participants performed a selective attention task. We used a multivariate discriminant method to separately decode the currently attended location and object category. We found a distinction between early visual regions coding the attended location and ventral/dorsal stream regions coding the attended category. Our study reveals a large-scale functional organization for spatial- and category-based attention in visual cortex, but its principal axis is posterior-anterior rather than dorsal-ventral.
Introduction
Traditionally, response preferences in the primate visual system have been divided into a dorsal stream that is principally concerned with object location (‘where’) and a ventral stream that is principally concerned with object identity (‘what’)1. However, recent studies2,3 have shown representations of ‘what’ information in the dorsal pathway. Here, we report an fMRI study that investigates neural correlates of attention to object category (‘what’) and object location (‘where’) in regions across human visual cortex.Methods
Participants (N=6) participated in three sessions, two for the main experiment and one for functional localizers. We used a 3T Siemens Prisma (32-channel head coil) with the following EPI parameters: 3mm voxels, TR=2000ms, TE=30ms, FA=78o, Matrix size=64*64*32, ToA=~11mins.
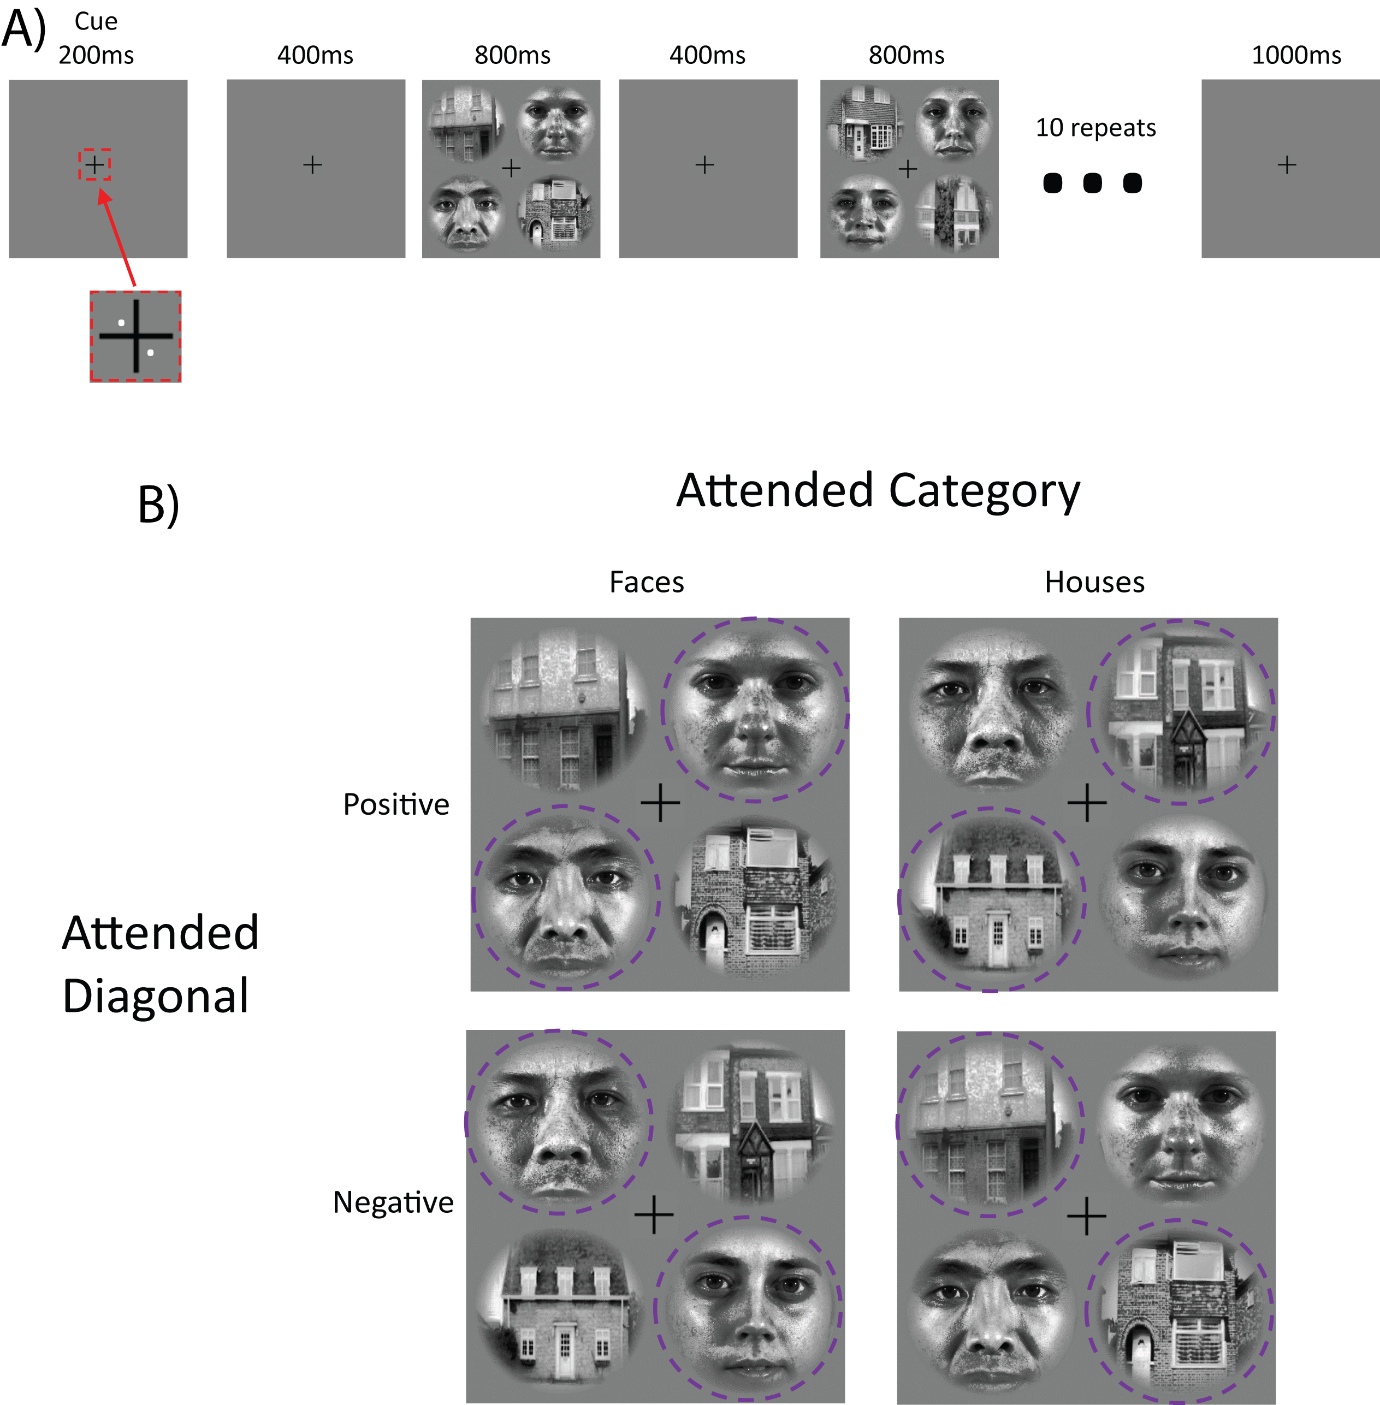
The two main experimental sessions consisted of an attentional same-different judgement task and a fixation control task respectively. Participants maintained fixation on a cross in the middle of the screen throughout, and fixation accuracy was verified online using an eye tracker.
For the attention task, participants made same-different judgements based on image identity on each trial (Figure 1A). The 4 conditions (Figure 1B) were presented in a randomised order over 4 runs (20 blocks per run). We also collected 4 runs of a separate no-distractor version of the task, the results of which will be reported in future work.
The fixation control task involved identical stimulus presentation parameters as the same-different task. However, participants were instructed to ignore the initial cue, and instead detected 45° rotations of the fixation cross (50% of trials). This fixation task provided a baseline to estimate and control for stimulus-driven effects.
The localizer session comprised six runs of a retinotopic localizer4–6 and four runs of a category-selective localizer. We used the localizer data to define the following regions of interest (ROI) in each participant: early visual areas (V1, V2v, V2d, V3v, V3d), dorsal stream (V3a, V3b, scene-selective transverse occipital sulcus [TOS]) and the ventral stream (occipital face area [OFA], fusiform face area [FFA], parahippocampal place area [PPA], object-selective posterior fusiform sulcus [pFs]).
We analysed fMRI response patterns with linear discriminant contrast (LDC)7, which provides a multivariate decoding index that is centered on zero under the null hypothesis of no reliable difference between conditions. We cross-validated LDC estimates using all four leave-one-run-out combinations of train and test data. Moreover, to prevent discrimination based on stimulus-related effects, the category LDC was trained on data from attending to one diagonal, and tested on data from attending to the other diagonal. Similarly, the location LDC was trained on data from attending to one stimulus category, but tested on the other stimulus category. In this cross-discrimination scheme, a stimulus effect would result in negative LDC because the visual stimuli are cross-matched across the training and testing data. In contrast, an effect of attended location or category would result in positive LDC.
Results and Discussion
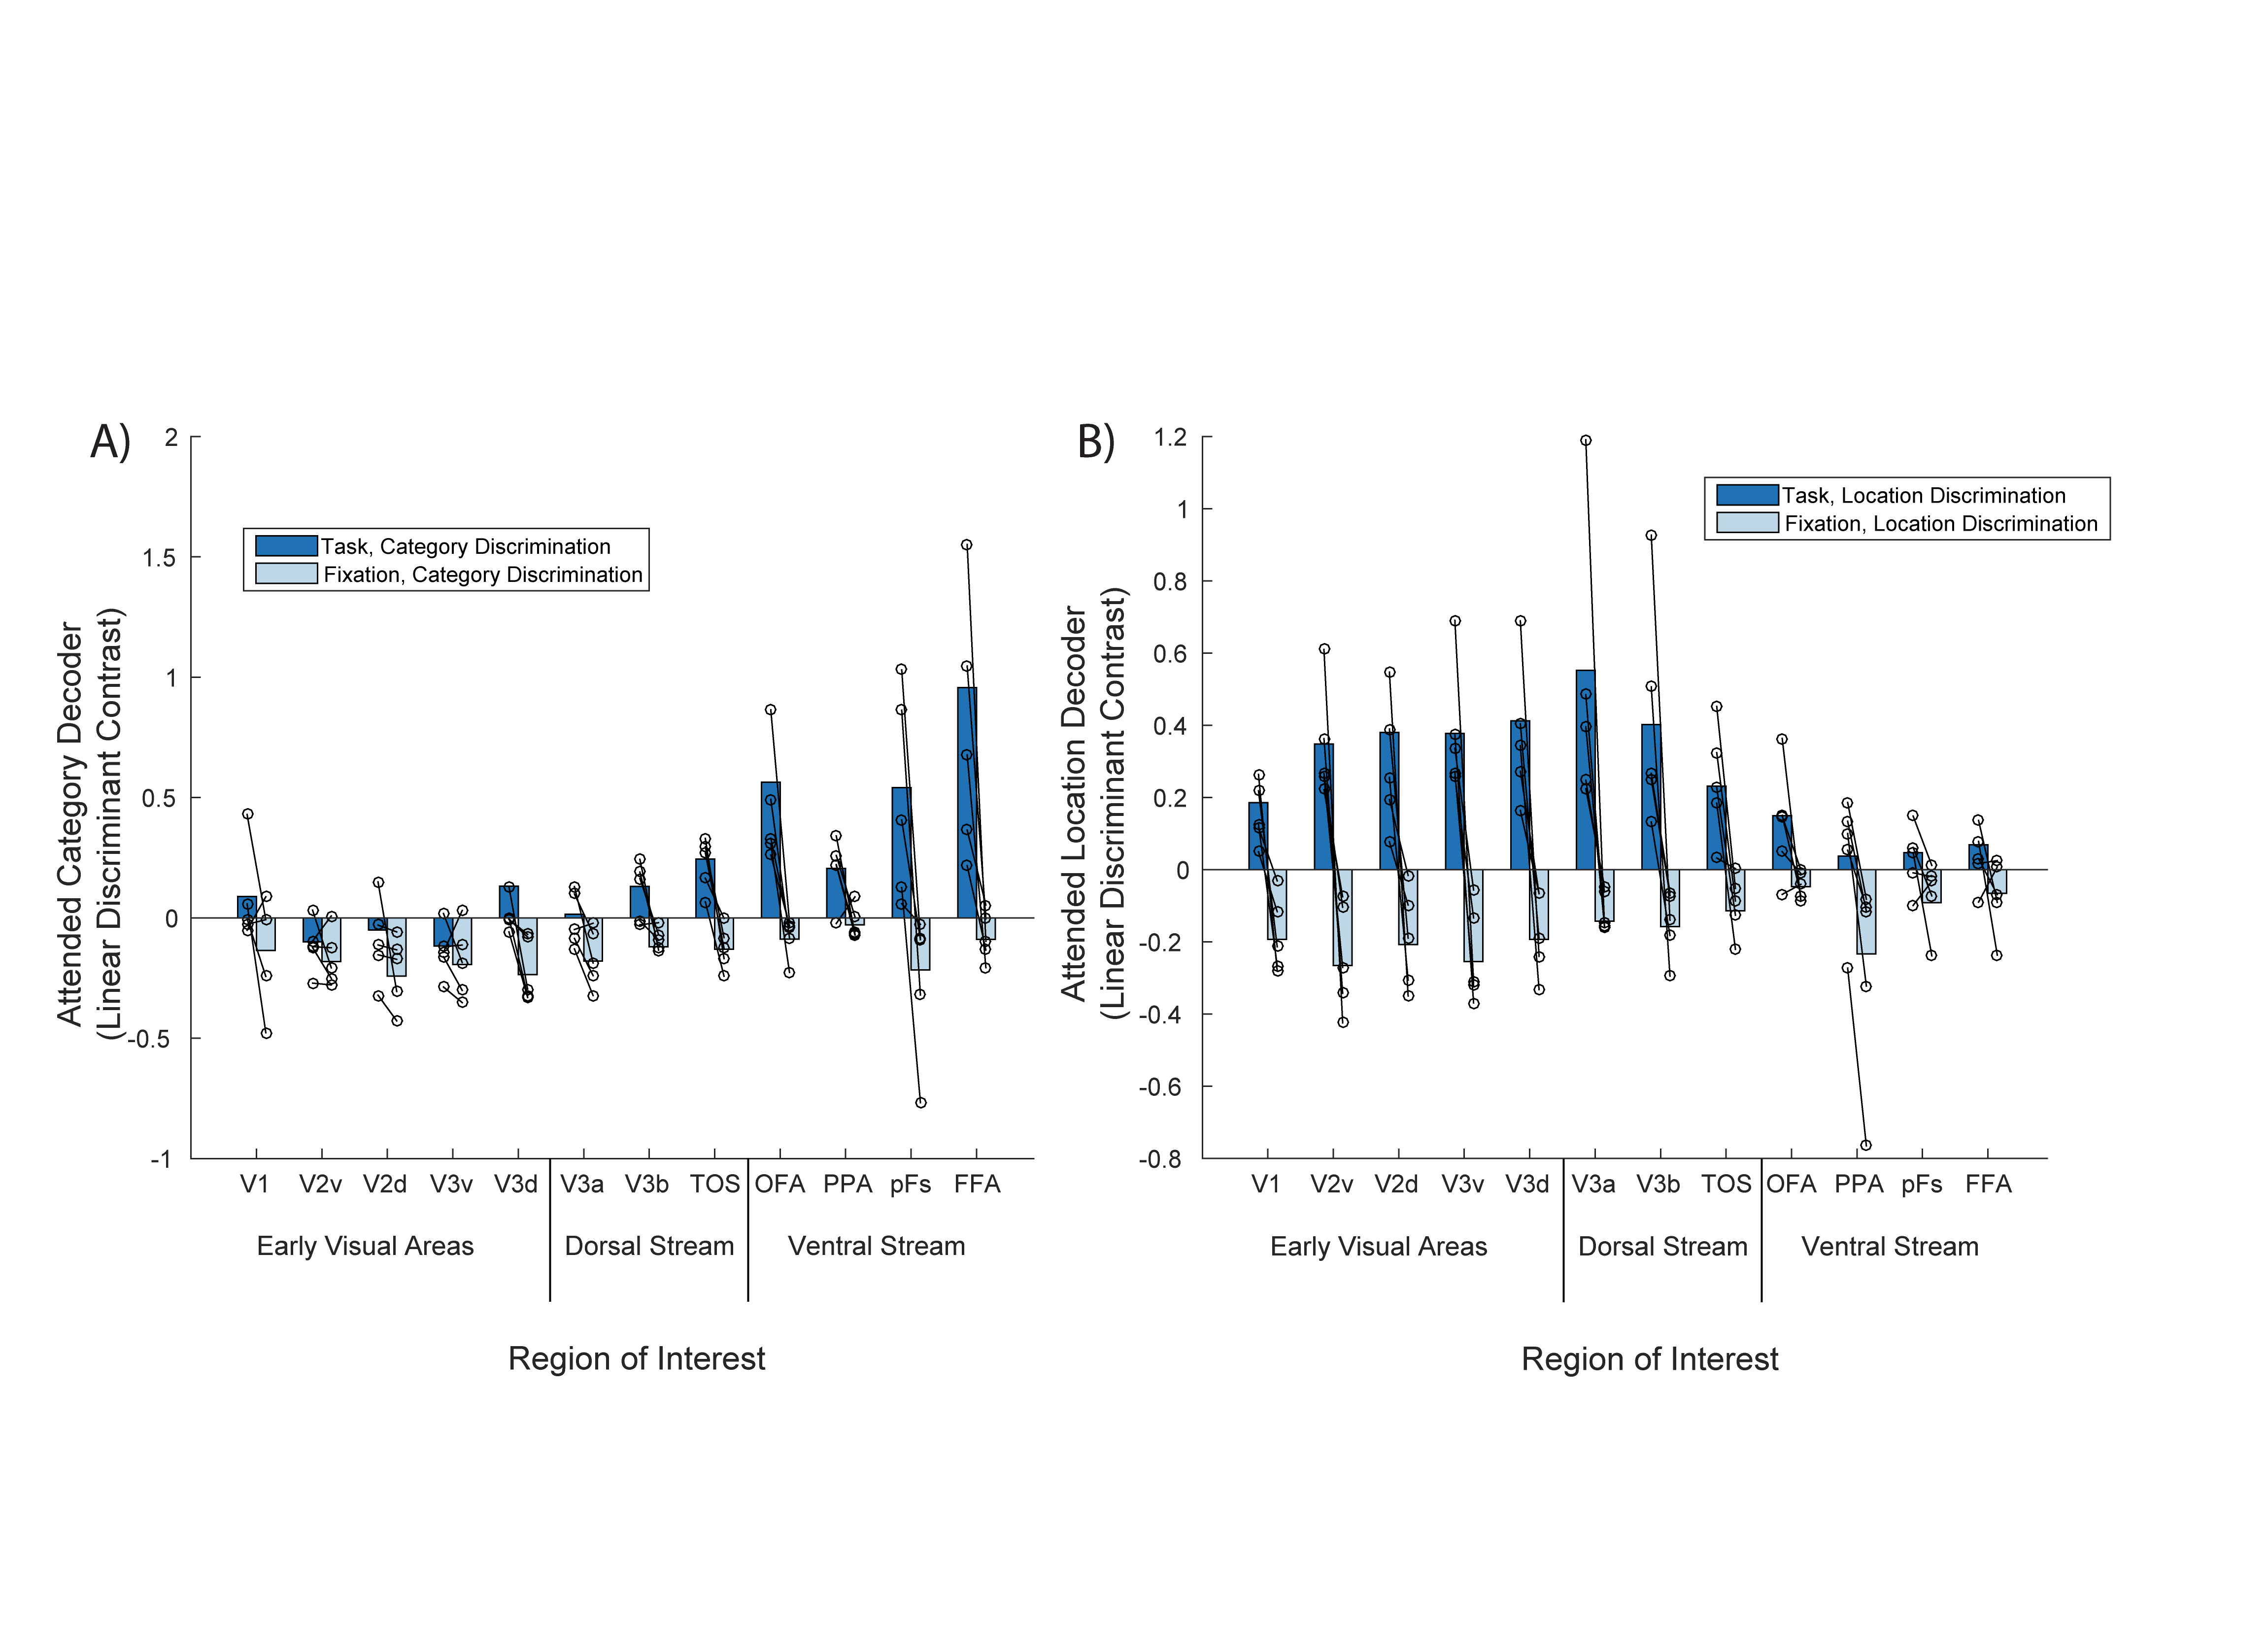
1) Object
category information is present in both ventral and dorsal stream regions
(Figure 2A, dark bars)
The largest
category LDC during the attention task was observed in ventral stream regions,
peaking in FFA/PPA. However, we also observed consistently positive category
LDC in dorsal stream regions (V3b/TOS). This result adds to a growing body of
literature showing ‘what’ information being present in both visual processing
streams2,3. By contrast, category LDC effects
in early visual cortex were close to zero or even negative, indicating a weak
stimulus effect.
2) Object
location information is primarily present in early visual areas (Figure 2B,
dark bars)
We observed
consistently positive location LDC during the attention task in early visual
areas and the beginning of the dorsal stream, indicating a representation of
the attended object’s location. This ‘where’ representation was most strongly
seen in V2, V3 and V3a/b.
3) Negative
LDC for the fixation control task across all ROIs (Figure 2, light bars)
We applied
the same category and location LDC analysis to data from a fixation task, where
attention to the stimuli was not required. In this context, we observed
negative LDC in nearly all cases, indicating that any consistent distinctions
were made based on the stimuli. This control analysis suggests that
stimulus-driven effects (e.g. responses to the cue at the beginning of each
block) are unlikely to account for the positive LDC observed during the main
attention task.
Conclusion
Our study indicates that the classic two-streams account of visual processing only provides a partial explanation for the functional organization of selective attention. Although location discrimination recruits dorsal stream regions to some extent, the large-scale organization for spatial- and category-based attention appears to have a dominant anterior-posterior axis in addition to a weaker dorsal-ventral axis.Acknowledgements
The authors would like to thank Medical Research Council, UK (MRC) and Agency for Science, Technology and Research, Singapore (A*STAR) for funding this research. We are also grateful to all participants and the radiographers at MRC-CBU.References
1. Mishkin, M., Ungerleider, L. G. & Macko, K. A. Object vision and spatial vision: two cortical pathways. Trends Neurosci. 6, 414–417 (1983).
2. Vaziri-Pashkam, M. & Xu, Y. Goal-Directed Visual Processing Differentially Impacts Human Ventral and Dorsal Visual Representations. J. Neurosci. 37, 8767–8782 (2017).
3. Assad, J. a, Fitzgerald, J. K. & Freedman, D. J. Generalized associative representations in parietal cortex. Nat. Neurosci. 14, 1075-U179 (2011).
4. Kay, K. N., Winawer, J., Mezer, A. & Wandell, B. A. Compressive spatial summation in human visual cortex. Journal of Neurophysiology 110, 481–494 (2013).
5. Dumoulin, S. O. & Wandell, B. A. Population receptive field estimates in human visual cortex. Neuroimage 39, 647–660 (2008).
6. Kriegeskorte, N. et al. Matching Categorical Object Representations in Inferior Temporal Cortex of Man and Monkey. Neuron 60, 1126–1141 (2008).
7. Walther, A. et al. Reliability of dissimilarity measures for multi-voxel pattern analysis. Neuroimage 137, 188–200 (2016).
Figures