2356
Comparison of Resting State Networks using EEG and Pseudo-continuous ASL1Computer Science, State University of New York at Binghamton, Vestal, NY, United States, 2Cornell MRI Facility, Uninversity of Cornell, Ithaca, NY, United States
Synopsis
Arterial spin labeling (ASL) and electroencephalography (EEG) data were acquired separately on young healthy subjects to verify whether EEG signal reflects the same brain networks corresponding to those extracted from ASL images. Four brain networks were derived from both resting state ASL images and resting state EEG recordings during both eye-open and eye-closed conditions.
Introduction
Electroencephalography (EEG) is a useful electrophysiological monitoring method to record electrical activity of the brain. It’s frequently used to diagnose a variety of diseases such as epilepsy1, affective disorders2, and is also widely adopted in brain connectivity studies3-4. EEG dynamics exhibit the characterization of human neural activity during resting state. Here we investigate the relationship of the brain networks found in both EEG and Arterial Spin Labeling (ASL).Methods
Pseudo-Continuous Arterial Spin Labeling (pCASL) images5-7 were acquired from eleven young, healthy volunteers during rest on a GE 3T MR750 scanner using a single-shot 3D stack-of-spiral acquisition and background suppression with the following scan parameters: TE/TR=14/5020 ms, voxel size=3.75x3.75x4 mm3, 40 slices, labeling duration=2000 ms, and post-labeling delay=1800ms. A baseline ASL scan was first performed to provide a coil phase map and to quantify perfusion for each subject. A background suppression design optimized for just 0.3% background signal was employed. With background suppression, both control and label scans are sensitive to CBF, so control and label scans were performed and processed separately with the temporal resolution of a single TR. Besides, 8-min resting state EEG fluctuations were recorded with a 128-channel EEG sensor net (Electrical Geodesics, Inc.) with sampling rate of 250/s. The 8-min recording was divided into a 4-min eye-open session and a 4-min eye-closed session recorded continuously.
The pCASL images were co-registered and normalized to standard Montreal Neurological Institute (MNI) space using the T1 image as an intermediate target, and smoothed with a 6×6×6 mm Gaussian kernel. The EEG data was first filtered by a 30Hz frequency filter and the ballistocardiographic (BCG) artifacts were removed using EGI's software tool (Netstation 5), and then the data was denoised for eye blinking, eye movement and muscle movement artifacts by the individual 128-component ICA analysis in EEGLAB. Due to elevated noise level and non-continuous recording issues, the EEG data from four subjects were excluded from further analysis.
Registered pCASL images served as the input to a Melodic 20-component group ICA. Denoised EEG data from every subject was separated into eye-open and eye-closed sessions to account for different frequency spectra8. Later the EEG data was concatenated along temporal dimension for each session to form a group and fit into a group ICA. The important components were rendered onto a 2D circular view electrode map using EEGLAB.
Results and discussion
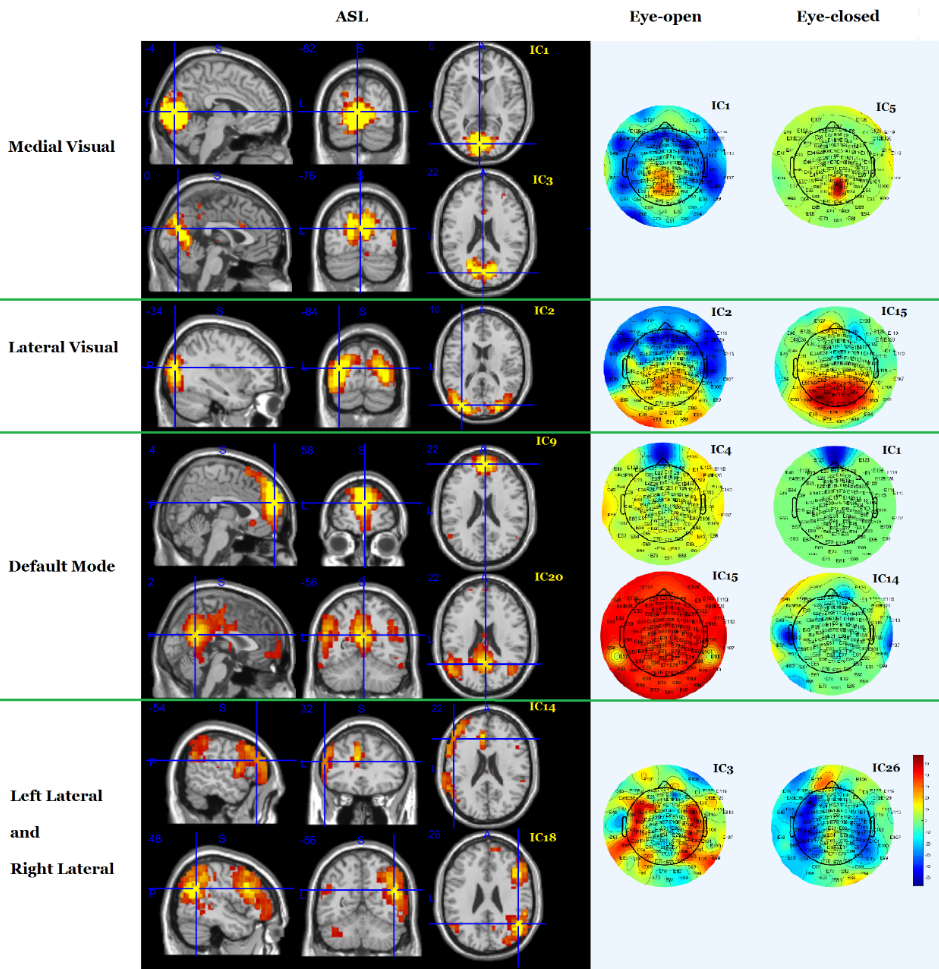
For ASL images after group ICA, 4 networks were clearly observed, including Medial Visual, Lateral Visual, Default Mode Network (DMN) and Left and Right Lateral networks, shown in Figure 1 left column. Notice that the Medial Visual network was separated into two different independent components (ICs), including IC 1 and IC 3. Lateral Visual was shown fully in IC 2. DMN were divided into frontal and posterior parts in IC 9 and IC 20. Left and Right Lateral was represented by IC 14 and IC 18.
For EEG data after group ICA along temporal dimension, the same 4 networks were found in both eye-open and eye-closed EEG sessions, shown in the middle and right columns of Figure 1, corresponding to those derived from ASL images. The region of Medial Visual was larger in eye-open session (IC 1) compared to eye-closed session (IC 5). The Lateral Visual of eye-open session exhibited a diffuse pattern at the same location (IC 2), while the eye-closed session detected much stronger signal but with residual eye movement artifacts (IC 15). The DMN in both sessions showed consistent maps for frontal (IC 4, IC 1) and posterior parts (IC 15, IC 14), although the location of posterior DMN during eye-closed condition is slightly higher toward the right-hand side. The Left and Right Lateral of EEG data were comparable to the ASL data after combining two EEG ICs (IC 3, IC 26).
It is shown that the brain networks detected by the EEG dynamics is highly similar to those detected by ASL. Although EEG data is much more sensitive to various kinds of noises, such as eye blinking, eye movements, muscle movements, and BCG after carefully removing the noises, the EEG signal shows stability and consistency. Although the networks detection from EEG signal do not perfectly matches those from ASL, further improvement in noise removal and data collection from more subjects may reduce the discrepancies. EEG may potentially provide a convenient and fast way for the diagnosis of brain connectivity change.
Acknowledgements
No acknowledgement found.References
1. Tatum, William O. "Handbook of EEG interpretation." Demos Medical Publishing. pp. 155–190. (2014). ISBN 9781617051807. OCLC 874563370.
2. Kupfer, David J., et al. "The application of EEG sleep for the differential diagnosis of affective disorders." Am J Psychiatry 135.1 (1978): 69-74.
3. Chen, Andrew CN, et al. "EEG default mode network in the human brain: spectral regional field powers." Neuroimage 41.2 (2008): 561-574.
4. De Vico Fallani, Fabrizio, et al. "Evaluation of the brain network organization from EEG signals: a preliminary evidence in stroke patient." The Anatomical Record 292.12 (2009): 2023-2031.
5. DC Alsop and JA Detre. Multisection cerebral blood flow MR imaging with continuous arterial spin labeling. Radiology 208(2): 410-416 (1998).
6. HM Gach and W Dai. Simple model of double adiabatic inversion (DAI) efficiency. MRM 52(4): 941-946 (2004).
7. W Dai et al. Mild cognitive impairment and Alzheimer’s Disease: Patterns of altered cerebral blood flow at MR imaging. Radiology 250(3): 856-866 (2009).
8. Barry, Robert J., et al. "EEG differences between eyes-closed and eyes-open resting conditions." Clinical Neurophysiology 118.12 (2007): 2765-2773.
Figures