2355
Mirror Therapy Increases Resting-State Functional Connectivity in Stroke Recovery1Stanford University, Palo Alto, CA, United States, 2Southend Hospital, Southend-on-sea, United Kingdom
Synopsis
Mirror therapy increases resting-state functional connectivity when compared to conventional rehabilitation. In particular, connectivity increase is linearly proportional to increase in pinch strength. Our results strongly indicate neuronal changes resulting from mirror therapy, and that mirror therapy is of palpable benefit.
Introduction
Stroke affects fifteen million people worldwide each year. It is a leading cause of disability, in the United States, costing $34 billion in health care, treatment, and missed work days. There is evidence showing that mirror therapy (MT) can improve upper limb functioning, in stroke patients, better than conventional rehabilitation (CR) [1]. The neural mechanisms underlying MT are mostly unknown. Hence, the goal of this study is to investigate resting-state functional connectivity differences between MT and CR in stroke recovery.Methods
Six stroke patients, suffering mobility in a single upper limb, were enrolled in a randomized study; beginning treatment with either CR or MT. Both treatments involve physical therapy: repetitive movement of forearm, wrist, and hand 3x15 minutes/day. MT treatment places an actual mirror, between patients’ arms, so that an image of a nonaffected limb provides illusion of normal movement in an affected limb. After three weeks, patients switch therapy group. Resting-state fMRI scans (GE 1.5T, EPI) were collected at baseline after three weeks and six weeks. Patients’ physical pinch and grip strength were measured at each time.
Data was preprocessed via FSL [2] for slice timing correction, motion correction, spatial smoothing with a 5mm kernel, high-pass temporal filtering (100s), and spatial normalization to MNI standard space. Individual independent component analysis (ICA) was carried out using FSL MELODIC software. Each patient’s independent components were carefully inspected for noise components. Those components were then regressed out. For group level analysis, data sets from MT, CR, and baseline scans (BL) were concatenated in time to create a single 4D data set which was then projected into a 17-dimensional subspace by principal component analysis. Next, using the FastICA algorithm, the data set was decomposed into 17 sets of independent vectors that describe signal variation, across temporal and spatial domains, by optimizing for nonGaussian spatial source distributions. Subject-specific statistical maps were created to test for differences between each group, in the identified components, using dual regression in FSL.
Results
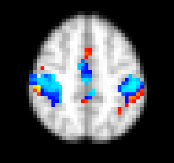
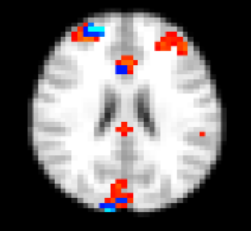
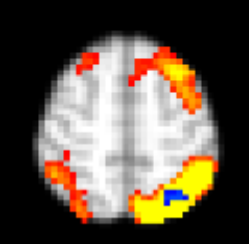
We observed increased functional connectivity in MT vs. BL in the motor network (motor, somatosensory, supplementary motor cortices) as shown in Figure 1. Figure 2 shows increased functional connectivity in MT vs. CR in the anterior salience network (prefrontal cortex, anterior cingulate, right ventromedial prefrontal cortex). Using parametric analysis to account for changes in pinch strength, we observed increased functional connectivity in MT vs. CR in the left parietal region within the left executive control network (Figure 3).Discussion
We have demonstrated that MT increases resting-state functional connectivity when compared to CR. In particular, connectivity increase is linearly proportional to increase in pinch strength. There is no change in functional connectivity between CR and BL. Neither is there linear relationship between CR vs. BL nor MT vs. BL. Our results strongly indicate neuronal changes resulting from mirror therapy, and that mirror therapy is of palpable benefit.Acknowledgements
No acknowledgement found.References
1. Saleh et al., Network interactiions underlying mirror feedback in stroke: A dynamic causal modeling study. NeuroImage: Clinical 13; 2017: 46-54.
2. M. Jenkinson, C.F. Beckmann, T.E. Behrens, M.W. Woolrich, S.M. Smith. FSL. NeuroImage, 62:782-90, 2012
Figures