2353
Functional connectivity underlying attentional deficits in children born preterm1Radiology and Biomedical Imaging, University of California San Francisco, San Francisco, CA, United States, 2Neurology, University of California San Francisco, San Francisco, CA, United States, 3Pediatrics, University of California San Francisco, San Francisco, CA, United States, 4Radiology, University of California San Francisco, San Francisco, CA, United States
Synopsis
Children born very preterm are at a increased risk to develop attention deficits. Here we employ fMRI connectivity analysis to study the functional connectivity underlying these attention deficits in preterm children ages 10-14. Subjects were separated into normal and attention deficit groups and then group differences in voxelwise connectivity from 16 seed regions were delineated using AFNI. Significant clusters of hypoconnectivity in the attention deficit group were found in eight of the ROIs, primarily from the middle frontal gyri and anterior cingulate cortices, as well as hyperconnectivity from the right anterior insula.
Introduction
Attention deficit is one of many psychological disorders that affect with an increased risk to children born severely preterm[1]. Obtaining a better understanding of the functional underpinnings of these disorders in preterm children will help us to better understand their neuronal origin and identify infants particularly at risk of developing attention deficits later on in childhood, allowing for earlier and more effective treatment and therapy. Here we studied functional connectivity in several regions of interest spanning the alerting, orienting and executive attention networks[2] in 10-14 year-old preterm children with and without attention deficits in order to identify areas of hyper- and hypo-connectivity within and between these networks.Methods
Twenty-two children ages 10-14 years (mean = 12.48 years) born at gestational ages between 24 and 32 weeks examined. All children underwent 3T MR imaging (GE Discovery MR750) including 3D T1 SPGR (TR = 10ms, flip angle = 15°, 1mm isotropic) and BOLD resting-state (rs)-fMRI (TR = 2000ms, 210 frames, flip angle = 90°, 24cm FOV 128x128 in plane, 3mm slice thickness) imaging.
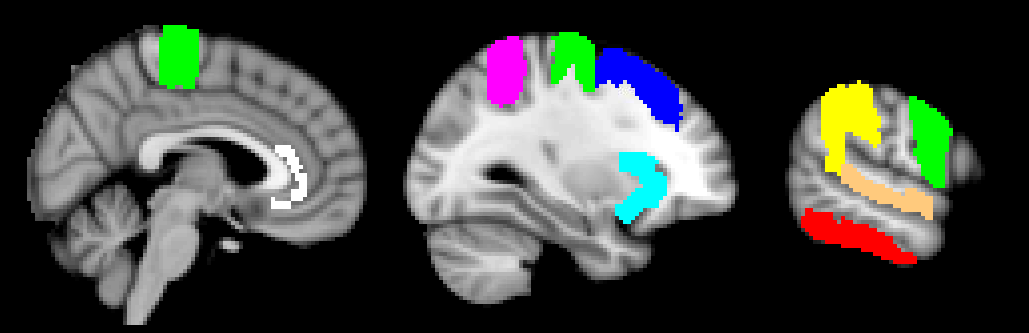
BOLD images were preprocessed in FSL[3] to remove motion-related, mean CSF and white matter signal, then registered to MNI standard space via their corresponding T1 SPGR image. Sixteen predetermined grey matter ROIs (eight regions in both hemispheres, obtained from Harvard Oxford Cortical Atlas, Figure 1) were used to compute voxelwise correlation maps for each participant’s fMRI residuals. All children additionally underwent attention testing using either Test of Variables of Attention (TOVA)[4] or Child Behavioral Checklist (CBCL)[5] exams administered by UCSF child psychologists, and were subsequently assigned a composite attention score indicating the presence or absence of attention deficits. For analysis, children were separated into attention deficit and attention normal groups on the basis of the scores (comprising 15 and 7 children, respectively). ROI clusters of significant group differences in voxelwise correlation were delineated using AFNI’s 3dTTest tool (thresholded at p=0.05, α=0.05, NN=1)[6].
Results
No significant differences in age or sex composition were found between groups.
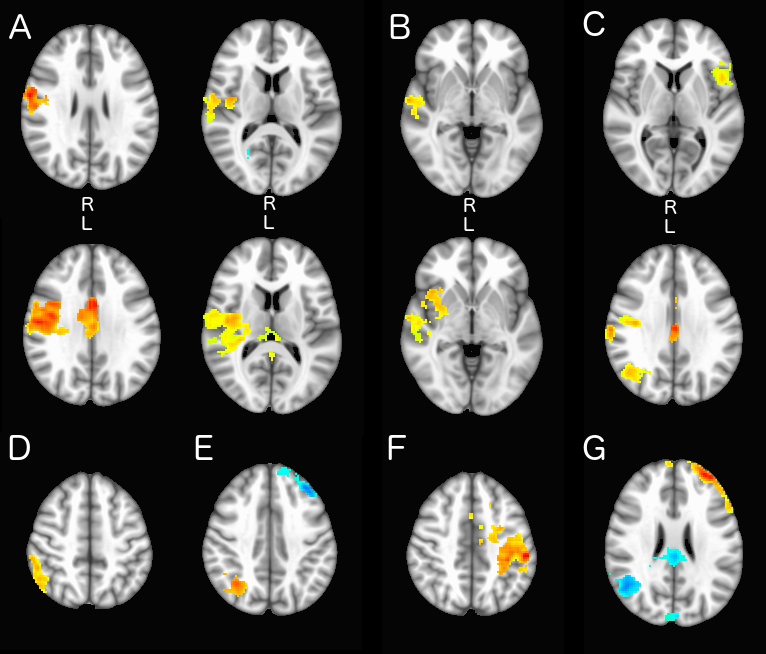
3dTTest revealed group differences in voxelwise connectivity among the studied ROIs, including both middle frontal gyri, both anterior cingulate cortices, both precentral gyri, the left inferior temporal gyrus, the left superior parietal lobule, the right supramarginal gyrus, and the right anterior insula. A visual summary of the significant clusters is shown in Figure 2. The left superior parietal lobule and right anterior insula showed clusters of both hyper- and hypoconnectivity in the attention deficit group relative to the attention normal group, while the other six significant ROIs only showed areas of hypoconnectivity in the attention deficit group.
Discussion
Our analysis revealed significant differences in voxelwise functional connectivity among several ROIs implicated in the alerting, orienting and executive attention networks. In particular middle frontal gyral and anterior cingulate cortex hypoconnectivity to the right insular region was highly apparently in the attention deficit group. Connections from these two regions are believed to play a significant role in mediating transitions between the dorsal and ventral attentional networks and governing executive attention[2][7], and our findings suggest this could be the primary functional disconnection underlying the attention deficits experienced in our cohort. Right insular hyperconnectivity to cingulate and sensory association areas may also be another main contributor, and is a known functional marker of ADHD[8].
However, the various other clusters of hypoconnectivity in the attention deficit group demonstrate that there may be other functional disconnections in the alerting and orienting networks involved, and that the deficits experienced by this cohort may not be homogenous in nature or cause. It is also possible that the relatively small size of our attention normal group could cause some spurious clusters to appear. Further exploration of the structural differences between these groups to complement our functional analysis is ongoing.
Acknowledgements
Study and analysis funded by R01HD072074 and P01NS082330.References
[1] Serati M, Barkin JL, Orsenigo G, Altamura AC, Buoli M (2017) Research Review: The role of obstetric and neonatal complications in childhood attention deficit and hyperactivity disorder - a systematic review. Journal of child psychology and psychiatry, and allied disciplines.
[2] Posner MI, Rothbart MK, Voelker P (2016) Developing brain networks of attention. Current opinion in pediatrics 28:720-724.
[3] Jenkinson M, Beckmann CF, Behrens TE, Woolrich MW, Smith SM (2012) FSL. Neuroimage:782-790.
[4] Greenberg LM (2011) The Test of Variables of Attention. In, 8.0 Edition. Los Alamitos: The TOVA Company.
[5] Achenbach TM, Rescorla LA (2001) Manual for the ASEBA School-Age Forms & Profiles. In. Burlington, VT: University of Vermont, Research Center for Children, Youth, & Families.
[6] W. CR (1996) AFNI: Software for analysis and visualization of functional magnetic resonance neuroimages. Computers and Biomedical Research:162-173.
[7] Japee S, Holiday K, Satyshur MD, Mukai I, Ungerleider LG (2015) A role of right middle frontal gyrus in reorienting of attention: a case study. Frontiers in systems neuroscience 9:23.
[8] Elton A, Alcauter S, Gao W (2014) Network connectivity abnormality profile supports a categorical-dimensional hybrid model of ADHD. Human brain mapping 35:4531-4543.
Figures