2350
Alterations of neural activity patterns in pontine versus coronal radiata strokeChunxiang Jiang1,2, Siqi Cai1,2, Rui Meng1,2, Xiaojing Long1, Hang Zhang1, and Lijuan Zhang*1
1Shenzhen Institutes of Advanced Technology, Chinese Academy of Sciences, Shenzhen, China, 2University of Chinese Academy of Sciences, Beijing, China
Synopsis
We compared the alteration of intrinsic neural functional networks in 15 patients with ischemic stroke (IS) in pontine (PS) and 21 patients with IS in coronal radiata (CRS) with 30 healthy controls (HCs). Degree centrality (DC) increased in posterior cingulate gyrus and ReHo decreased in sensorimotor cortex and default mode network in PS and CRS group relative to HCs group. DC increase was observed in cuneus in CRS group. These findings suggest that IS disrupts the functional integration of brain in an extensive scale, and the lesion location may substrate the functional outcomes for the IS patients.
Introduction
Ischemic stroke (IS) damages not only regional functions but also function integration between brain regions.1,2 The diverse lesion locations may substrate the prognostic outcomes.3 In this study we investigated the differences of the disruption in neural networks with IS lesion located in pontine (PS) and coronal radiata (CRS) using resting-state functional magnetic resonance imaging (rs-fMRI).Methods
The study was approved by local institutional review board. Informed consent was obtained from each of the participants before the study. Thirty six subjects with clinically confirmed first-ever single IS lesion (15 with lesion in PS, 21 with lesion in CRS) and 30 HCs were recruited. Rs-fMRI were acquired axially using an echo-planar imaging sequence with typical parameters of TR/TE 3000/30 ms, flip angle 90°, field of view 210 mm, matrix 128×128, slice thickness 3mm, bandwidth 1395 Hz/ pixel, 60 volumes. Subjects were instructed to relax their minds with eyes closed and remain motionless as much as possible during the data acquisition. In addition, high resolution T1-weighted images were obtained using 3D MPRAGE with TR/TE/TI=1900/2.53/900 ms, flip angle=9°, FOV=250 mm and an in-plane resolution of 1.0 mm × 1.0 mm × 1.0 mm. Data preprocessing was conducted using DPARSF (Data Processing Assistant for Resting-State fMRI, http://www.restfmri.net) which is based on Statistical Parametric Mapping (SPM8, http://www.fil.ion.ucl.ac.uk/spm) and Resting-State fMRI Data Analysis Toolkit (http://www.restfmri.net). Preprocessing procedures included: 1) removal of the first 5 volumes; 2) slice dependent time shifts; 3) motion correction; 4) T1-weighted images coregistered to the mean functional image and segmented into gray matter(GM), white matter and cerebrospinal fluid tissue maps; 5) functional images normalized to the MNI space using the transformation parameters and resampled to 3×3×3 mm3; 6) spatial smoothing with a 4 mm full-width half-maximum Gaussian filter; 7) band-pass temporal filtering (0.01–0.08 Hz); 8) removing linear trends; 9) regression of nuisance variables(six-parameter rigid body motion, white matter, and CSF signals). Degree centrality (DC) and regional homogeneity (ReHo) were computed within a GM mask. DC and ReHo were calculated before smoothing step. DC was threshold by 0.25 to eliminate weak correlations). A Fisher transformation was applied to improve the normality of the above maps. The statistical significance threshold was set at P<0.001 corrected by FDR (false discovery rate) for multiple comparison with age and sex as covariates.Results
Relative to HCs group, both PS and CRS groups exhibited that DC increased in bilateral posterior cingulate cortex (PCC) (160% for PS, 139% for CRS, P<0.001) while ReHo decreased in bilateral precentral (R: 123% for PS, 124% for CRS, L: 131% for PS, 121% for CRS, P<0.0001) , postcentral (R: 142% for PS, 128% for CRS, L: 153% for PS, 132 for CRS, P<0.0001) gyri, precuneus (R: 162% for PS, 144% for CRS, L: 138% for PS, 131% for CRS, P<0.0001) and posterior cingulate gyrus (R: 133% for PS, 125% for CRS, L: 125% for PS, 130% for CRS, P<0.0001). In addition, a DC increase in cuneus (97.7%, P<0.001) and decrease in anterior cingulate gyrus (117%, P<0.001) were found in CRS group. Notably, there was no difference found in DC and ReHo maps between the PS and CRS group.Discussion
Both PS and CRS groups showed DC increase in PCC in this study, which may represent the functional reorganization to coordinate information flow and maintain network integrity. The significantly reduced regional homogeneity in the sensorimotor areas was in parallel with the symptom profile of the IS patients. Additionally, the default mode network was involved, suggesting that the focal lesion leads to global disrupt the functional integrity. Network-based mechanism may embed the novel treatment of IS targeting the maximal functional recovery.Conclusion
Focal cerebral IS lesion leads to extensive functional connectivity disruption indexed by degree centrality and regional homogeneity, and the lesion location may substrate the difference in the functional outcomes for the IS patients.Acknowledgements
This study was supported by National Natural Science Foundation of China (81371359);National Basic Research Program of China (2015CB755500); Narutal science foundation of Shenzhen (JCYJ20160429191938883); Key Laboratory for Magnetic Resonance and Multimodality Imaging (2014B030301013).References
- Adhikari M H., Hacker C D, Siegel J S, et al. Decreased integration and information capacity in stroke measured by whole brain models of resting state activity. Brain. 2017; 140(4): 1068-1085.
- Inman CS, James G A, Hamann S, et al. Altered resting-state effective connectivity of fronto-parietal motor control systems on the primary motor network following stroke. NeuroImage. 2012; 59(1): 227-237.
- Jiang L, Liu J, Wang C, et al. Structural Alterations in Chronic Capsular versus Pontine Stroke. Radiology. 2017; 285(1): 214-222.
Figures
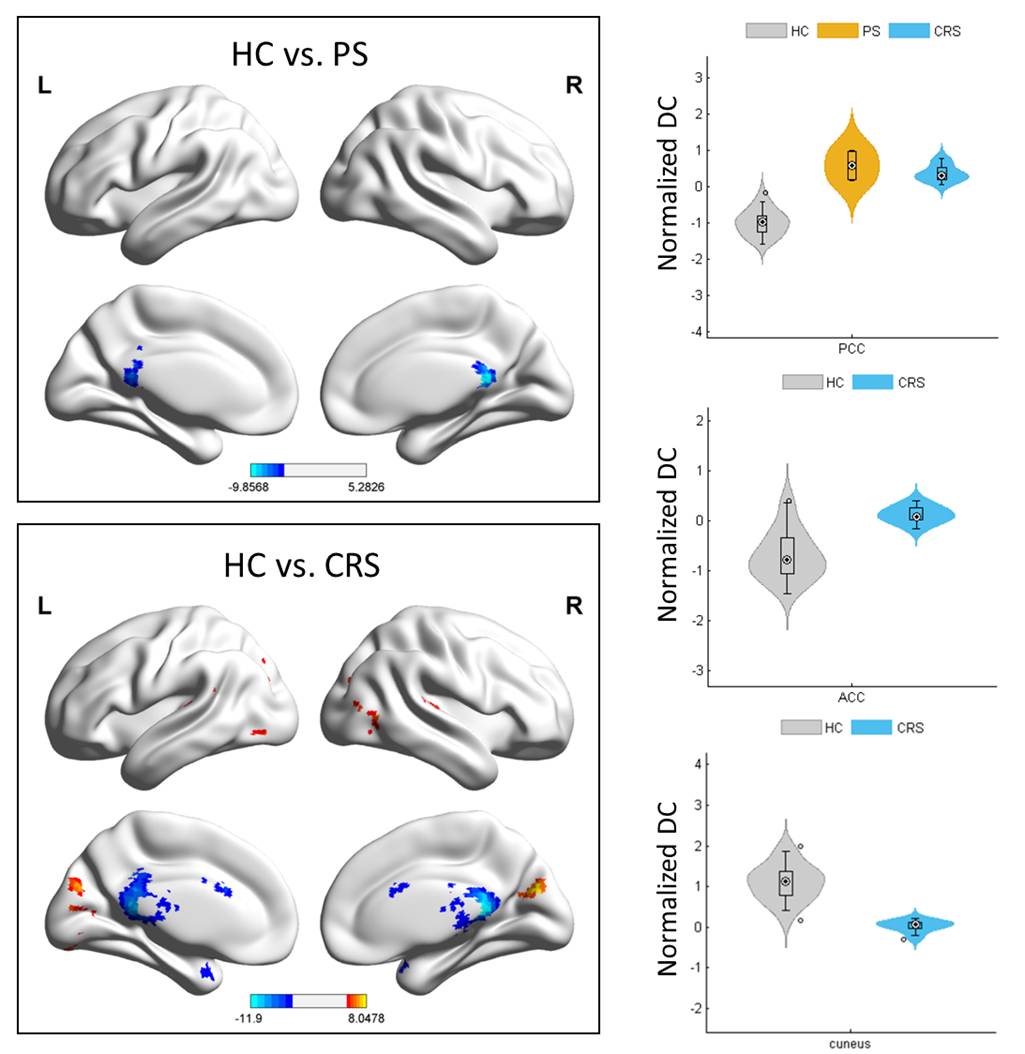
Fig.1 DC differences between PS, CRS and HC groups. Left column shows the
brain regions with significant differences between HC and PS group (Top), HC
and CRS group (Bottom). Color bar denotes t value. The right column shows the
distribution of normalized DC in statistically significant clusters in each
group (Top: PCC, Middle: ACC, Bottom: Cuneus. P<0.001, FDR corrected). PCC –
posterior cingulate cortex, ACC – anterior cingulate cortex
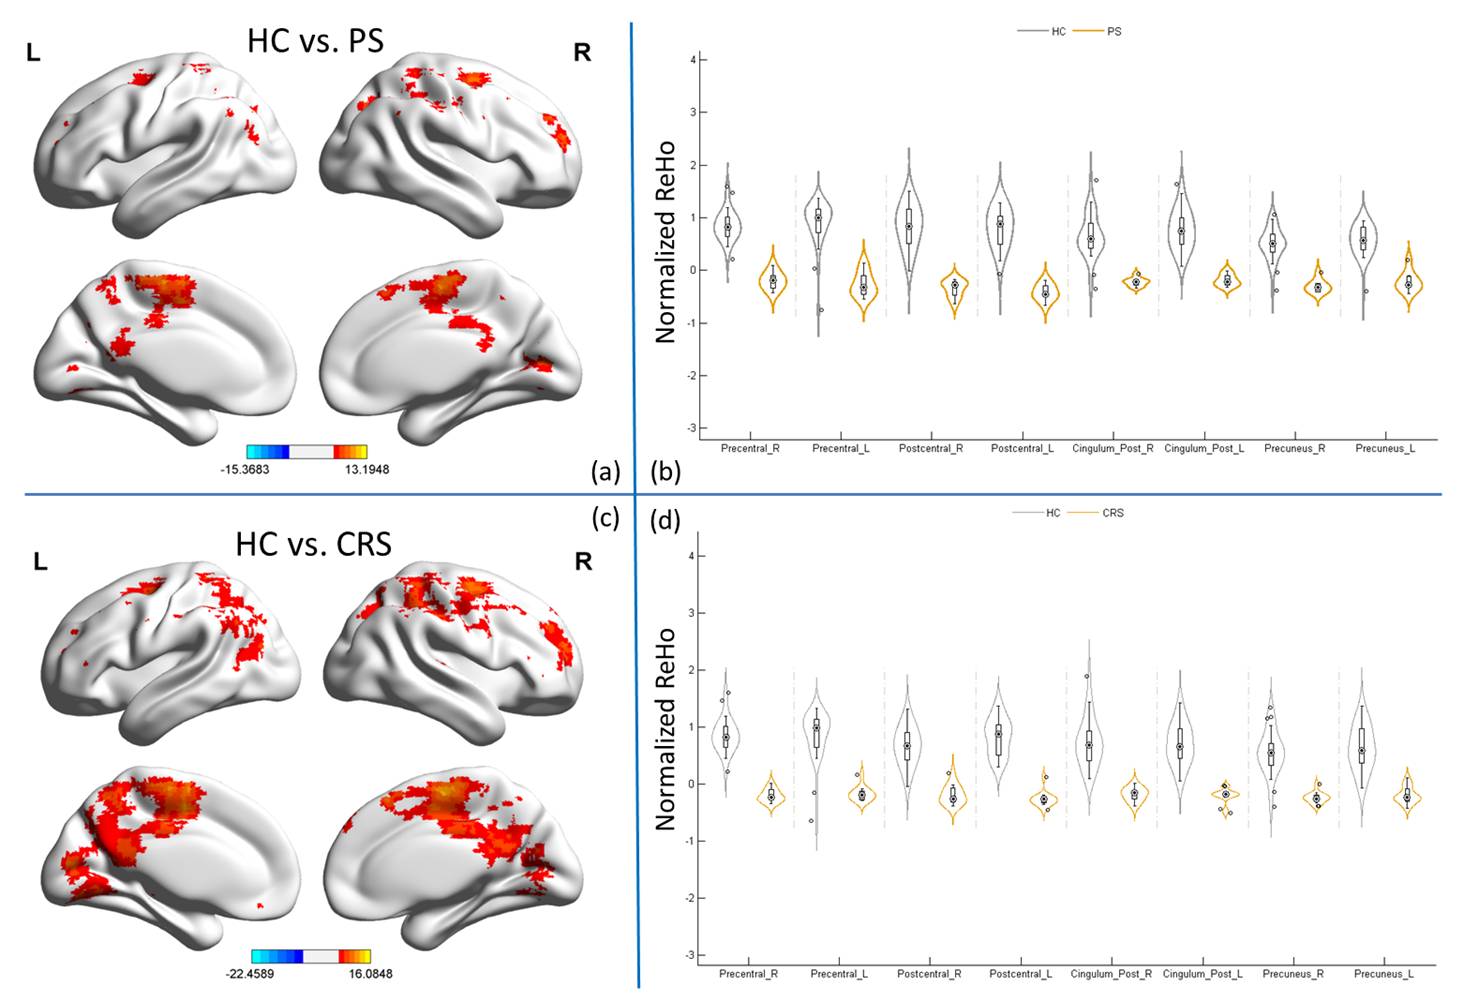
Fig. 2 ReHo differences between PS, CRS and HC groups. (a) and (c) shows the the brain regions with significant differences between PS, CRS group with HC group respectively. And ReHo distribution in bilateral precentral gyrus, postcentral gyrus, posterior cingulate cortex and precuneus showed in (b) and (d) accordingly. Color bar denotes t value(P<0.0001, FDR corrected).