2348
Resting-state fMRI predicts somatosensory-evoked BOLD fMRI in anesthetized mice1Center for Neuroscience Imaging Research (CNIR), Institute for Basic Science (IBS), Suwon, Republic of Korea, 2Department of Health Sciences and Technology (SAIHST), Sungkyunkwan University (SKKU), Seoul, Republic of Korea, 3Department of Biomedical Engineering (BME), Sungkyunkwan University (SKKU), Suwon, Republic of Korea
Synopsis
BOLD fMRI in rodents has been used to investigate brain functions in normal and diseased conditions. Until now, most animal fMRI have used anesthetics to reduce animal stress and minimize motions. Because anesthesia affects neurovascular coupling, maintaining the proper physiological condition under anesthesia is important. However, it is challenging in mice due to the limitation of physiological monitoring and high sensitivity to anesthetics used. Here we introduced ketamine and xylazine anesthesia in mice. Then, to examine the variability of fMRI response and indirectly measure the physiological condition, we use the resting state fMRI (RS-fMRI), which detects intrinsic brain state and connectivity.
Introduction
Functional magnetic resonance imaging (fMRI) in mice will provide mapping of cell-type specific neural circuits and functions of transgenic mouse models. In anesthetized mice, it is difficult to assess the level of anesthesia due to limited vascular physiological measurements inside the magnet bore. To overcome this issue, we propose to use resting state fMRI (RS-fMRI), which detects the spontaneous brain activity, as an indirect measure of anesthesia depth.1,2 In this study, we examined whether RS-fMRI in mice can predict BOLD-fMRI response under ketamine-xylazine anesthesia.Method
Animal Preparation
Ten male C57BL/6 mice (23 to 30 g) were used for fMRI experiments. Mice were initially anesthetized with a mixture of ketamine and xylazine (100 mg/kg and 10 mg/kg, respectively, IP). To maintain the anesthesia condition, supplementary anesthesia (25 mg/kg and 1.25 mg/kg, respectively) was intermittently administrated based on heart rate and motion-sensitive signal changes.3 Body temperature was maintained at 37±0.5°C. To reduce the head motion artifacts, the head was carefully fixed with earplugs and a tooth bar.
Functional Imaging Data Acquisition
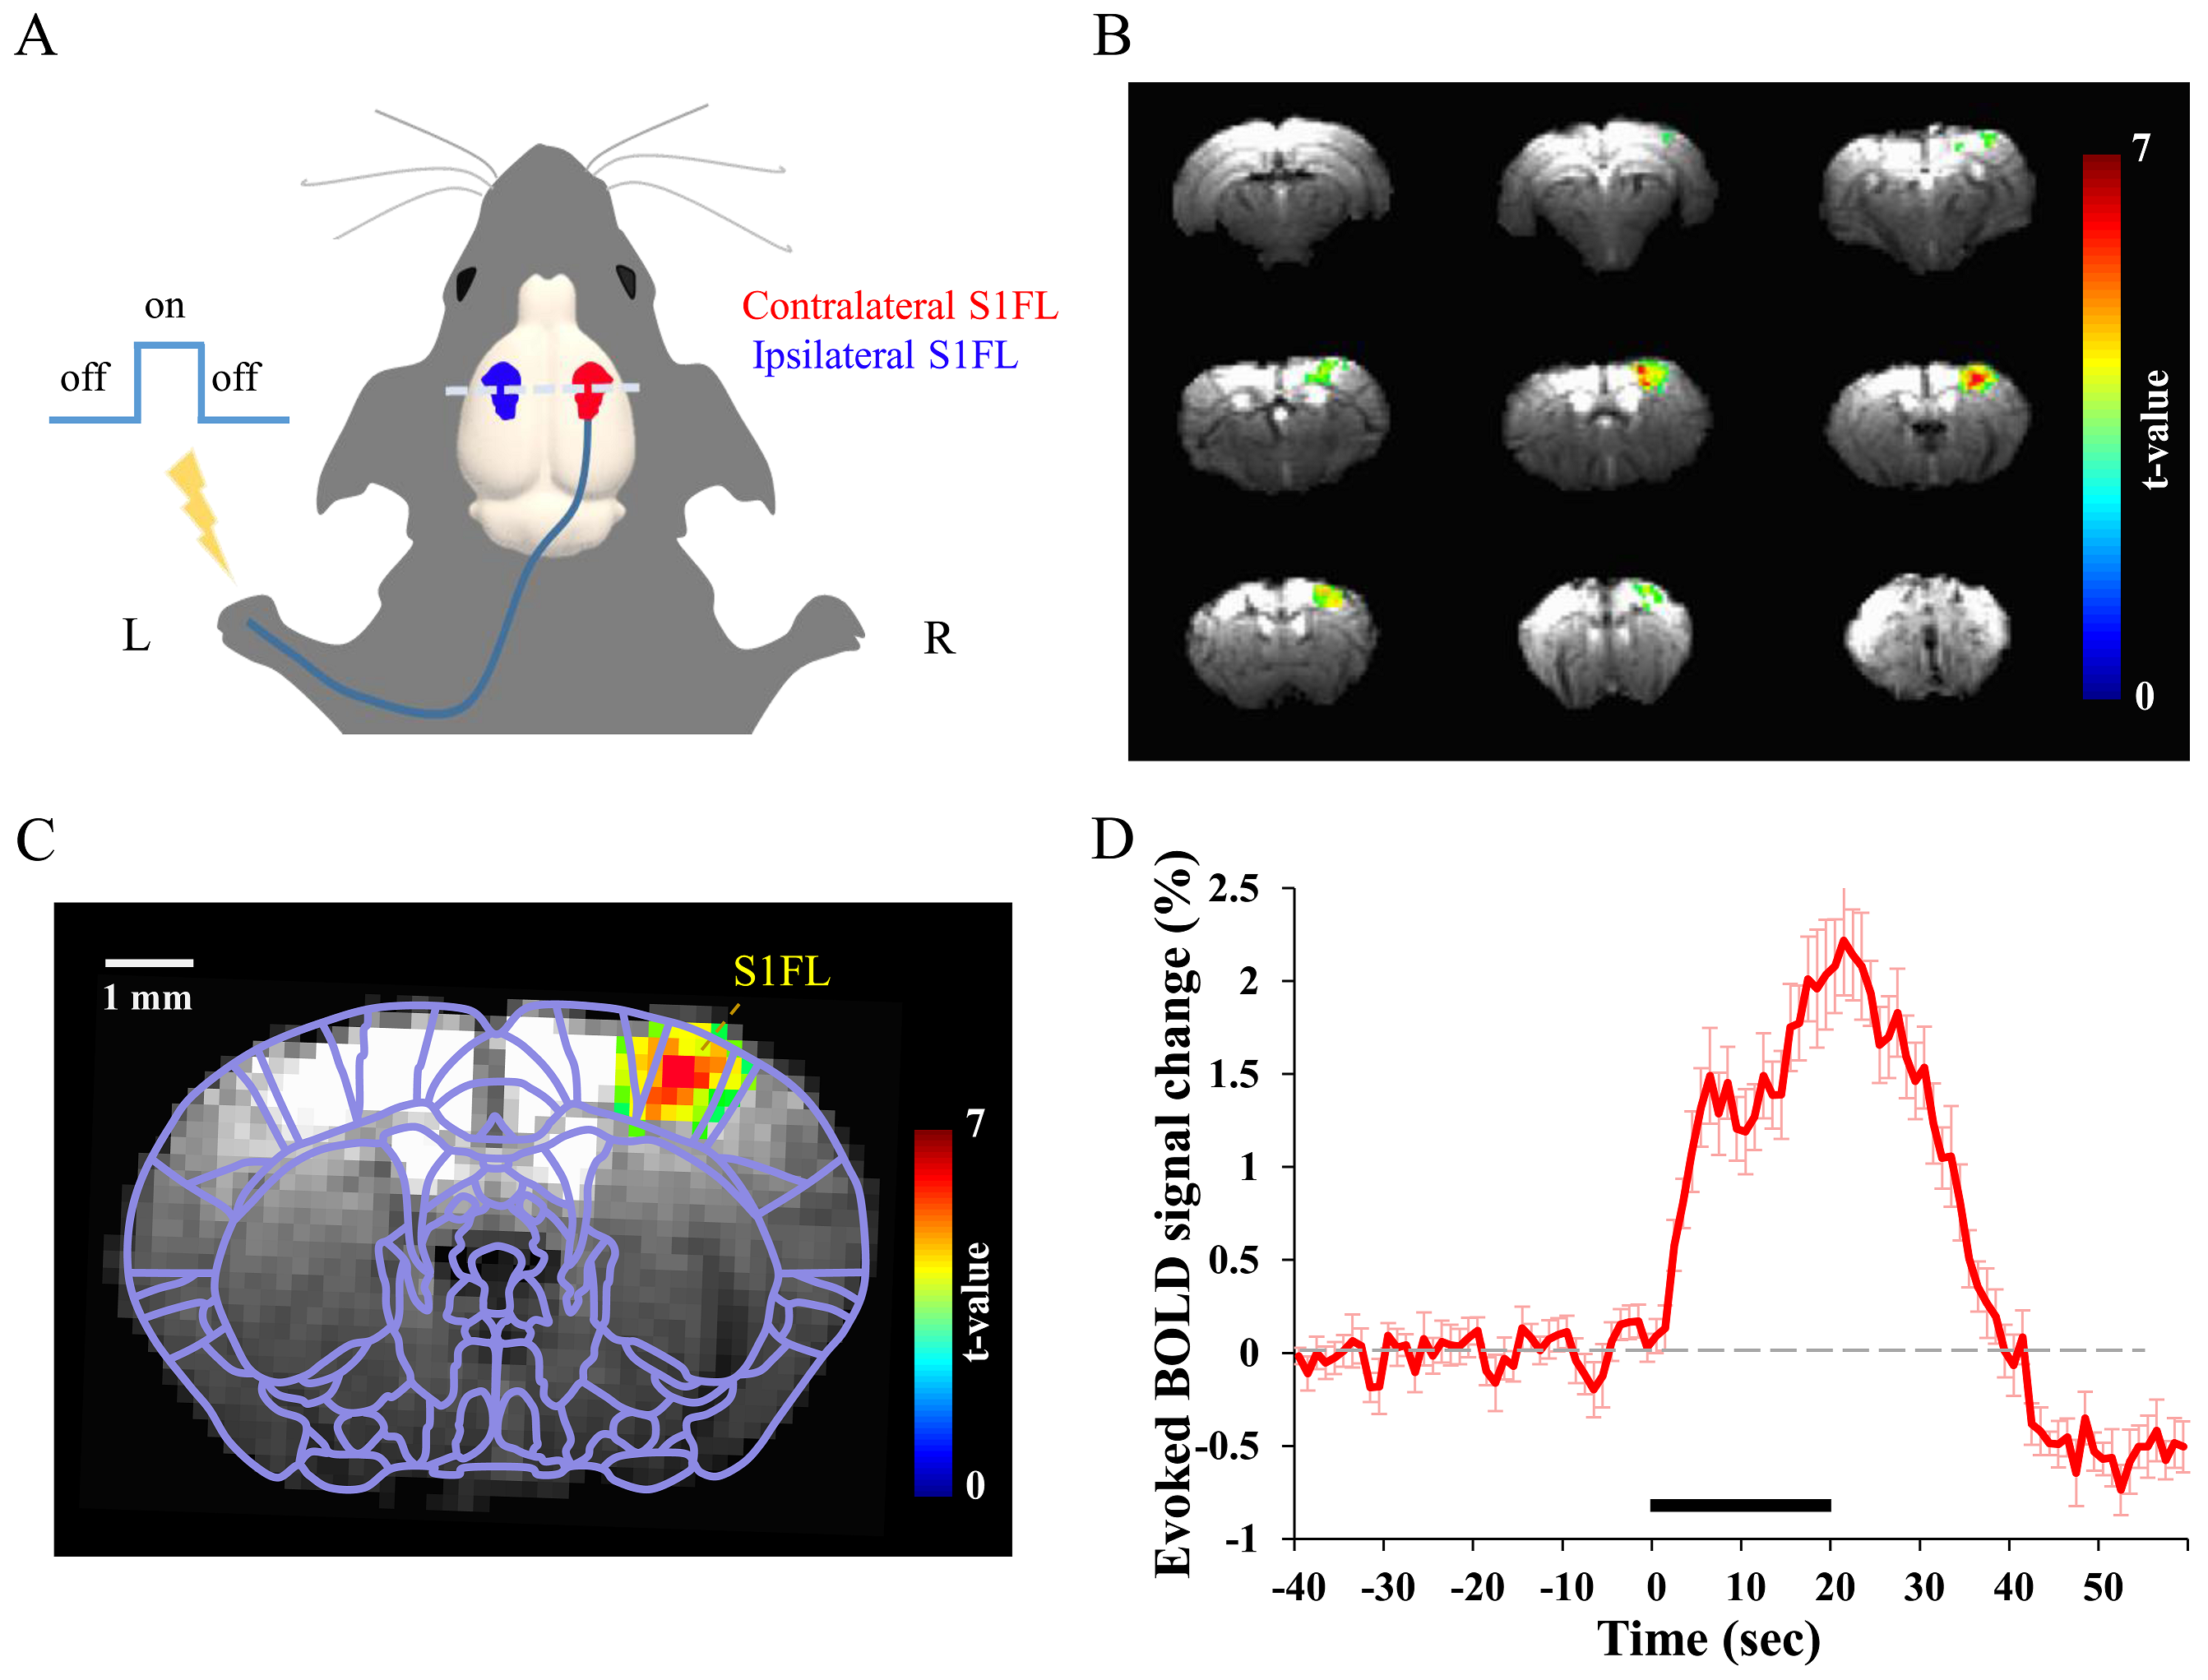
All 20 fMRI studies (5 out of 10 mice repeated experiment twice) were performed on a 9.4 T MRI (Bruker BioSpec MR system). In each animal, 2-4 imaging sessions were obtained. A session was defined as the period between two consecutive anesthetic injections. Within each session, one RS-fMRI was acquired for 5 min, and followed by multiple evoked fMRI (3-5 trials) responding to 20 s single forepaw stimulation at 4 Hz with 0.5 ms pulse duration and 0.5 mA current. BOLD-fMRI was performed using a single-shot GE EPI sequence with following parameters: TR/TE = 1000/16 ms, flip angle = 60°, in-plane resolution = 188×188 µm2, slice thickness = 0.5 mm, contiguous 9 coronal slices without gap. One hundred and 300 volumes were acquired for evoked and resting state fMRI, respectively.
Data Processing
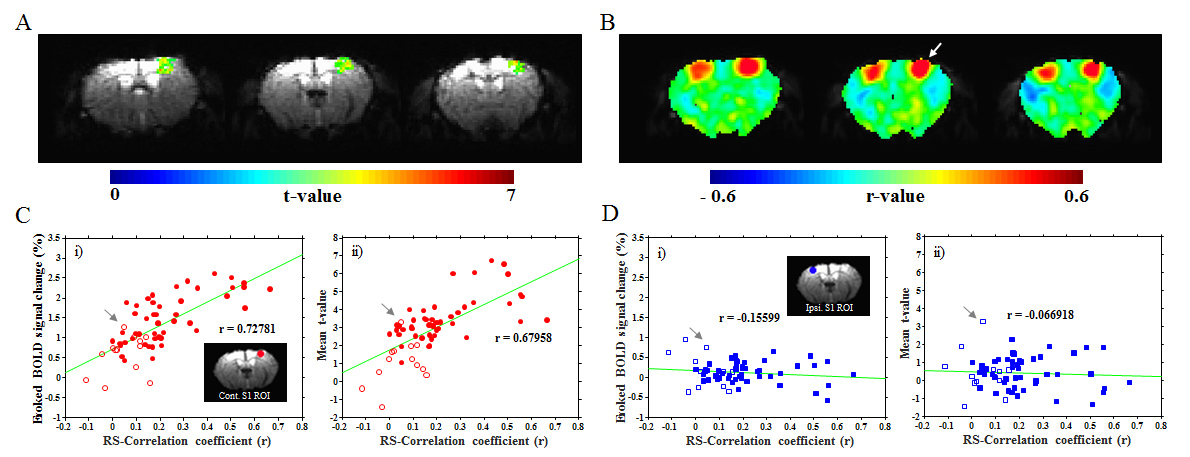
BOLD fMRI was processed with the AFNI package and Matlab codes. For each imaging session, one activation map was calculated with preprocessing and standard GLM analyses. The preprocessing include: slice timing correction, image realignment for motion correction, temporal detrending, temporal normalization from baseline and trial averaging within the same imaging session. To generate statistical t-value maps, GLM was applied with the boxcar reference function. Voxels passing the threshold of t-value >3 and cluster >4 were considered to be statistically significant. In order to determine relationship between evoked fMRI and RS-fMRI, a spherical ROI was selected as a 500 µm radius region. Within the ROI, the mean BOLD percent change was calculated as a mean of signal changes within 10 to 20 s and mean t-value was obtained by averaging data of all 23 voxels. For RS-fMRI data, additional steps were performed: band-pass filtering (0.01 < f < 0.2 Hz) and spatial smoothing using a Gaussian kernel with a 0.6 mm FWHM. The contralateral ROI was used as seed, and cross-correlation coefficients were calculated on a pixel-by-pixel basis.
Results
The BOLD fMRI activity was well-localized on the contralateral primary somatosensory forelimb region (S1FL) contralateral to the stimulated forepaw (Fig. 1). No noticeable signal change was observed in the ipsilateral S1. The BOLD response had the initial peak within 10 s after the onset of stimulus and then gradually increased to the second peak near the end of the stimulus (20-22 s). In fMRI experiments, 13 sessions among total 61 sessions in 10 mice, weak or no activation was observed in S1. This variance can be related to the animal’s anesthesia condition associated with intermittent bolus injections. The RS-fMRI correlation coefficient between bilateral S1 ROIs was compared with evoked BOLD-fMRI response (Fig. 2A vs. B). Figure 2C shows correlation between evoked fMRI and RS-fMRI. Strong positive correlation was observed between contralateral S1 activity and bilateral resting state connectivity (Fig. 2C), while the ipsilateral S1 activity was close to zero (Fig. 2D).Discussion and Conclusion
Our study demonstrated that the robust and well localized contralateral S1FL activation can be detected at mouse fMRI using ketamine and xylazine anesthesia. In total 61 sessions, most unclear BOLD responses were concentrated in early sessions. This may be caused by deep anesthesia level for initial experimental preparation. Under the anesthesia, proper physiological condition and basal brain state are critical to achieve the adequate sensory response. Our data clearly shows that the higher bilateral connectivity correlated well with the larger evoked BOLD response, suggesting that RS-fMRI provides an excellent index of brain status under anesthesia.Acknowledgements
This work was supported by IBS-R015-D1.References
1. Nasrallah F.A., Tay HC, Chuang KH. Detection of functional connectivity in the resting mouse brain. NeuroImage. 2014;86:417-424
2. Grandgean J, Schroeter A, Batata I, et al. Optimization of anesthesia for resting-state fMRI in mice based on differential effects of anesthetics on functional connectivity patterns. NeuroImage. 2014;102:838-847
3. Jaber S.M., Hankenson F.C., Heng K, et al. Dose Regimens, Variability, and Complications Associated with Using Repeat-Bolus Dosing to Extend a Surgical Plane of Anesthesia in Laboratory Mice. Journal of the American Association for Laboratory Animal Science. 2014;53(6):684-691
Figures