2346
Asymmetric Functional Connectivity in Major Depressive Disorder Revealed by Ultra-high Field Resting-state fMRI1Bioimaging Research Team, Division of Bioconvergence Analysis, Korea Basic Science Institute, Ochang Center, Cheongju, Korea, Democratic People's Republic of, 2Department of Psychology, Brain Research Institute, Chungnam National University, Daejeon, Korea, Democratic People's Republic of, 3Department of Bio-Analytical Science, University of Science and Technology, Cheongju, Korea, Democratic People's Republic of
Synopsis
The purpose of the study is that the investigation of resting-state functional magnetic resonance imaging (MRI) with 7T MRI via seed-based correlation analysis is examined the significant difference of the whole-brain functional connectivity among major depressive disorder (MDD) patients and healthy subjects. The results showed that MDD had higher correlations compared with healthy group. Furthermore, MDD exhibited lateralization of connected regions, including the lateral occipital cortex, inferior temporal gyrus, angular gyrus, temporal fusiform cortex, occipital fusiform gyrus, and lingual gyrus, mainly located in the left hemisphere. These suggest that MDD is associated with disruptions in the asymmetric organization of brain.
INTRODUCTION
Using high field magnetic resonance imaging (MRI), neuroimaging studies have shown that major depressive disorder (MDD) is accompanied by structural and functional abnormalities in well-known regions. 1-3 However, there is little investigation about alterations of the resting-state functional connectivity (FC) in the whole-brain regions in MDD patients using ultra-high field (UHF) MR system such as 7T MRI. The aim of the study is to examine the significant difference of the whole-brain FC network among MDD patients and healthy subjects in resting-state functional MRI (fMRI) with 7T MRI via seed-based correlation analysis.METHODS
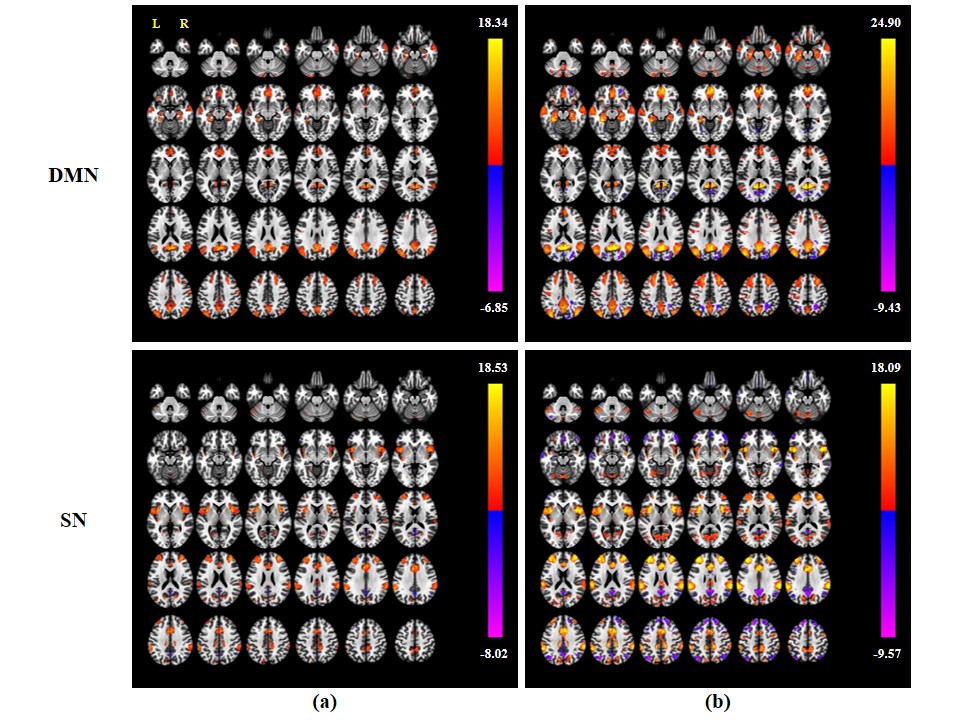
A total number of 44 subjects were recruited, including 16 MDD patients and 28 healthy subjects. All subjects were same gender (female) and the age of both groups ranged from 20 to 30 years. The study protocol was approved by the local institutional review board (IRB) and written informed consent was obtained from all participants. All subjects underwent a resting-state fMRI scan using a 7T MR system (Achieva, Philips Medical Systems, Milwaukee, WI) with a 32-channel phased array head coil. During the scan, participants were instructed to keep their eyes open and focus on a white fixation cross in the center on a black background. MR images sensitized to changes in blood oxygen level-dependent (BOLD) signal levels were obtained by a gradient-echo (GRE) echo-planar imaging (EPI) sequence with MR parameters (repetition time (TR)/echo time (TE) = 2000 ms/17 ms and flip angle (FA) = 70°). The imaging slice thickness was 3.5 mm (no slice gap), with a matrix size of 128 × 128 and a field of view (FOV) of 192 × 192 mm2, resulting in a spatial resolution (voxel size) of 1.5 × 1.5 × 3.5 mm3. Each volume comprised 32 oblique slices positioned parallel to the anterior commissure (AC)–posterior commissure (PC) line, and each run contained 200 volumes. The scan lasted for 6 minutes and 40 seconds. The preprocessing for FC analysis was performed using the SPM 12 software and the CONN (version 17e) FC toolbox. CONN based on SPM was used to calculate the strength and significance of bivariate correlation among region of interest (ROI) pairs within all subjects’ data. First, to calculate FC between the specific seed and all voxels and reconstruct the seed-to-voxel map, we selected two networks including default mode network (DMN) and salience network (SN) which is related to MDD or depression. DMN included medial PFC (MPFC), posterior cingulate cortex (PCC), and right and left lateral parietal cortex (LPC); SN included anterior cingulate cortex (ACC). The height threshold was applied at uncorrected P < 0.001 in the seed-to-voxel maps in each group. Second, ROI-to-ROI FC was computed in the whole-brain to show the correlation between all ROI seeds to analyze the global characteristics of human brain in both MDD patient and healthy subject groups. False discovery rate (FDR)-corrected P < 0.05 was used for all the group analyses.RESULTS
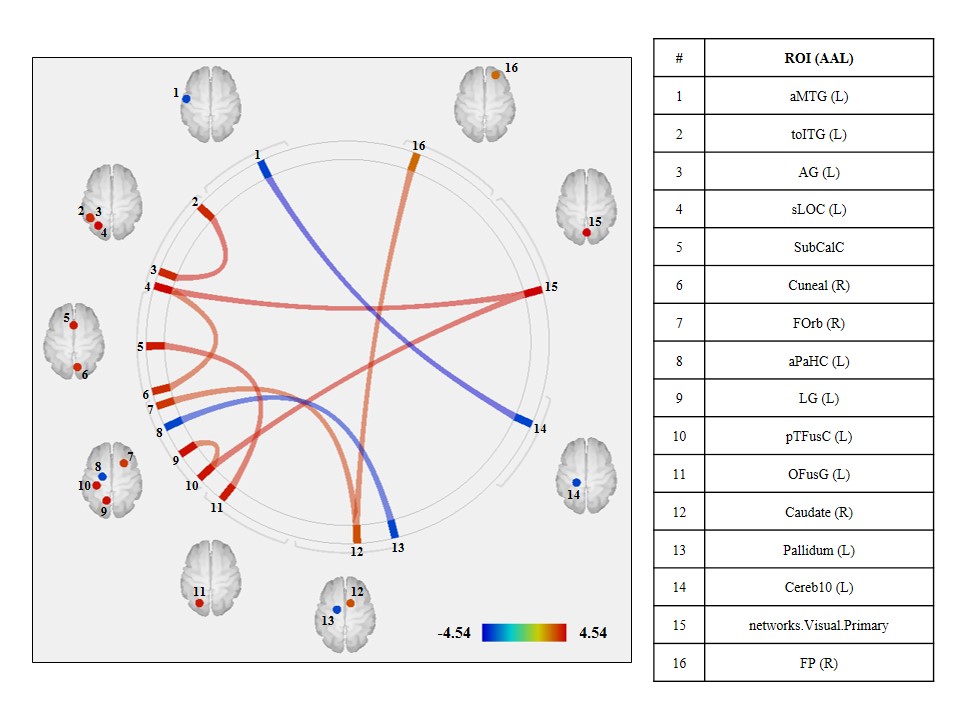
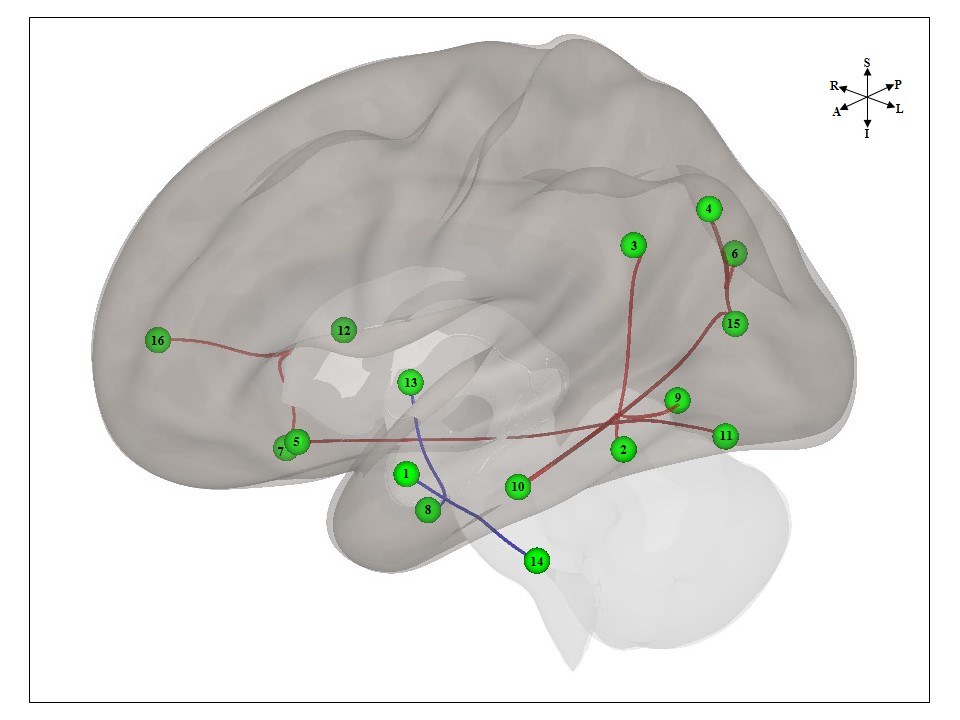
The seed-to-voxel maps of the DMN and SN showed no significant difference between MDD patients and healthy subjects in the Figure 1. On the other hand, in the functional connectome ring from the ROI-to-ROI analysis with all selected ROI seeds in both groups (Figure 2), 12 nodes (regions) and 8 links (connections) existed in a “MDD > Healthy” group contrast (red lines); only 4 nodes and 2 links existed in a “Healthy > MDD” group contrast (blue lines) with FDR P < 0.05 threshold level. Figure 3 represented that 10 of all 16 nodes (green circles) mainly were located in the left hemisphere in the human brain in the 3-dimensional (3D) rendering FC map.DISCUSSION
The results showed that compared with healthy subjects, MDD patients showed higher functional connections in the whole-brain ROIs. Furthermore, MDD patients exhibited lateralization of functional connected ROIs, including the lateral occipital cortex, inferior temporal gyrus, angular gyrus, temporal fusiform cortex, occipital fusiform gyrus, and lingual gyrus, predominantly located in the left hemisphere. We suggest that MDD is associated with disruptions in the asymmetric organization of functional brain network and provide the additional evidence concerning the pathophysiological mechanisms of MDD.CONCLUSION
Using UHF MR system such as 7T MRI, we have examined functional correlations between whole-brain regions in MDD with resting-state fMRI, and the results showed more connections and asymmetric connectivity patterns in MDD patients than healthy subjects. It is possible to presume that resting-state fMRI with the UHF environment can be used as an alternative clinical tool in the near future.Acknowledgements
This research was supported by the Korea Basic Science Institute (KBSI) (T37800).References
1. de Kwaasteniet B, Ruhe E, Caan M, et al. Relation between structural and functional connectivity in major depressive disorder. Biol. Psychiatry. 2013;74:40-47.
2. Yang R, Gao C, Wu X, et. al. Decreased functional connectivity to posterior cingulate cortex in major depressive disorder. Psychiatry Research: Neuroimaging. 2016;255:15-23.
3. Zhang J, Wang J, Wu Q, et. al. Disrupted brain connectivity networks in drug-naive, first-episode major depressive disorder. Biol. Psychiatry. 2011;70:334-342.
Figures