2345
Altered Voxel-based Functional Connectivity Density of Default Mode Network in Chronic Insomnia: A resting-state fMRI study1Department of Radiology, People’s Hospital of Zhengzhou University, Zhengzhou, China, 2Department of Functional Imaging, Henan Key Laboratory for Medical Imaging of Neurological Diseases, Zhengzhou, China, 3Siemens Healthcare, Beijing, China, 4Siemens Healthcare, Erlangen, Germany, 5Department of Neurology, People’s Hospital of Zhengzhou University, Zhengzhou, China, 6Health Management Center, People’s Hospital of Zhengzhou University, Zhengzhou, China
Synopsis
This study aimed to investigate the potentially altered functional connectivity (FC) of the default-mode network (DMN) in chronic insomnia disorder (CID) patients. A voxel-based functional connectivity density (FCD) analysis method was applied to identify abnormal FC among 44 CID patients and 31 healthy controls. A seed-based FC analysis and independent component analysis were also employed and compared. CID patients showed increased FCD in the right medial temporal gyrus (MTG), including long and short distance connections. Our results suggest that hyperarousal of the DMN may be related to increased FCD of the right MTG. Furthermore, the altered connectivity within or outside the DMN may further contribute to cognitive, emotional, and memory impairment.
Introduction
The mechanisms responsible for the pathophysiology and maintenance of chronic insomnia disorder (CID) remain largely unknown and have attracted much attention [1]. Previous structural and functional neuroimaging studies have suggested dysfunction in the default-mode network (DMN) of CID patients [2]. But a more appropriate and accurate functional connectivity (FC) analysis method is needed to address the disruption of DMN connectivity in CID. We used the voxel-based functional connectivity density (FCD) analysis method to investigate the potentially altered FC of DMN in CID patients [3]. We then investigated which specific connections to other regions most strongly contributed to disconnections as revealed by FCD. Subsequently, overlap with network-based disconnection, as revealed by independent component analysis (ICA), was tested. Furthermore, we also investigated the relationships between group differences of FCD and individual clinical variables.Method
A total of 44 CID patients who met the Diagnostic and Statistical Manual of Mental Disorders, version 5 (DSM-V) diagnostic criteria, were recruited. Thirty-one age-, gender-, and education-matched healthy controls (HCs) were enrolled. Clinical data were obtained from all the subjects. All fMRI data were acquired on a MAGNETOM Prisma 3T MR scanner (Siemens Healthcare, Erlangen, Germany) with a 64-channel head-neck coil. The subjects were instructed to keep their eyes closed and think of nothing particularly, but to not fall asleep during the acquisition. Resting-state fMRI data were acquired using a prototypical simultaneous multi-slice echo planar imaging (SMS-EPI) sequence with the following parameters: TR = 1500 ms, TE = 30 ms, FOV = 224 mm x 224 mm; matrix size = 112×112, slices = 72, slice thickness = 2 mm, flip angle = 60°, and SMS factor = 4.
Image preprocessing was performed using MATLAB toolbox SPM8 (http://www.fil.ion.ucl.ac.uk/spm) and DPABI (http://rfmri.org/dpabi). The preprocessing steps included slice-timing, realign, normalize, smooth, detrend, regression (with and without global signal regression) [4], filter (0.01-0.08 Hz), and scrubbing. The FCD mappings were calculated through voxel-based whole-brain correlation analysis. With the abnormal FCD regions as seed points, we calculated the FC patterns of two groups. The DMN component was also recognized by ICA. One-sample and two-sample t-tests were used for the FC maps, which were calculated by different methods. The Monte Carlo simulation was used in this study for multiple comparisons, resulting in a corrected threshold of p < 0.01 (Alphasim-corrected, cluster size ≥ 40 voxels).
Results
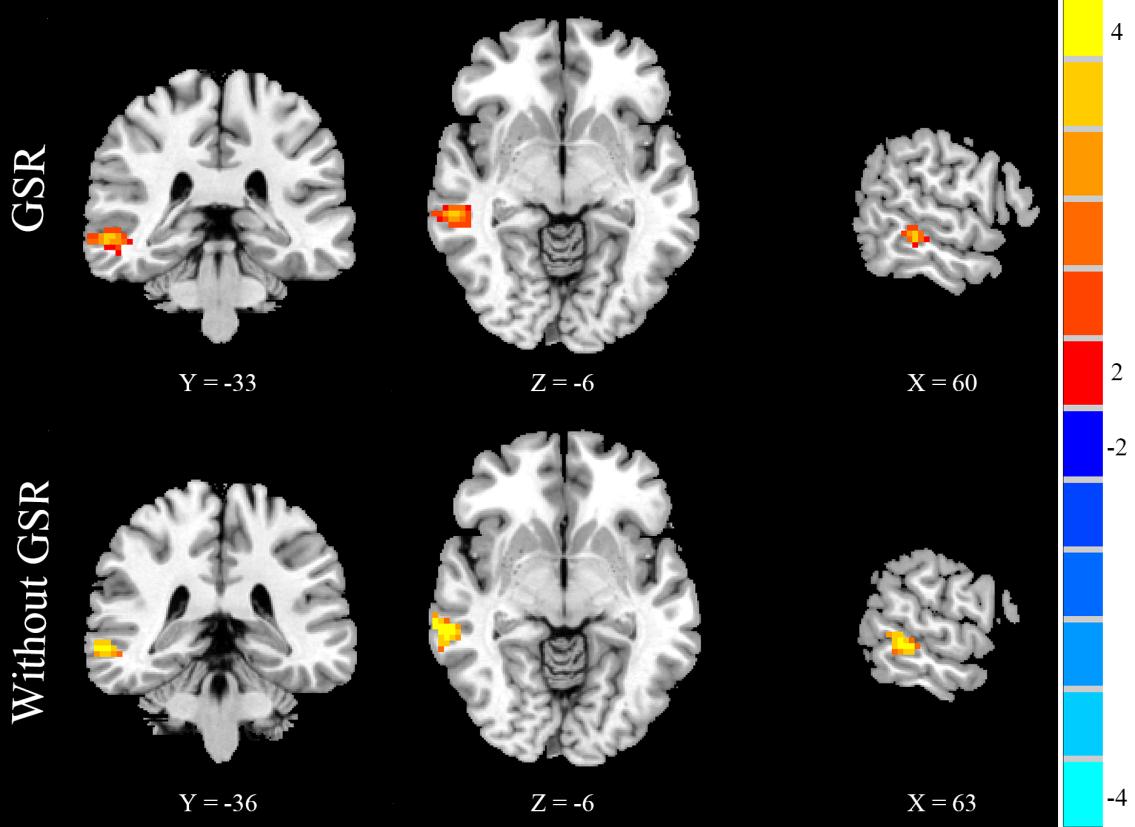
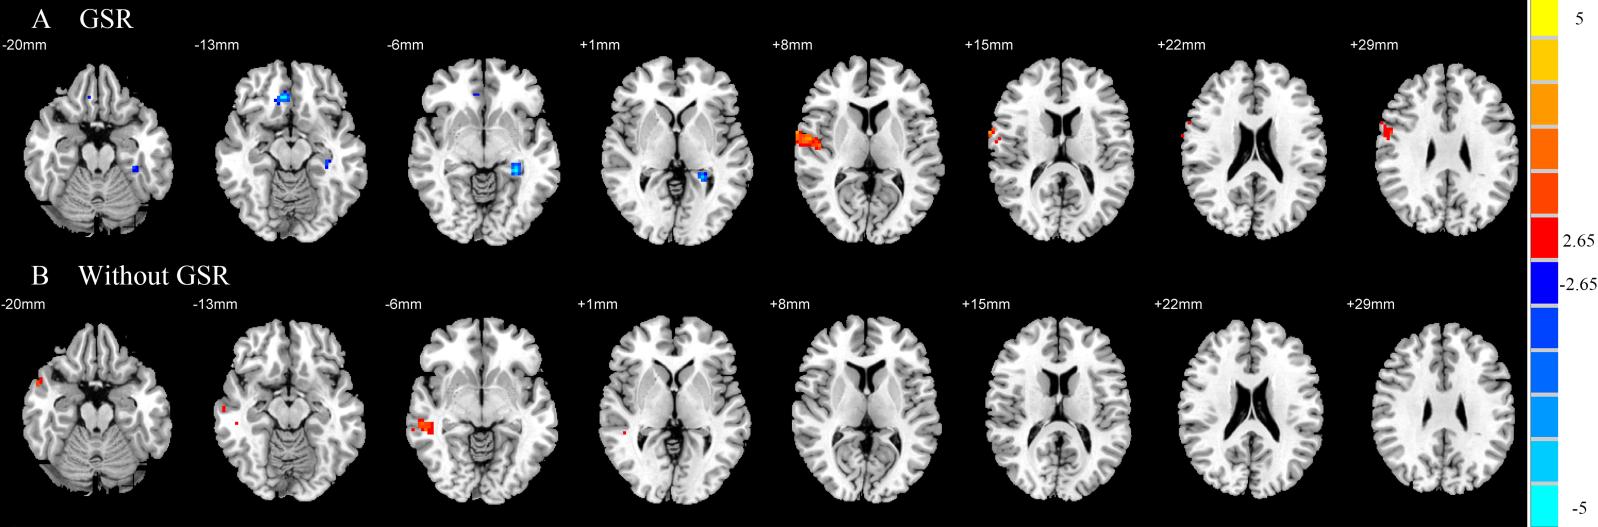
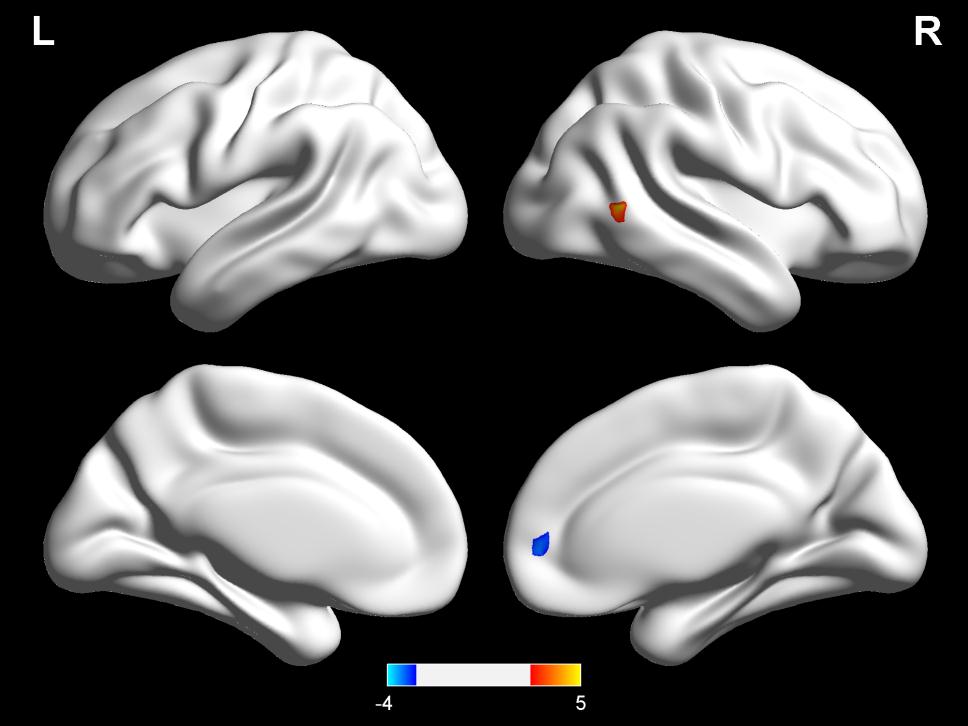
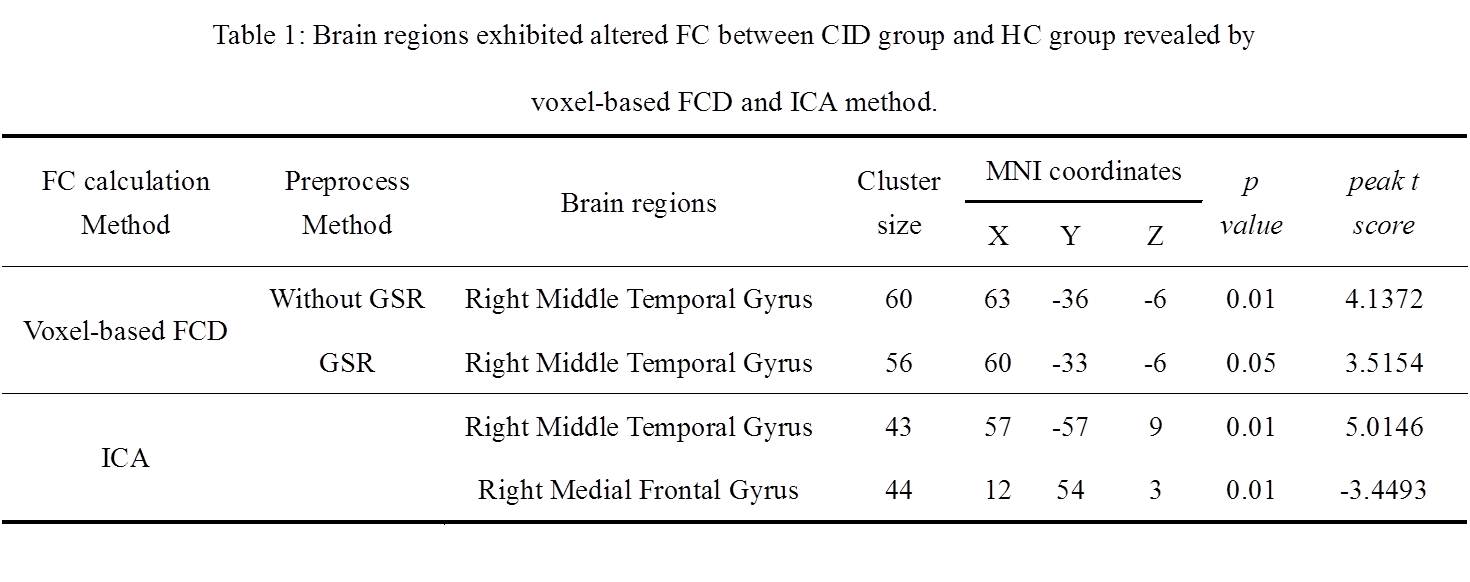
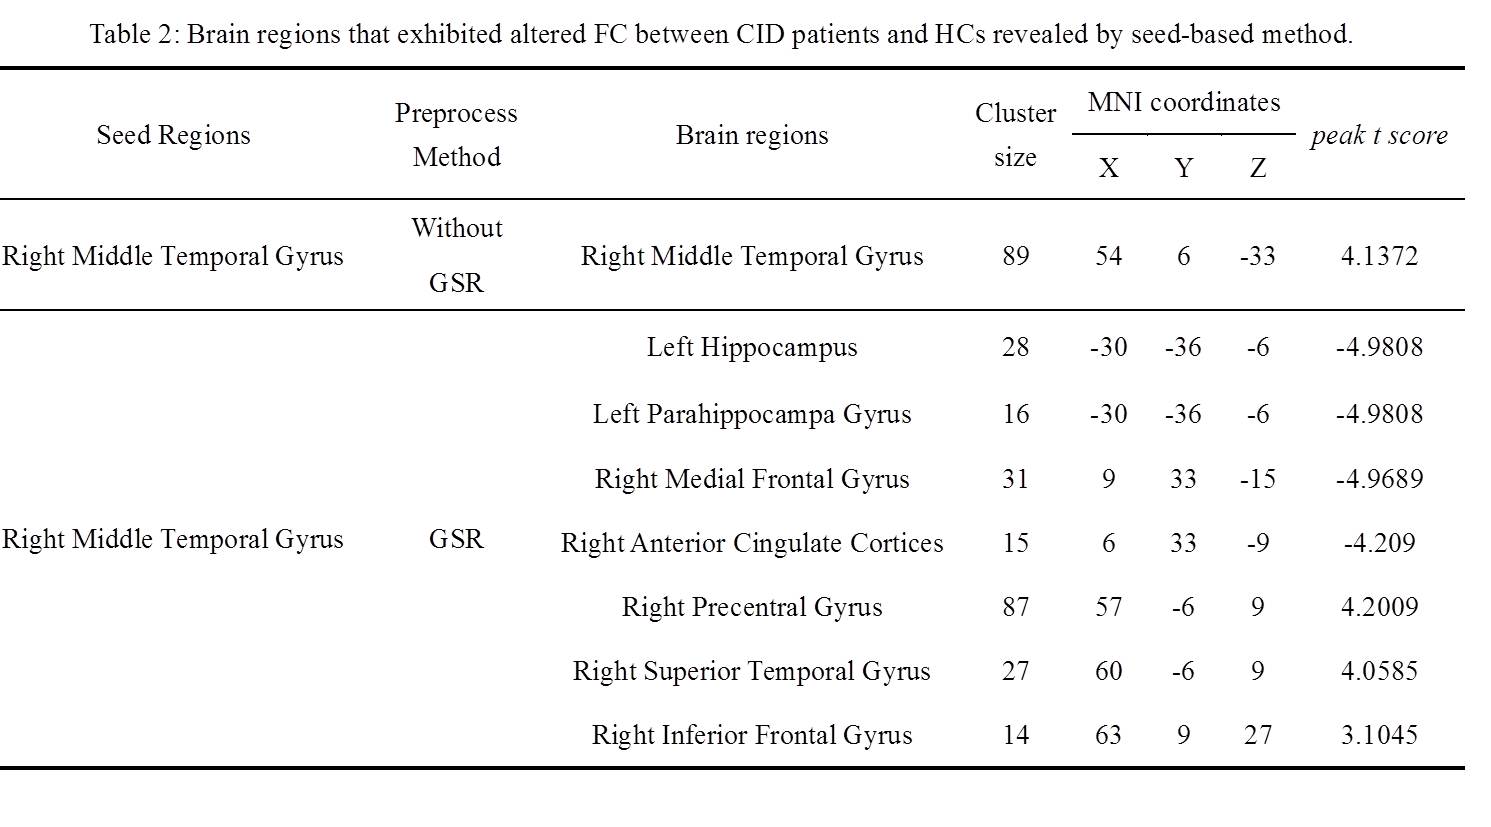
No significant differences were found in age, gender, or education between the CID patients and HCs. Compared with the HCs, the CID patients showed increased FCD in the right medial temporal gyrus (MTG) without the use of global signal regression (GSR) (p < 0.01, Figure 2) and with its use (p < 0.05, Figure 1, Table 1). With the abnormal right MTG regions as seed points, we showed that global alterations in the right MTG included both long- and short-distance connections (detailed results are shown in Figure 2 and Table 2). In addition, the abnormal region found by the FCD method shared significant overlap with the independent component analyses method (Figure 3).Discussion and Conclusions
Using the voxel-based FCD method, this study provides evidence for an altered FCD in the right MTG of the DMN in CID patients. The global alterations in the right MTG not only included decreased FC with regions inside the DMN but also included increased FC with regions outside the DMN. Our results suggest that hyperarousal of the DMN may be related to increased FCD of the right MTG [5]. Furthermore, the altered connectivity within or outside the DMN may further contribute to cognitive, emotional, and memory impairment, and reveal compensatory mechanisms to overcome the negative effects of poor sleep in CID patients.Acknowledgements
This work was supported by the National Key R&D Program of China under grant 2017YFB1002502 and the Natural Science Foundation of Henan Province (162300410285).References
1.Kay DB, Buysse DJ. Hyperarousal and Beyond: New Insights to the Pathophysiology of Insomnia Disorder through Functional Neuroimaging Studies. Brain Sciences 2017;7(3):23.
2.Marques DR et al. Default-mode network activity and its role in comprehension and management of psychophysiological insomnia: A new perspective. New Ideas in Psychology 2015;36:30-37.
3.Tomasi D, Volkow ND. Functional connectivity density mapping. Proceedings of the National Academy of Sciences 2010;107(21):9885-9890.
4.Murphy K, Fox MD. Towards a consensus regarding global signal regression for resting state functional connectivity MRI. Neuroimage 2017;154:169-173.
5.Nofzinger EA et al. Functional neuroimaging evidence for hyperarousal in insomnia. American Journal of Psychiatry 2004;161(11):2126-2128.
Figures