2339
Mapping drug resistant epilepsy with MREG signal coefficient of variance.1OFNI/Radiology, Oulu University Hospital, Oulu, Finland, 2Neurology, Oulu University Hospital, Oulu, Finland
Synopsis
In the absence of detectable epileptiform activity, even combined EEG-fMRI scanning may fail to detect the epileptic foci. We utilize a novel measure of BOLD signal stability, the coefficient of variance (CV), with ultra-fast fMRI sequence MREG in drug resistant epilepsy (DRE). We detect a robust increase of MREG CV in patients with in white matter, brainstem and cerebellum in DRE at group level. Importantly, thresholding the CV +3 std above mean enables individual level mapping of epileptic abnormality in DRE patients.
Introduction
Ultra-fast 10 Hz whole brain magnetic resonance encephalography (MREG), enables precise detection of epileptic spike activity1,2. In this study we estimate if MREG signal noise stability, measured by coefficient of signal variance (CV)3, could detect abnormal interictal activity in drug resistant epilepsy (DRE) patients. Previously the CV method is used for fMRI BOLD data to find altered values in different diseases3,4,5.
Methods
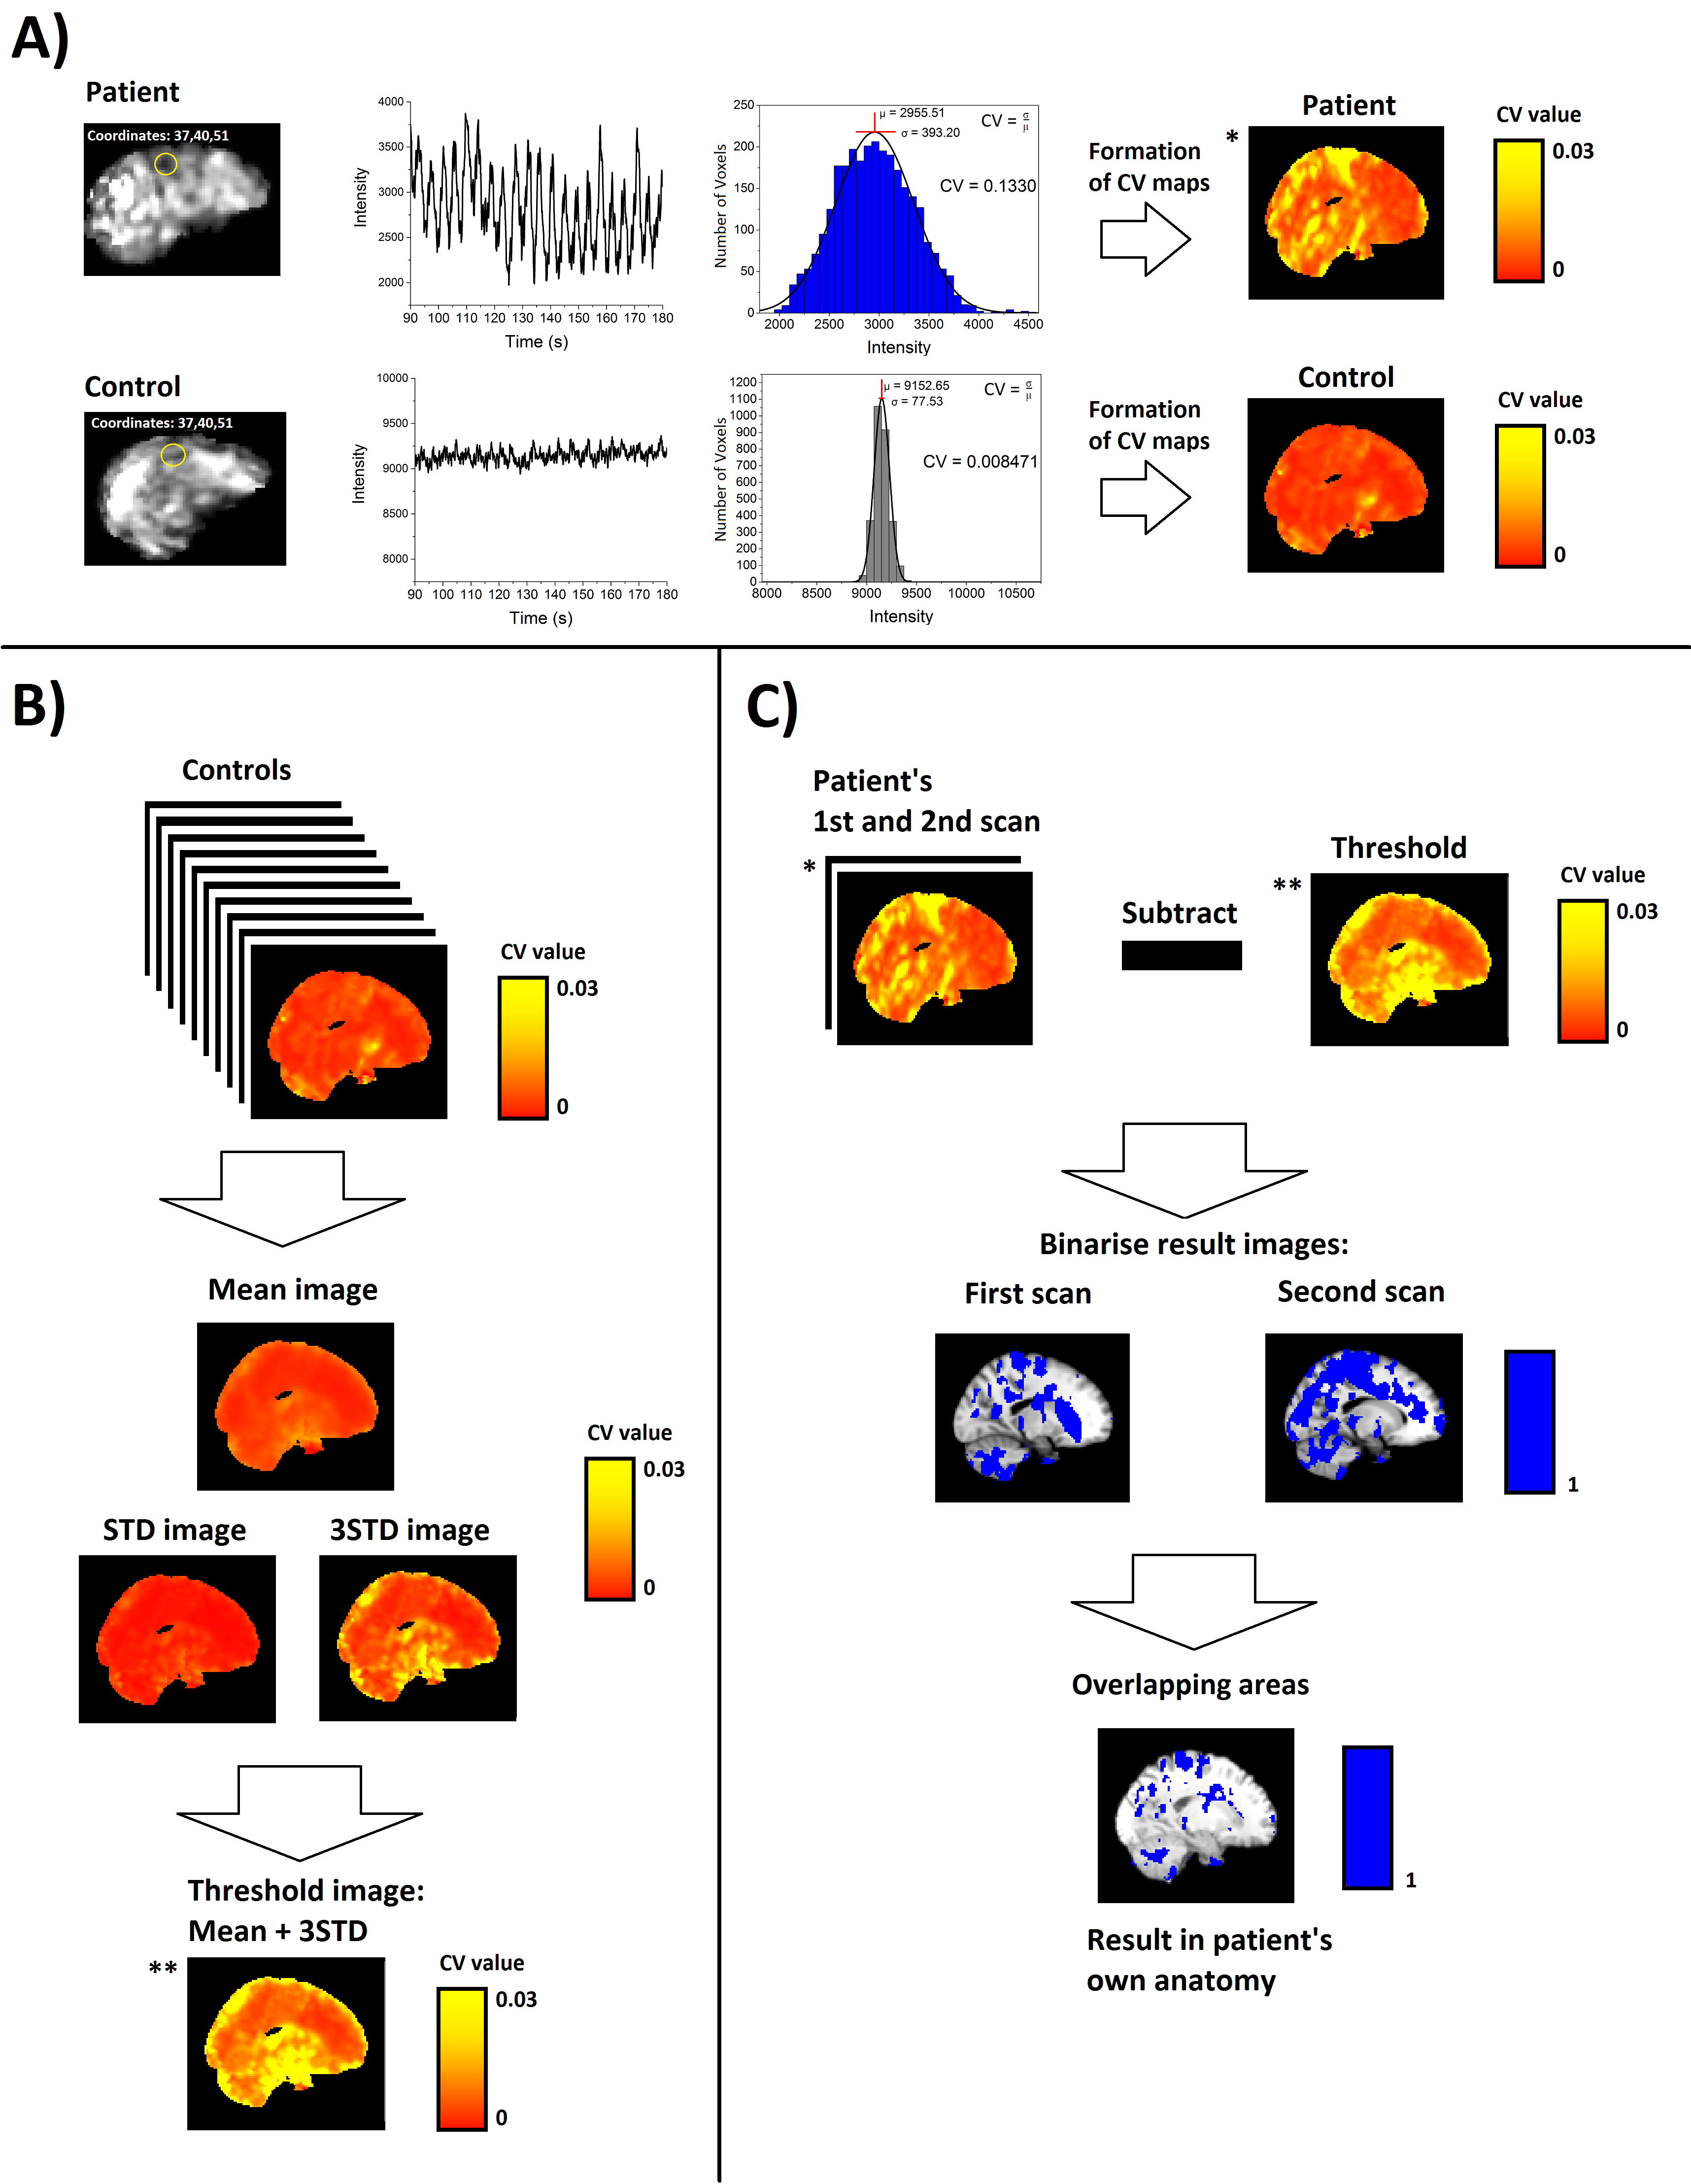
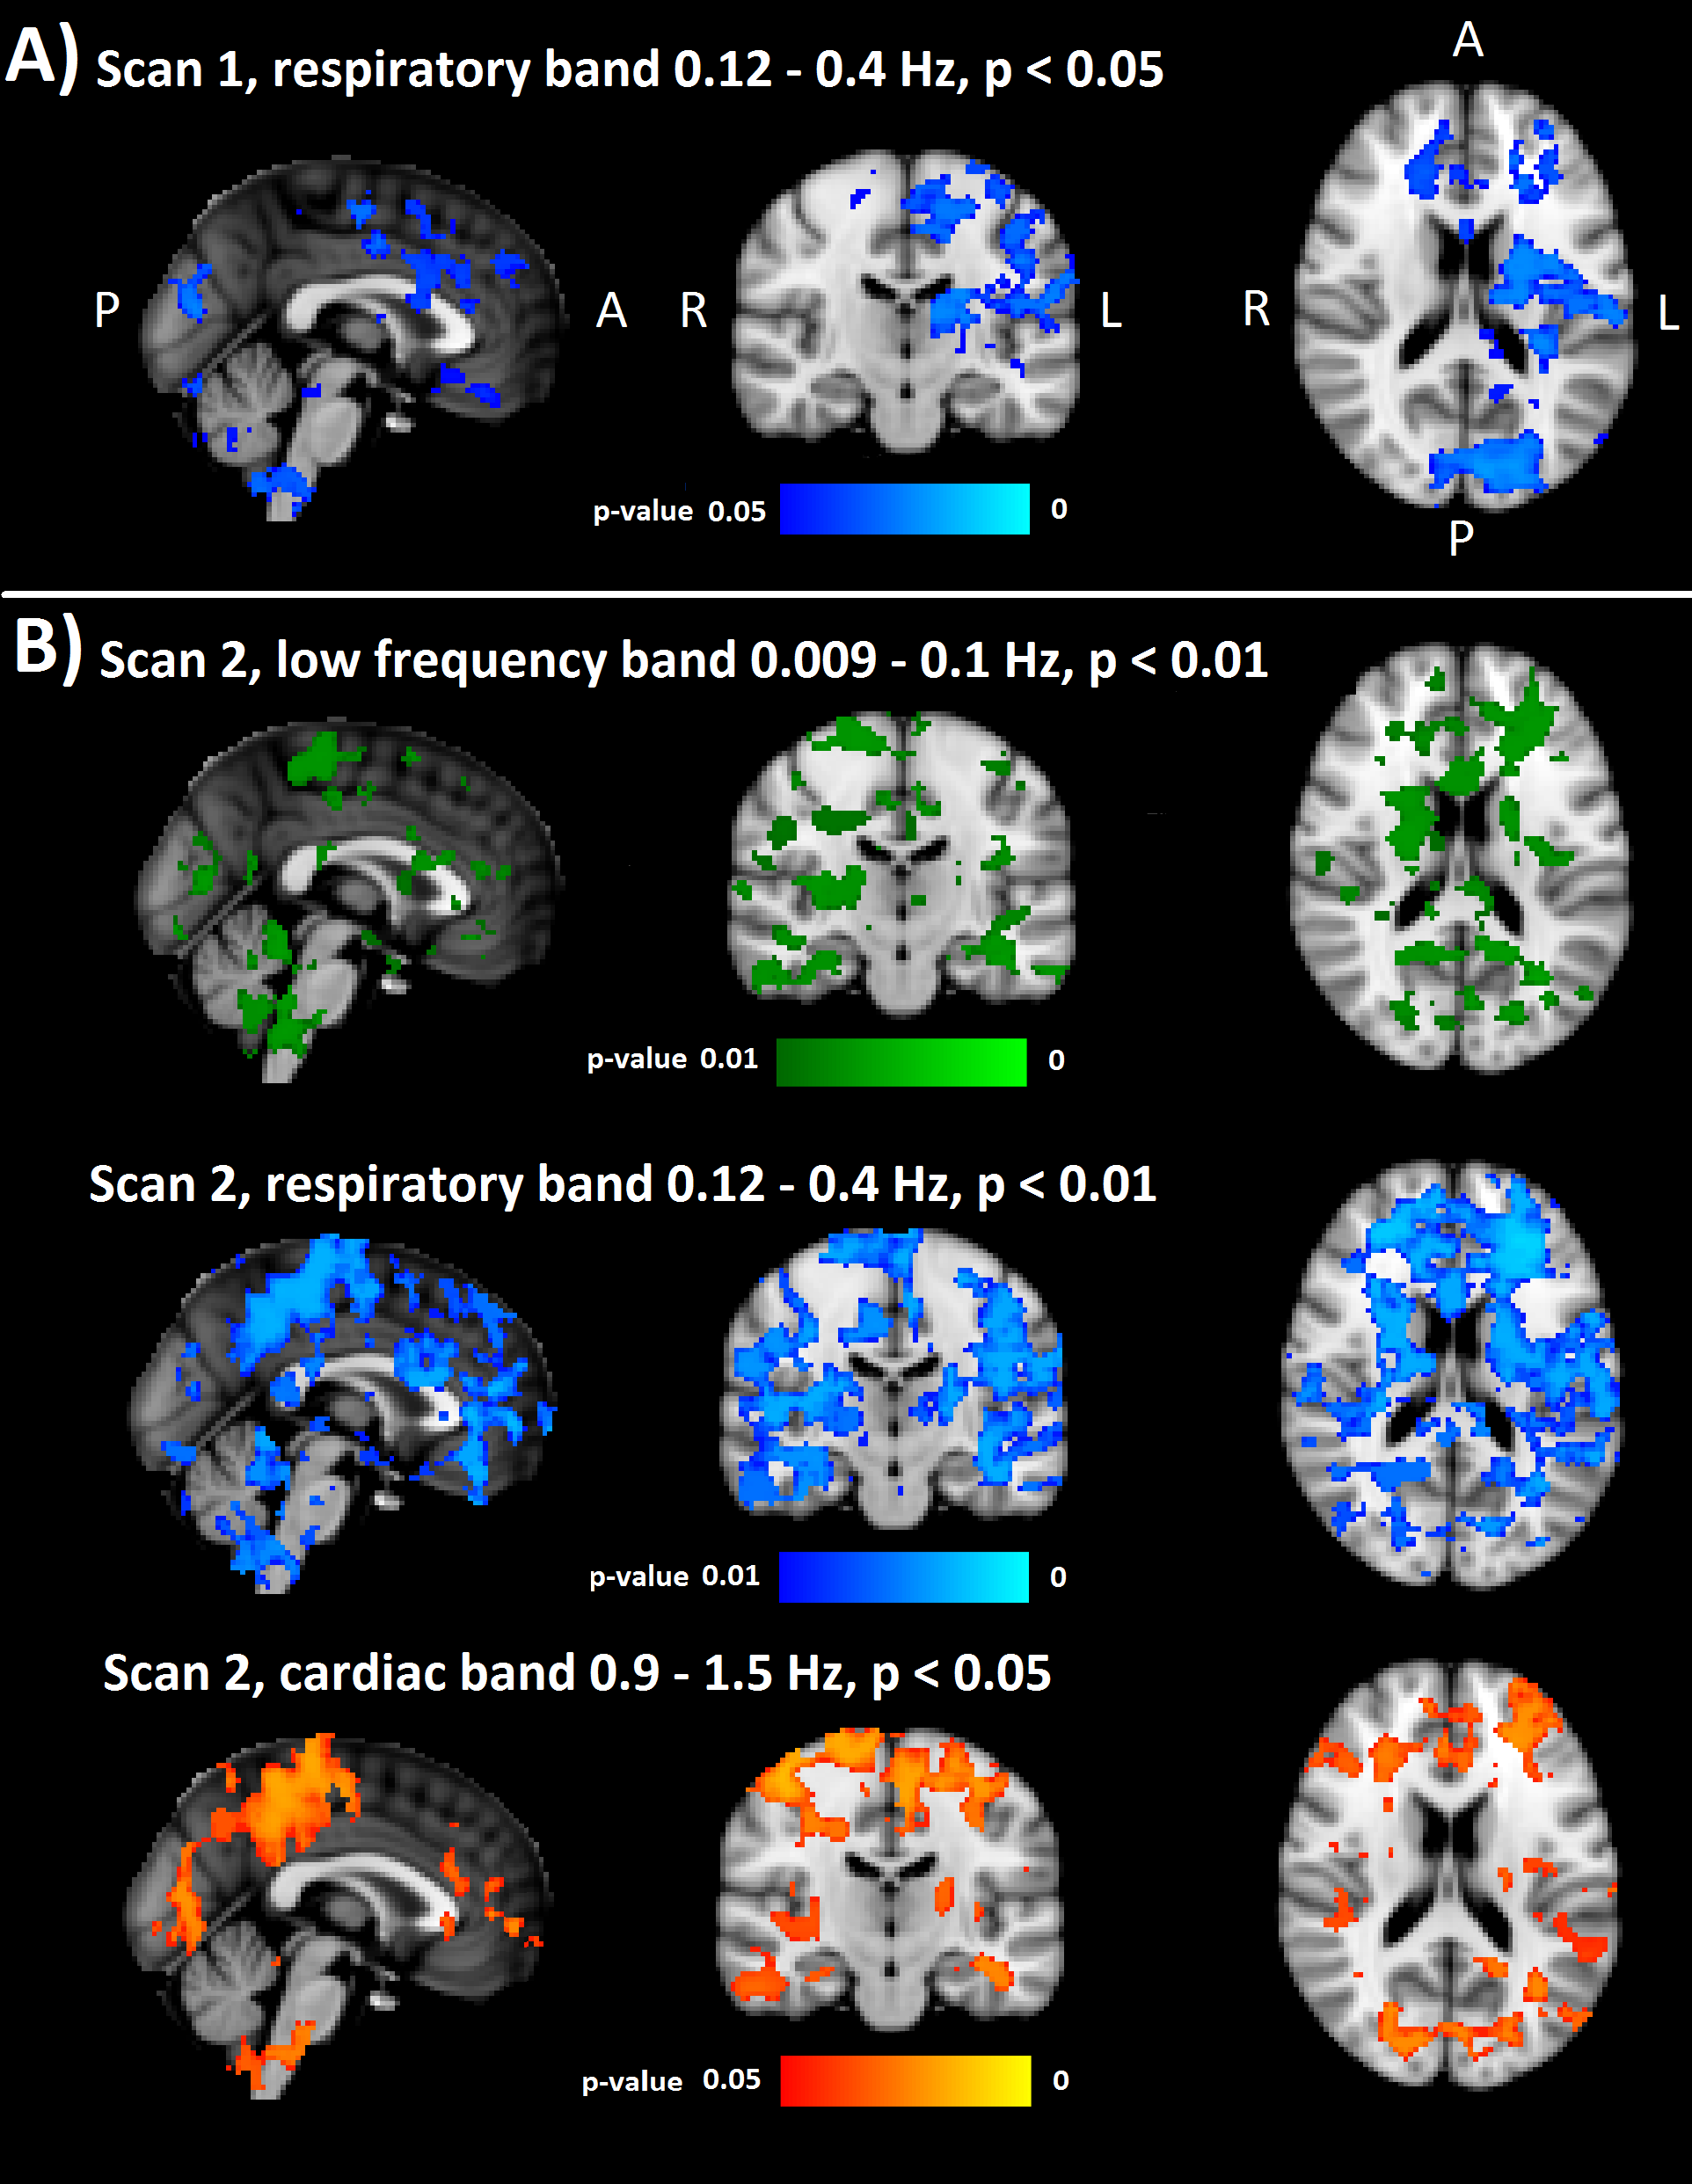
After informed consent 10 healthy and 10 DRE subjects, were imaged using Siemens 3T Skyra MREG-sequence (TR = 100ms, TE = 36 ms, FA = 25º, FOV = 192 mm3, 3 mm3 voxel) for 5-minute scanning (2861 volumes). Standard FSL pre-processing6 with FIX-ICA, was used7. The data was band-pass filtered to very low frequency (VLF = 0.009- 0.1 Hz), respiratory (0.12-0.4 hz) and cardiac (0.9-1.5 Hz) for more in depth estimation of the physiological source of variance.
Voxel-wise CV is calculated as CV = σ /μ, where μ = signal mean and σ = standard deviation, Fig.1A. Individual DRE data was thresholded voxel wise based on mean+3 std (μ+3σ) control group CV value, Fig's.1B & 3. Two scans for threshold DRE data were merged to show repeated changes. FSL randomise with TFCE, 10 000 perm. evaluated statistical group differences, Fig.2.
Results
In group level, the CV elevation predominated in periventricular grey and white matter, thalami, brain stem. Fig.2. Respiratory band had most prominent changes, followed by VLF and cardiac bands, Fig.2. Neither multimodal physiological signals i.e. heart rate, respiration rate, nor bulk head motion parameters (relative and absolute) showed no significant differences between groups. Also, in the simultaneously measured EEG did not occur any epileptiform activity.
Diagnostic mapping.
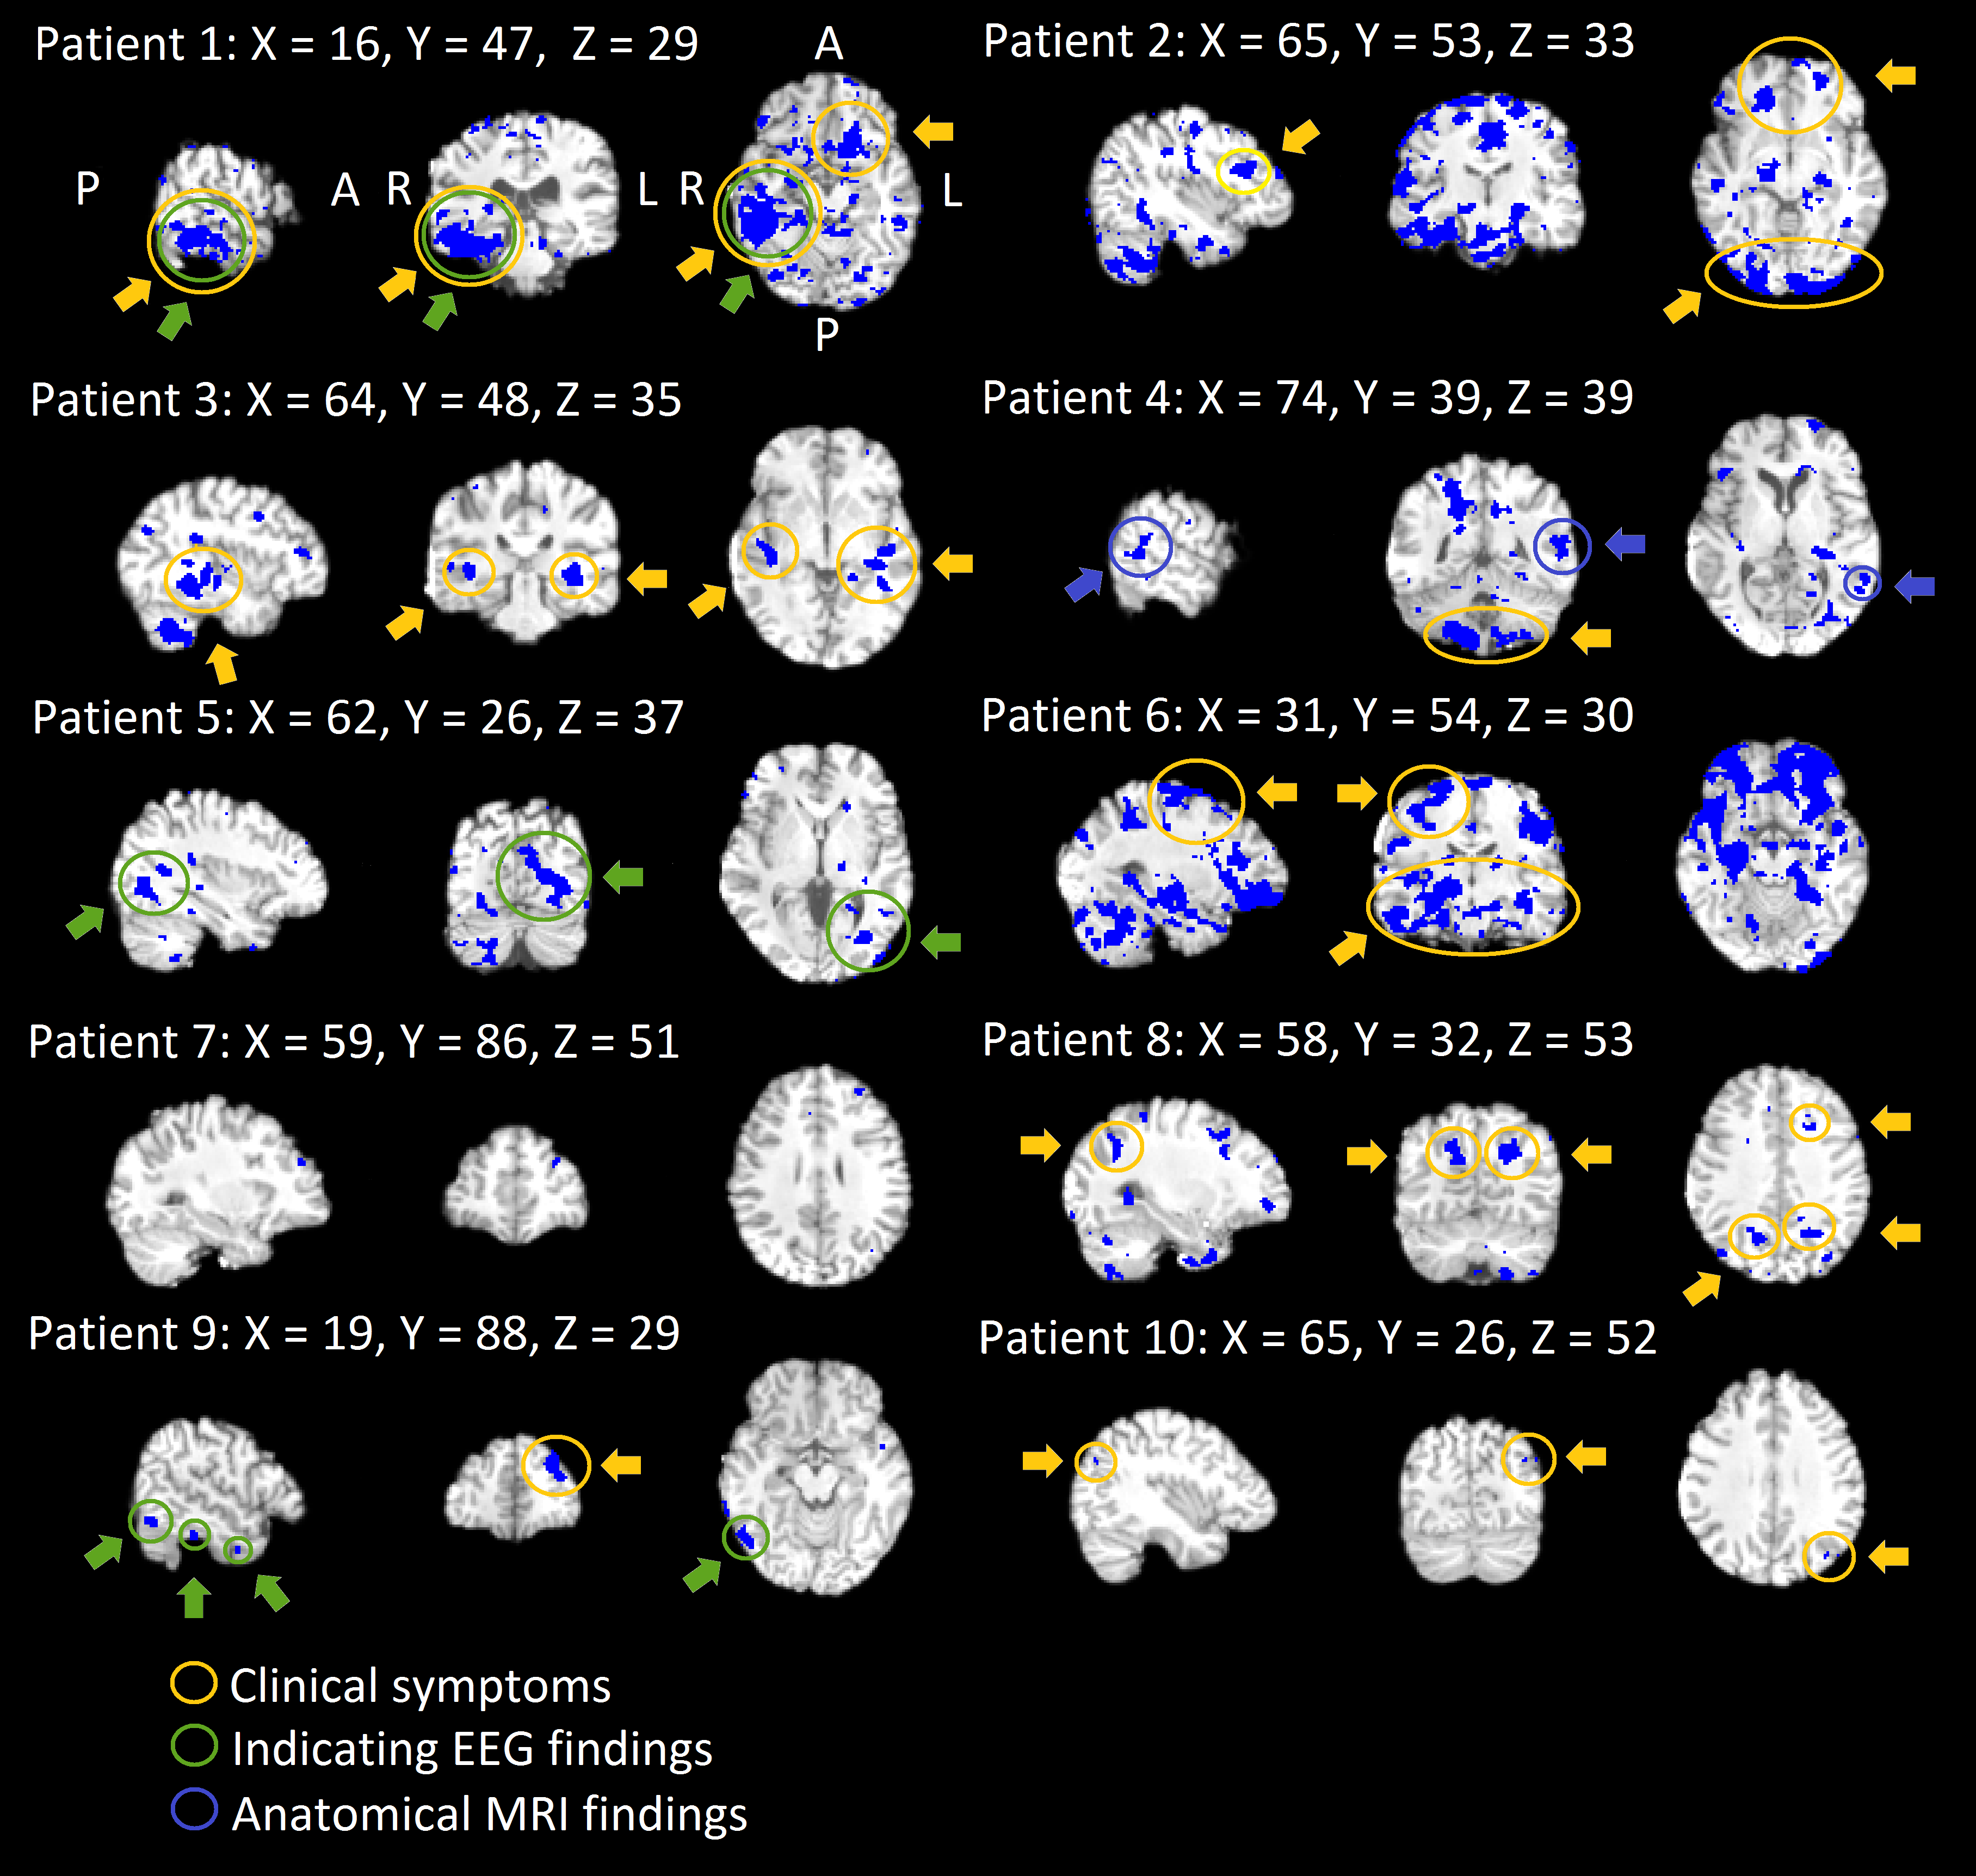
Each DRE patient showed elevated CV above μ+3σ threshold in overlapping areas in two consecutive scans, an example shown in Fig.3. Three patients (7, 9, 10) showed only a small area. All other patients showed more widespread, mostly bilateral changes. Notably in these 7 patients with widespread changes, autonomic brain stem respiratory centers show increased CV, see also Fig's 2-3. The abnormal CV maps have a good concordance to clinical symptoms and diagnostic measures, c.f. circles in Fig 3. In the second scan CV values were higher than the first. Notably none of the controls had voxels above μ+3σ threshold and this was repeated in another verification control group.
Conclusions
The MREG signal CV is significantly increased in patients with itractable epilepsy compared to matched controls. Notably the CV change is repeated in two consecutive scans in the absence of ictal EEG activity. Thresholding of the DRE maps with μ+3σ from control data enables individual diagnostics; some patients had small changes while others had very widespread abnormality over large areas that can potentially be areas with epileptiform activity.Acknowledgements
JAES foundation and Academy of Finland grant 275352 are cordially acknowledged for financial support.References
1. Jacobs, J. et al., 2014, Neuroimage. 88, 282-294.
2. Korhonen, V. et al., 2014, Brain Connect. 4, 677-689.
3. Jahanian, H. et al., 2014, PLoS One. 9, e92539.
4. Tuovinen, T. et al., 2017, Frontiers in Human Neuroscience. 10
5. Khalil, A. et al., 2017, Stroke. 48, 925-931.
6. Jenkinson M. et al., 2012, NeuroImage 62, 782-790.
7. Griffanti, L. et al., 2014. Neuroimage 95, 232-247.
Figures