2338
Can measures for evaluating gambling strategies inform decisions about fMRI pipelines?1Biomedical Translational Imaging Center, IWK Health Center, Halifax, NS, Canada
Synopsis
In single-subject fMRI such as is used in presurgical mapping, processing decisions and choice of threshold can greatly affect the activation maps. In order to provide support for making these decisions, we propose a self-similarity approach that uses comparisons across randomly-created split-halves of the data and evaluating the maps using measures that come from a gambling model - the Bookmaker Informedness, Markedness and Matthews Correlation Coefficient - using an fMRI simulation. Early results indicate that features of Informedness and Matthews Correlation Coefficient data may be useful for making pipeline and threshold decisions.
Introduction
In most task fMRI studies undertaken for psychology or psychiatry, multiple subjects are used to examine typical locations of activation for task, or to identify typical differences in activation between groups, and an average statistically-based threshold is used for each subject after a fixed processing pipeline. In clinical applications, such as for presurgical mapping, the need is to determine activation maps for a single subject, and especially to determine activation areas that are out of the ordinary. In these single subject cases, pipeline decisions can have a great effect on the activation maps, and as well the thresholds that are useful to clinicians can vary widely between subjects and are chosen on an individual basis.
Our interest is to determine how to make decisions about processing pipelines in a single subject case. One approach to this problem has focused on classification accuracy and used a self-similarity approach1,2,3,4 by dividing an individual fMRI run into 2 (referred to as split-halves), analyzing them individually, and calculating a measure of self-similarity in order to evaluate pipeline decisions. One particular measure of self-similarity uses contingency matrices and receiver operating curves (ROC) in which one of the 2 split-halves is treated as ground truth1.
Recently, we encountered contingency matrix evaluation measures that are not subject to bias and prevalence as true positive rate and false positive rate as used in ROCs are. These are Bookmaker Informedness, Markedness and Matthews Correlation Coefficient (MCC)5, 6 – Bookmaker is a reference to bookies in horse-racing or sports gambling and they have never been used in fMRI before. Informedness identifies the proportion to which we are making an informed prediction vs guessing. Markedness reverses predictor and condition from Informedness and is the proportion to which a condition is marked by a predictor. MCC depends on both Informedness and Markedness and is a dichotomous form of the Pearson Correlation Coefficient. We undertook to determine if these alternate evaluation measures could be useful for evaluating fMRI pipelines. We hypothesize that these alternative measures will produce metrics that can be used with split-halves to reflect data quality of the activation maps, similar to what is found with knowledge of ground truth.
Methods
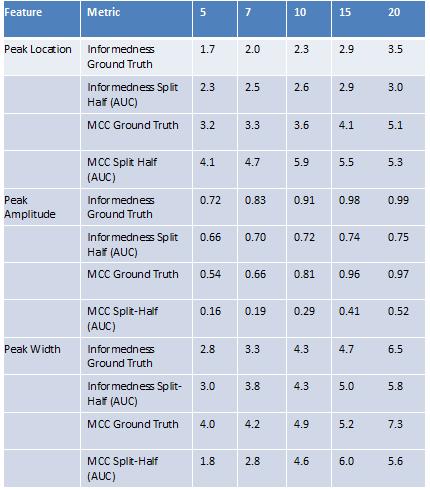
neuRosim7 was used as an fMRI simulation tool to generate fMRI data in which ground truth was known and data quality could be varied. Noise levels were tuned to duplicate the power spectral density function of real fMRI noise, and ground truth was created from a model of right hand motor response based on published data from the Human Connectome Project (HCP-accessed on NeuroVault8), where 6 areas of activation with varying sizes and effect sizes were defined based on the HCP source map. We ran 5 simulations at each of 5 data quality levels (DQL), analyzed each simulation, and calculated evaluation measures (derived from voxel counts of true positive, false positive, true negative and false negative), at thresholds from 0 to 10 in intervals of 0.1 using the simulation activation as the ground truth. We also calculated evaluation measures using a split-halves approach as we would do with real data. We also caluclated area under the curve (AUC) for each of the 2 halves as truth. We measured the features of peak location, peak amplitude and peak width, defined as the width at 80% of peak amplitude.Results
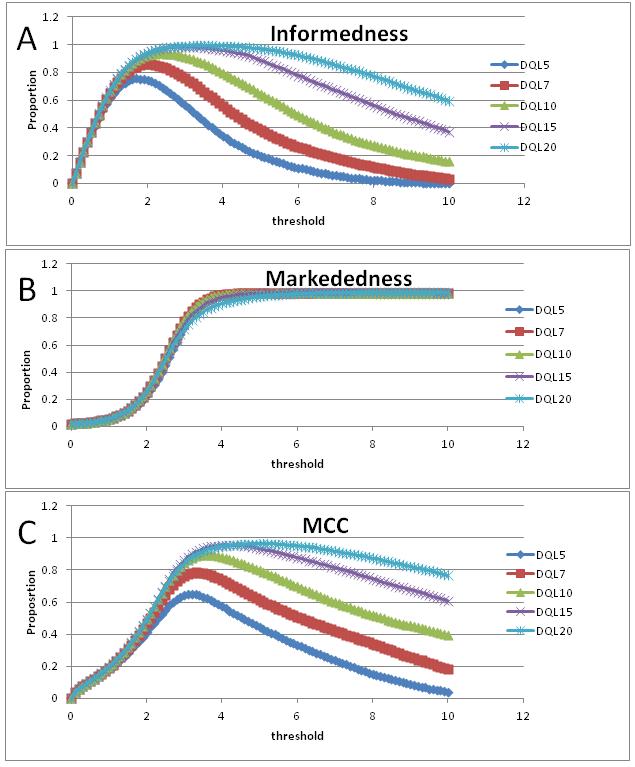
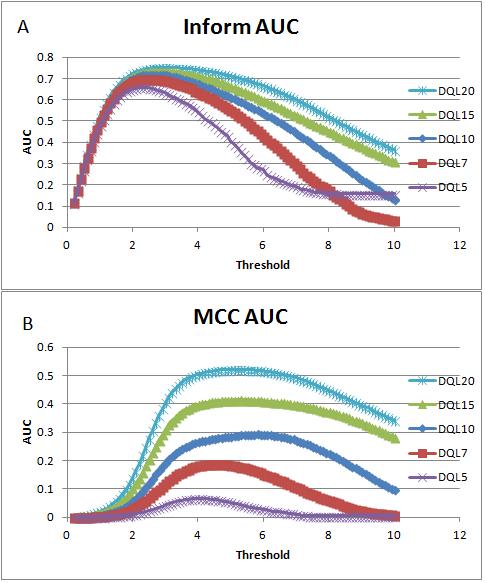
Figure 1 presents the variation in the measures with DQL where ground truth is known. Figure 2 presents area under the curve (AUC) of the split-half curves for Informedness and Matthews Correlation Coefficient. Table 1 is a summary of the features identified for each of the prospective measures.Discussion
In Figure 1, the Markedness curve shows no variation with DQL, and so will not be considered further. The Informedness and MCC curves show variation in all the features. Any of these features could potentially be used as markers of data quality, and the threshold of the peak is arguably a good choice of threshold for the activation map given that measure.Conclusion
From this initial simulation work, Informedness and Matthews Correlation Coefficient are identified as prospective indicators of data quality and thus of alternative processing pipelines. Further work is needed to determine what features of these new measures will best evaluate real data quality.Acknowledgements
No acknowledgement found.References
1. Stevens MTR, D’Arcy RCN, Stroink G, et al. Thresholds in fMRI Studies: Reliable for single subjects? Journal of Neuroscience Methods. 2013; 219:312-323.
2. Stevens MTR, Clarke DB, Stroink G, et al. Improving fMRI reliability in presurgical mapping for brain tumours. Journal of Neurology and Neurosurgery Psychiatry. 2016; 87:267-274.
3. Strother SC, Anderson J, Hansen LK et al. The quantitative evaluation of functional neuroimaging experiments: the NPAIRS data analysis framework. Neuroimage. 2002; 15(4):747-771.
4. Zhang J, Anderson JR, Liang L et al.Evaluation and Optimization of fMRI single-subject processing pipelines with NPAIRS and second-level CVA. Magnetic Resonance Imaging. 2009; 27:264-278.
5. Powers DMW. Recall and Precision versus the Bookmaker. Proceedings of the International Conference on Cognitive Science, Sydney, Australia, 2003, pp 529-534.
6. Powers DMW. Evaluation: From Precision, Recall and F-Factor to ROC, Informedness, Markedness and Correlation. Technical Report SIE-07-001. 2007. School of Informatics and Engineering, Flinders University, Adelaide, Australia.
7. Welvaert M, Durnez J, Moerkerke B, et al. neuRosim: An R package for generating fMRI data. Journal of Statistical Software. 2011; 44(1):1-1
8. Accessed on Neurovault (http://neurovault.org/collections/1960) – right hand vs baseline
Figures