2337
Impact of cerebral blood flow level on the fluctuations of resting-state BOLD fMRI in anesthetized rats1Univ. Grenoble Alpes, CNRS, Grenoble INP, GIPSA-lab, Grenoble, France, 2Univ. Grenoble Alpes, INSERM, CHU Grenoble Alpes, GIN, Grenoble, France
Synopsis
The Blood Oxygen Level Dependent (BOLD) signal, used in resting-state functional Magnetic Resonance Imaging (fMRI), is tighly linked to Cerebral Blood Flow (CBF). This study evaluates the impact of the CBF on the low-frequencies BOLD fluctuations and four physiological parameters during restingstate in 5 groups of rats (Wistar and Long-Evans) anesthetized with Isoflurane, Medetomidine, Etomidate and Urethane. It is shown that the CBF is not related to physiological parameters, and there exists a range of CBF values where the BOLD fluctations are sufficiently high for being used in any other analysis.
Introduction
In the context of preclinical imaging, one generally uses anesthesia to restrain the animal while in the MRI scanner. One can choose its anesthesia based on EEG measurements, which estimate the brain activity level. But anesthesia also modulates the cerebral blood flow (CBF) and thereby may modulate the fluctuations of the BOLD signals. It is thus of interest to search for the influence of CBF on BOLD signals at different frequencies. Also, as the anesthetic is changing the physiological parameters, it is important to evaluate the link between physiological measurements and CBF.Materials and Methods
Groups: 5 groups of rats were considered. One group of Wistar rats, anesthetized with isoflurane (1%; n=6), 4 groups of Long Evans rats anesthetized with isoflurane (1%; n=6), Urethane (n=7), Medetomidine (bolus of 0.24 mg/kg and infusion of 0.12 mg/kg/h; n=6), and Etomidate (bolus of 10 mg/kg and infusion, n=7).
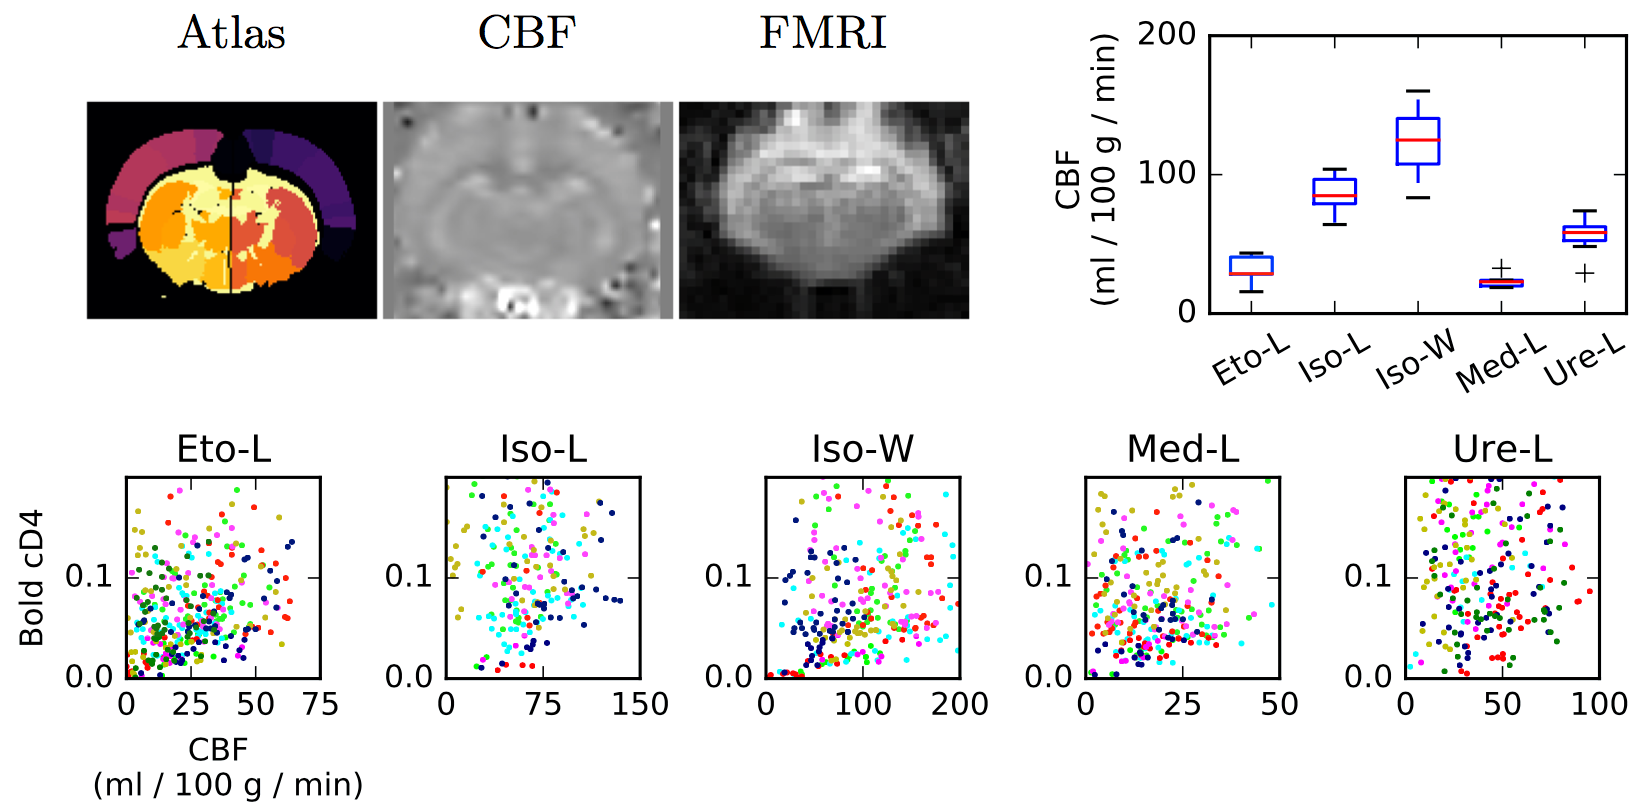
Data acquisition: Rats were imaged at 9.4T with a volume transmit, 4-channel surface receive cross coil configuration (Paravision 6.0.1, Bruker, Ettlingen, Germany). After an anatomical T2w scan, cerebral blood flow (CBF) was mapped using pseudo continuous arterial spin labeling (pCASL) following inter-pulse phase optimization (Hirschler et al early view). Then, resting state fMRI was performed with a single shot echo-planar imaging (TE=20 ms, TR=500 ms, spatial resolution 0.47x0.47x1.00 mm, 9 slices, 3600 repetitions, duration: 30min). Eventually, a second CBF map was acquired. Heart rate and breath rates were monitored throughout the entire procedure.
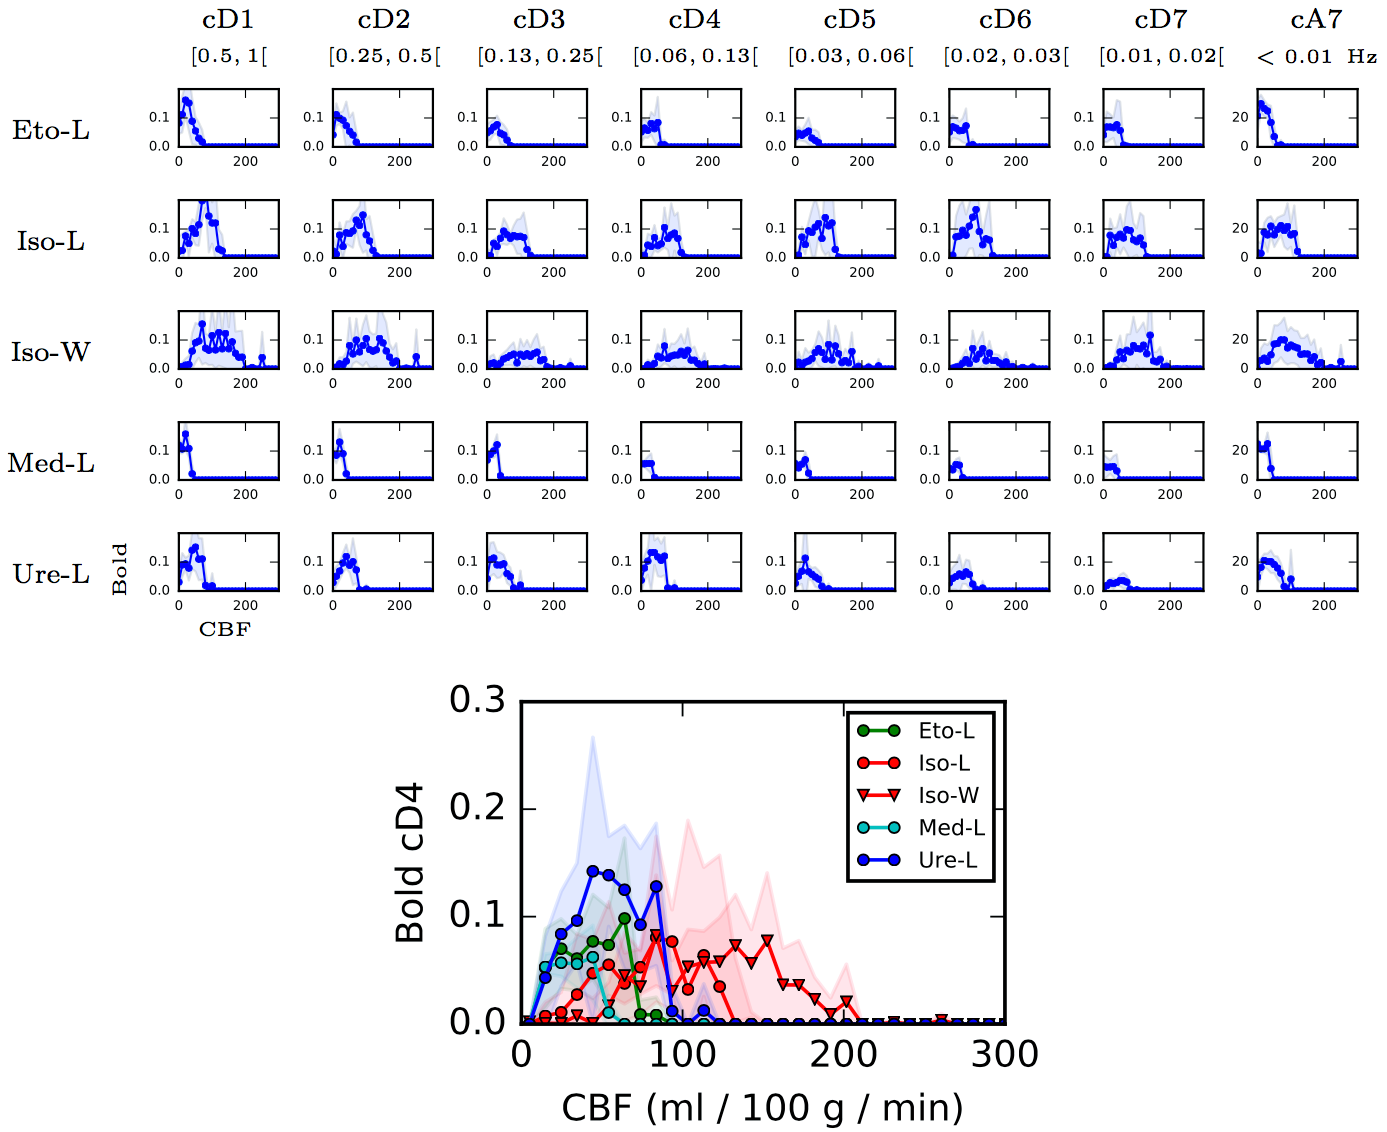
Data processing: Statistical Parametric Mapping program (SPM12, see 1) was used to co-register anatomical, CBF, and functional MRI data. CBF maps were obtained using homemade routines based on 2. CBF values and rs-fMRI time courses were computed for each of the 51 parcels of an homemade rat brain atlas. Briefly, the atlas was obtained by fusing two existing atlases proposed in 3-4, and merging small regions. Mean CBF values were extracted by averaging the values obtained before and after the rs-fMRI acquisition. Each rs-fMRI time course was decomposed using a dyadic wavelet transform at different scales (detail or wavelet coefficients cD1 to cD7, in addition scaling or approximation coefficients (cA7) captures the polynomial trends contained in the signal.The 0.05-0.10 Hz frequency band, cD4, is the one generally evaluated in resting-state fMRI. Standard deviations (std) of the wavelet coefficients are computed for each area and each individual in each group for quantifying the fluctuations of the BOLD signals.
Results
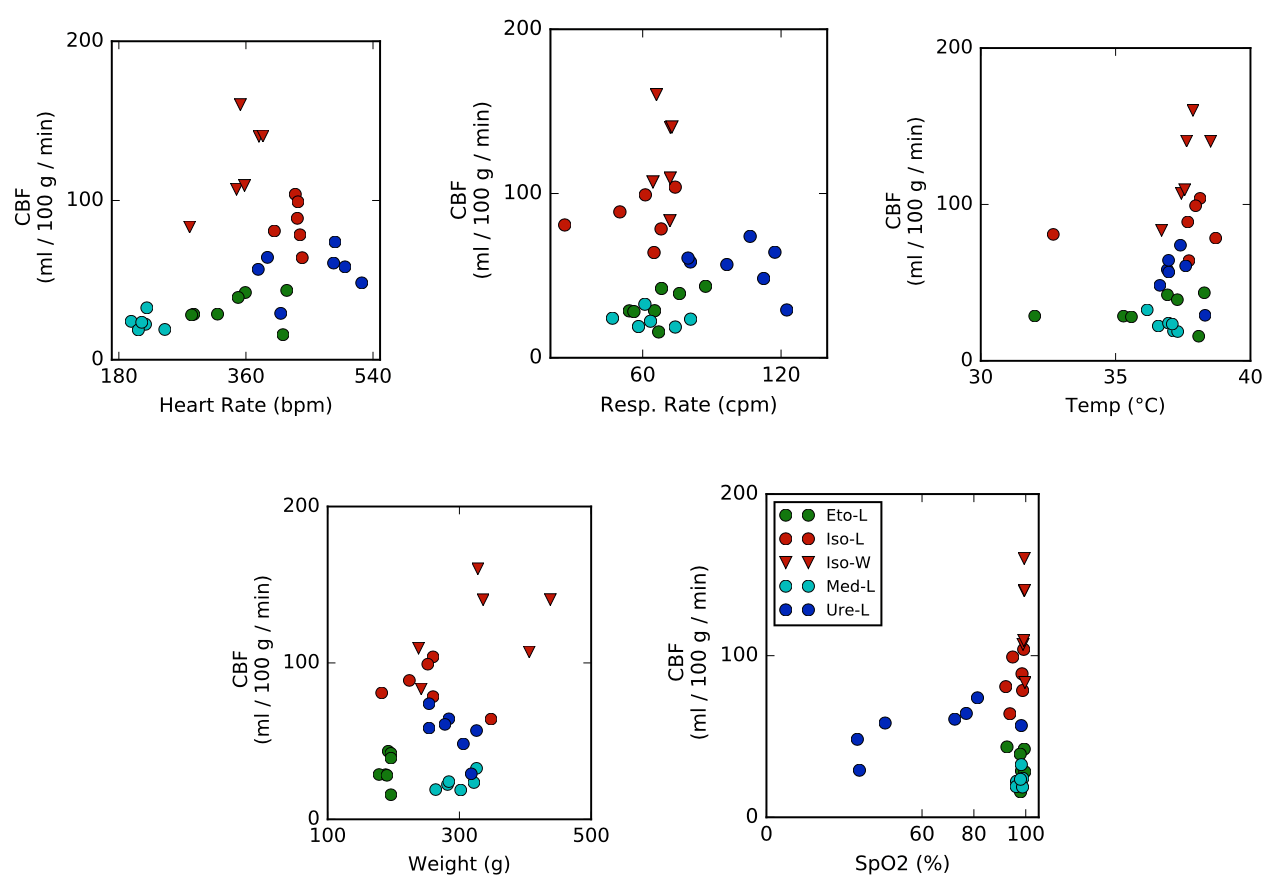
General anesthetics depending on the drug modulate the CBF by up to one order of magnitude (Figure 1). For each anesthetic, the CBF values are homogeneous. Moreover, there is no evidence of a link between CBF and physiological parameters (breath rate, heart rate...) (Figure 2). Figure 3 shows the std of each wavelet coefficient time series (as a function of CBF, per area and per bin of 10 ml/100g/min). Distribution shapes seem comparable between scales and groups. Generally, the BOLD signals follow a trapezoidal shape with a plateau for CBF values between 20 and 150 ml/100g/min, and become null for higher CBF values. The amplitude of the plateaus are very similar, despite the broad range of CBF values (cf. Figure 1). The shapes for Iso-L and Iso-W are slightly different with larger transitions to and from plateau leading to a larger trapezoidal shape. For Iso-W, the plateau for cD4 BOLD std is reached for 80 ml/100g/min and decreases for CBF values greater than 150 ml/100g/min.Discussion
For a large majority of anaesthetic agents, the amplitudes of the standard deviations of the resting state BOLD signals are not related to CBF. When applying wavelets, the fluctuations of the BOLD signals remain large. Wavelets have been shown to handle properly fractal properties of the BOLD signals as reported in 5, which is of particularly interest in the context of brain connectivity. It is shown here that wavelet decompositions are not altering the BOLD standard deviation, especially at low frequencies usually used for preprocessing BOLD signal as in 5. If all anesthetics show a trapezoidal shape of distribution with more or less transition steps, isoflurane seems to induced some relations with perfusion, especially for the Wistar strain. This is potentially due to the vasodilator effect of this molecule as noted in 6. For large values of CBF, BOLD fluctuations are decreasing.Conclusion
For the anaesthetic agents evaluated in this study, dynamics of brain area signals are not related to CBF. However, isoflurane yields to reduced fluctuations of BOLD signals, for some brain areas with too low or too large values of CBFAcknowledgements
This work was partly funded by a grant from AGIR-PEPS, Université Grenoble Alpes–CNRS.References
1 Members and collaborators of the Wellcome Trust Centre for Neuroimaging, SPM: Statistical parametric mapping, http://www.fil.ion.ucl.ac.uk/spm/
2 Alsop DC, Detre JA, Golay X, Günther M, Hendrikse J, Hernandez-Garcia L, Lu H, MacIntosh BJ, Parkes LM, Smits M, van Osch MJ, Wang DJ, Wong EC, Zaharchuk G. Recommended implementation of arterial spin-labeled perfusion MRI for clinical applications: A consensus of the ISMRM perfusion study group and the European consortium for ASL in dementia. Magn Reson Med. 73(1):102-16, 2015.
3 P. A. Valdés-Hernandez et al., An in vivo MRI template set for morphometry, tissue segmentation and fMRI localization in rats, Frontiers in Neuroinformatics, 5(26):1-19, 2011.
4 E. A. Papp et al., Waxholm Space atlas of the Sprague Dawley rat brain, Neuroimage, 97: 374-386, 2014.
5 S. Achard et al., A resilient, low-frequency, small-world human brain functional network with highly connected association cortical hubs, J. Neurosci., 26(1): 63-72, 2006.
6 K. S. Hendrich et al., Cerebral perfusion during anesthesia with fentanyl, isoflurane, or pentobarbital in normal rats studied by arterial spin-labeled MRI, Mag. Res. in Med., 46(1): 202-206, 2001.
Figures