2335
Comparison of MB and MBME in task fMRI1Donders Center for Cognitive Neuroimaging, Radboud University, Nijmegen, Netherlands, 2Faculty of Psycology and Neuroscience, Masstricht Univeristy, Masstricht, Netherlands, 3Erwin L. Hahn Institute for Magnetic Resonance Imaging, Essen, Germany
Synopsis
In this work a multiband protocol is compared to a Multiband Multi-echo (MBME) protocol in the context of task fMRI at 3T. Furthermore, we evaluate the use of FSL- FIX to clean both datasets and compare its impact on the acquisition protocols in terms of tSNR, sensitivity and statistical significance.
Introduction
EPI (Echo Planar Imaging) is the standard imaging technique used in functional MRI studies. With the recent advances, the use of Multiband (MB) RF pulses to excite multiple slices simultaneously can increase the acquisition speed [1],[2],[3]. The high temporal efficiency of MB EPI increases the tSNR per unit time, and t-scores in fMRI studies [4]. In BOLD, the optimum sensitivity is achieved at TE=T2* of gray matter. By acquiring multiple TEs in Multi-Echo (ME) EPI and optimally combining them, the T2* throughout different brain regions can be better matched, resulting in increased sensitivity particularly in areas of large magnetic field inhomogeneity [5],[6]. Using MBME both reduces the TR and provides the sensitivity benefits [6],[7]. In this work a multiband protocol is compared to a matched Multiband Multi-echo (MBME) protocol in the context of task fMRI at 3T. Furthermore, we evaluate the use of FSL- FIX to clean both datasets and compare its impact in the obtained results.Methodology
Data Acquisition
Data were acquired on a 3T MRI scanner (Siemens Prisma, Erlangen, Germany) equipped with a 32-channel head coil. The Multiband-only (MB) and Multiband-Multiecho (MB-ME) protocols had the following parameters in common: resolution 2.5mm isotropic, 48 slices (no gap), FOV 210x210 mm2, and Fat Saturation was performed before each slice. The individual parameters can be found on Table 1.
Experimental design
Fourteen healthy volunteers (23.2 ± 3.7) participated in this experiment and an extra dataset of (n=20) was acquired to train FSL- FIX [8] [9] to our specific MB and MBME protocols. Informed consent was obtained prior to data acquisition under an approved ethics protocol. Participants were scanned twice in sessions 24 hours apart, the order of aquistion was altered between subjects in the first session and counter balanced in the second to avoid any habituation effects. In each session participants were scanned with the two protocols (MB-only and MB-MBME) while performing a color word matching Stroop task. The five contrasts evaluated can be seen in Table 2.
Data Processing
The functional analysis was carried out with FEAT (v5.98, http://www.fmrib.ox.ac.uk/fsl/) with the following preprocessing steps: spatial smoothing (5 mm kernel), MCFLIRT and registration to the MNI. For MBME, the first echo was used for MCFLIRT, and the chosen combination method was simple averaging. FMRIB's ICA-based Xnoiseifier (FIX)[8] [9] was used for cleaning the MB and MBME data. After running ICA at the individual subject level, FIX was used to regress the artifactual components based on the spatial and temporal features extracted from the training dataset. Higher-level analysis was carried out using FLAME (FMRIB's Local Analysis of Mixed Effects) with Fixed effects for combining across the sessions and Mixed effects for the paired-t-test between groups [10],[11],[12] . Z statistic images were thresholded using clusters determined by Z > 2.3 and a (corrected) cluster significance threshold of p<0.05.
Results
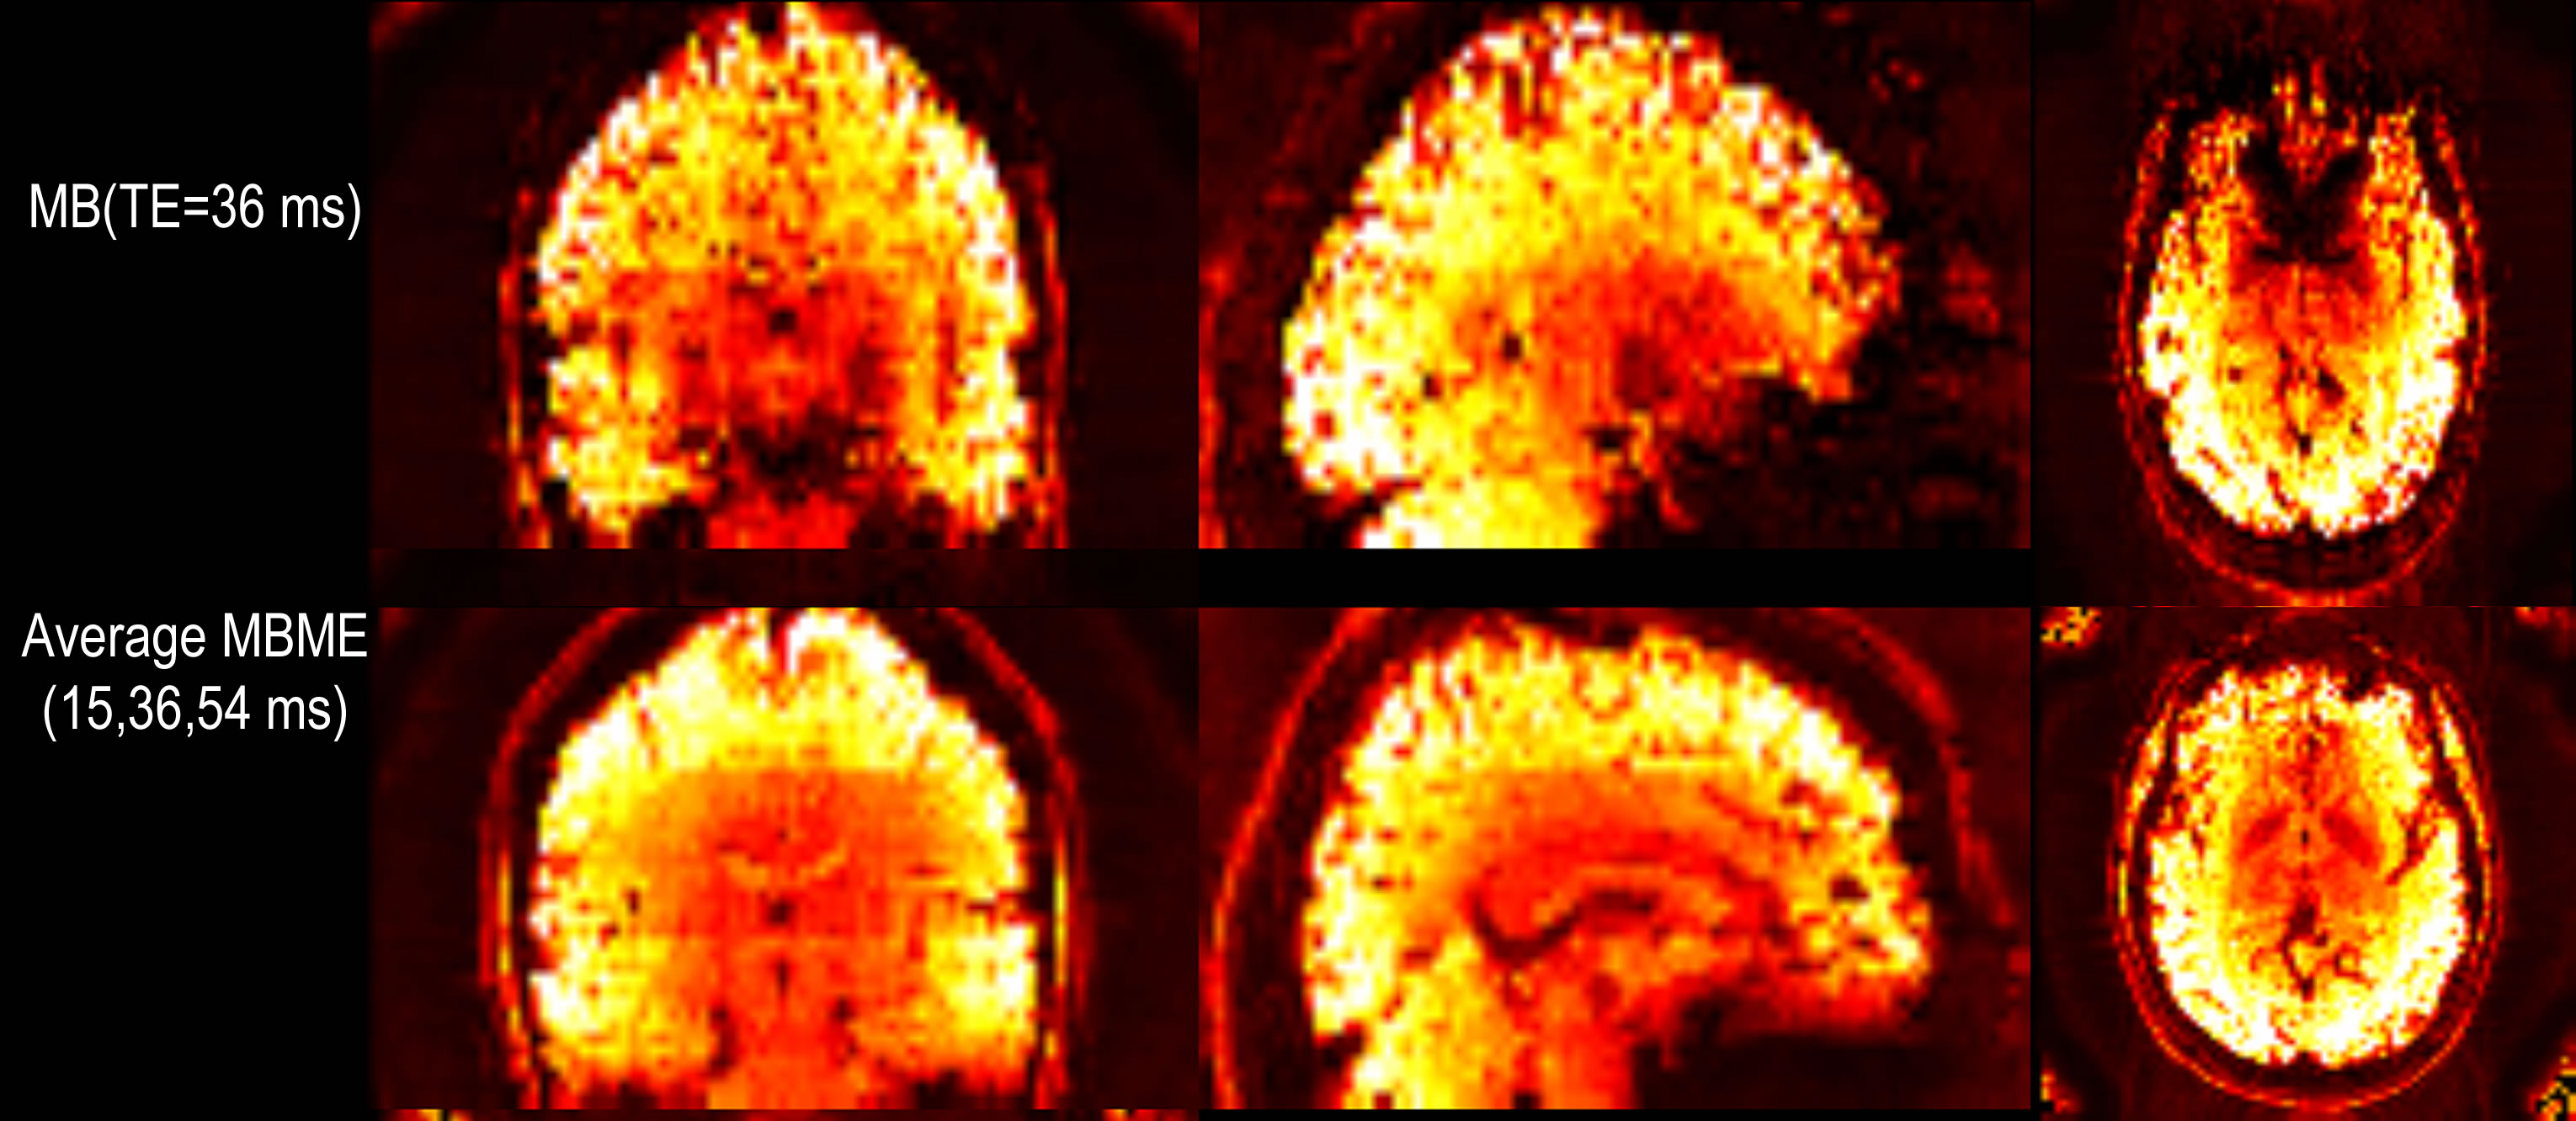
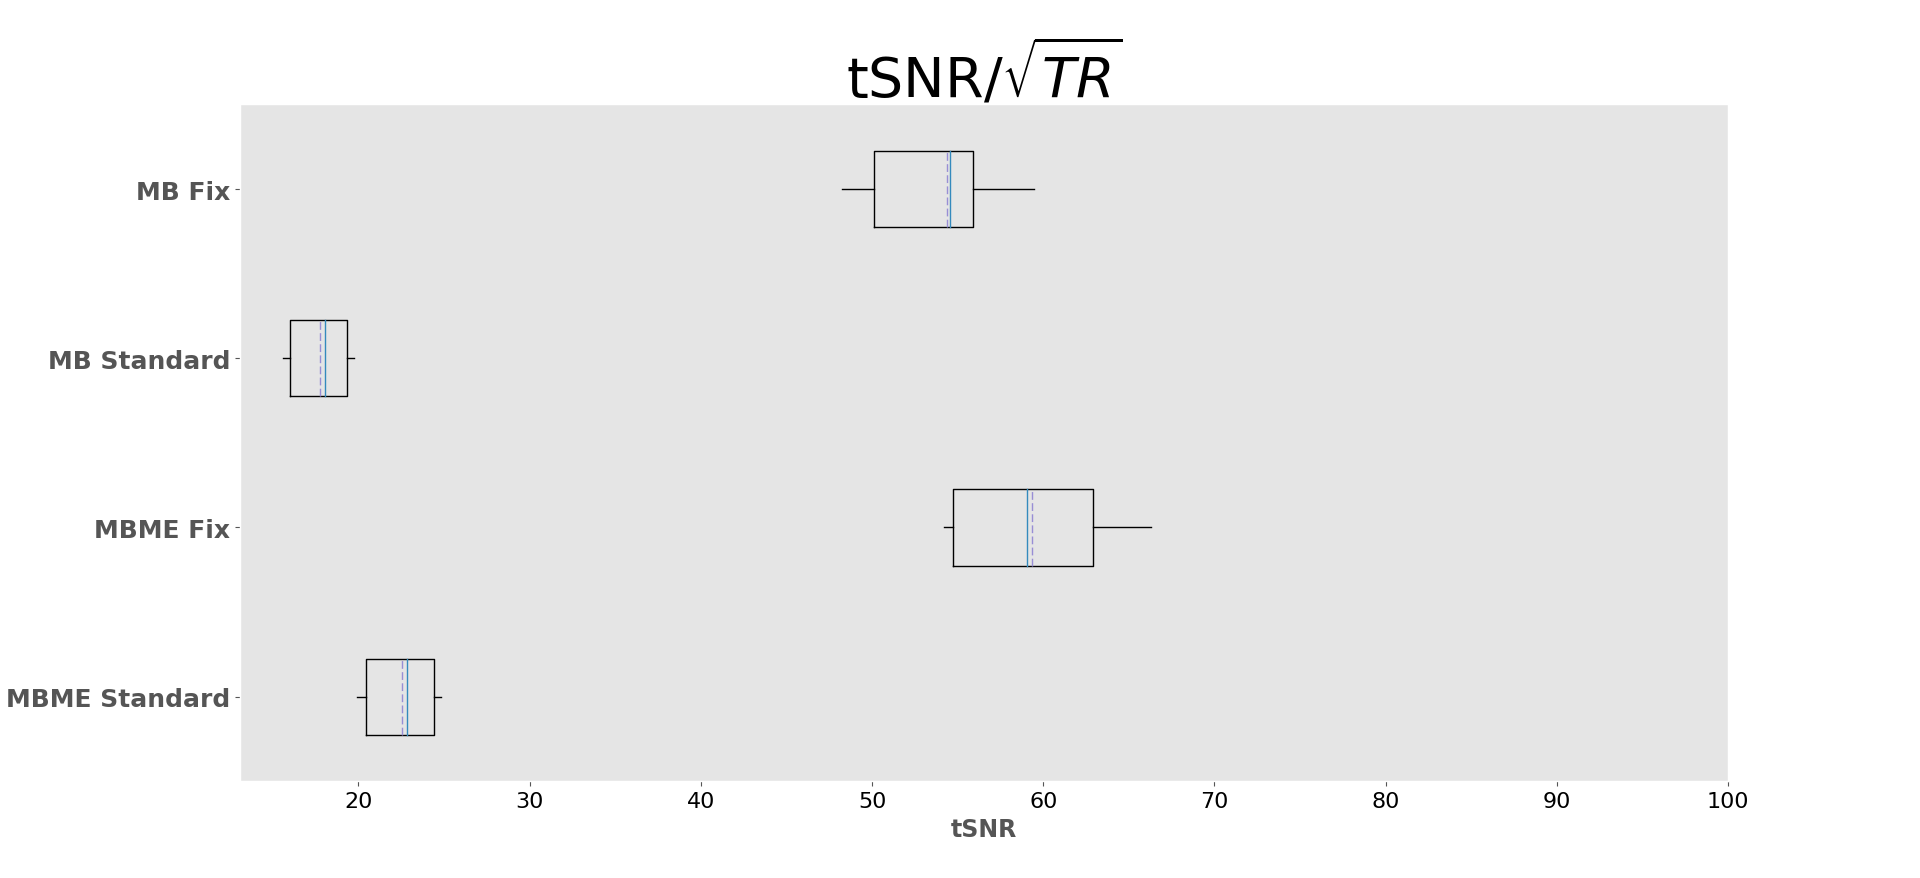
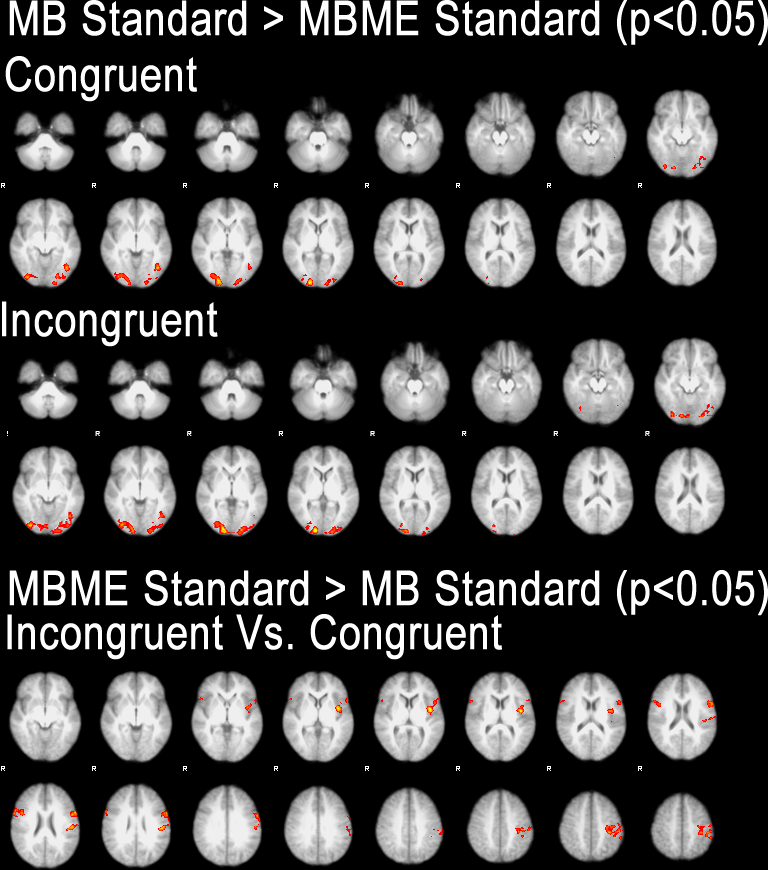
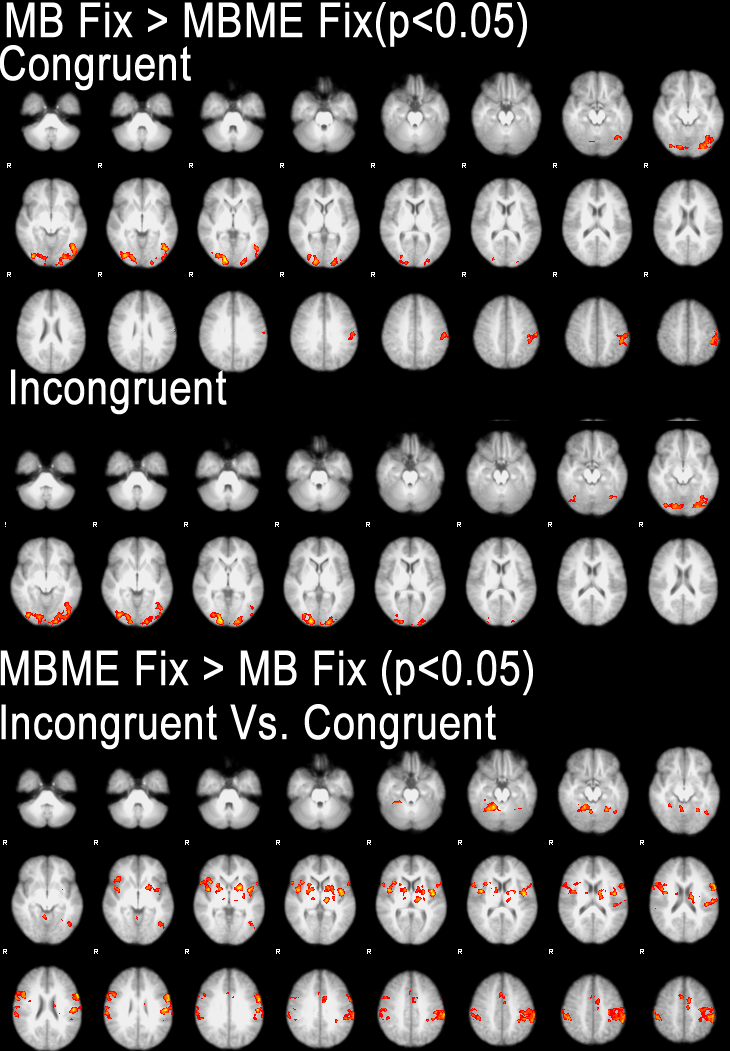
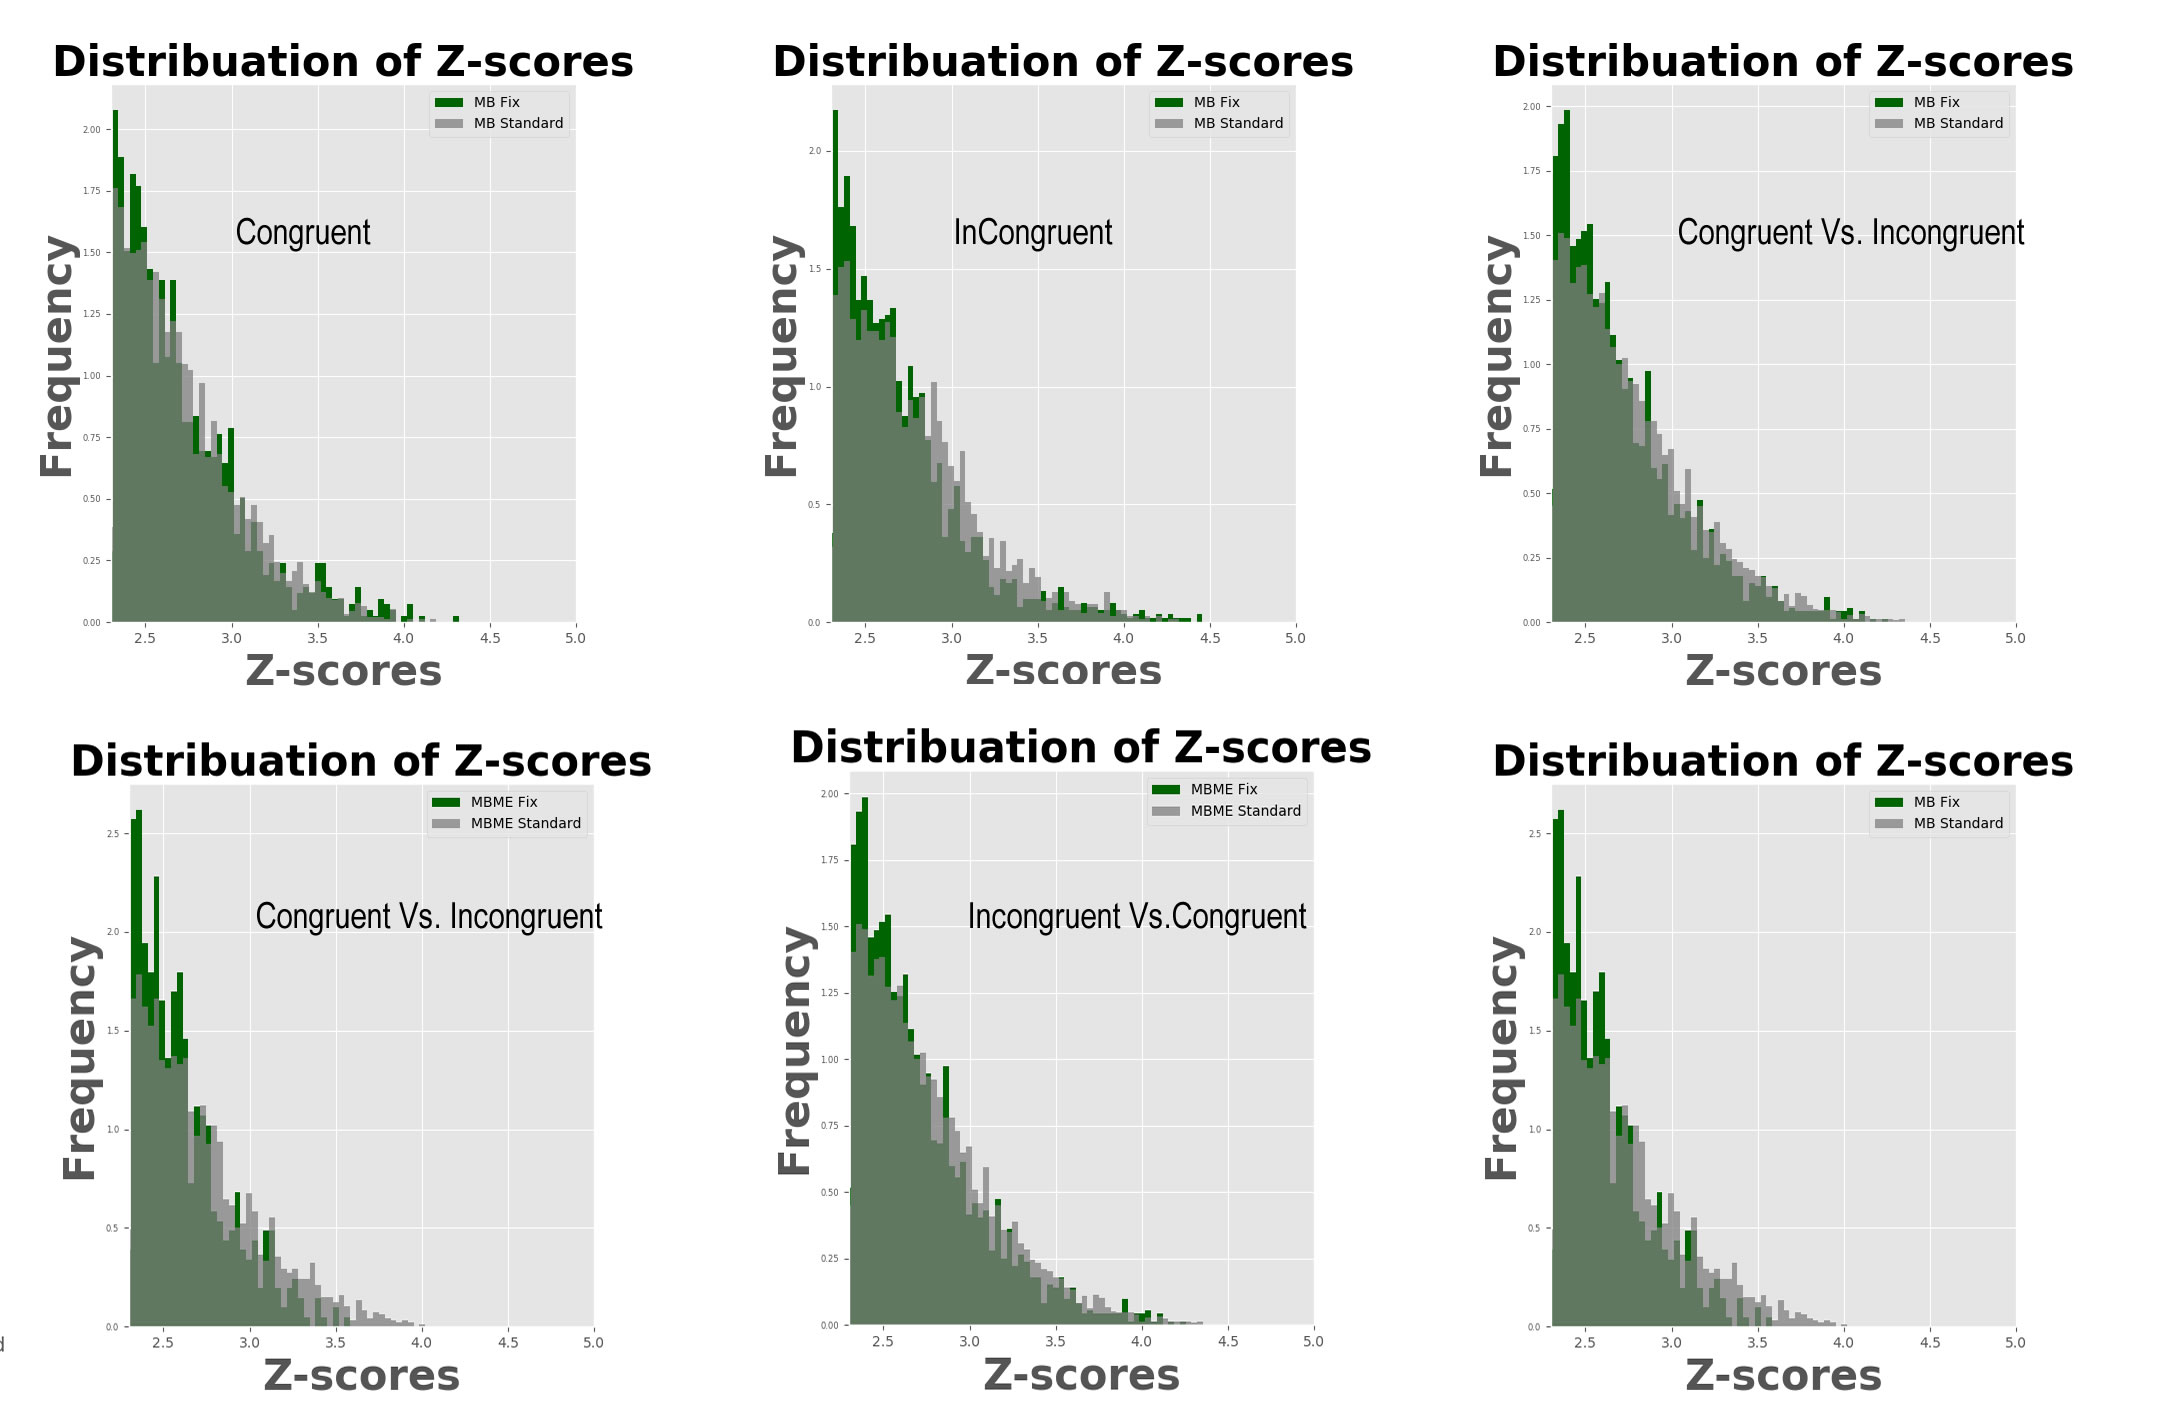
Maps of tSNR normalized by √TR are shown in Figure 1. Fix successfully increased tSNR, and MB ME yielded the higher tSNR per unit of time both before and after FIX cleaning (see Figure 2). In Figure 3, the group difference between MB and MBME is shown. MB had more significant voxels in comparison to MBME in visual areas of the brain. MBME had similarly significant voxels as MB standard in less homogeneous areas of the brain but with more voxels on the medial parts of the brain as shown in Figure 4. The number of activated voxels before and after Fix Cleaning can be seen in Table 2.Spatial distribution of Z-scores before and after Fix can be seen in Figure 5, with increase in the number of voxels with high Z-scores after FIX cleaning in both protocols
Discussion
Compared to the MBME, MB protocols systematically performed better in visual areas while MBME showed improved ability to detect differences between incongruent and congruent stimuli particularly in the deep gray matter regions.FIX cleaning had a significant impact in both protocols both in tSNR, number of activated voxels and statistical valueConclusion
Difference between the two protocols at the group level is significant. With MBME, performing better in the subcortical areas of the brain. Activation in visual areas with MB can be due to the inflation of z-scores in MB requiring advanced autoregressive correction for a fair comparison [13]Acknowledgements
No acknowledgement found.References
[1] D. A. Feinberg, S. Moeller, S. M. Smith, E. Auerbach, S. Ramanna, M. F. Glasser, K. L. Miller, K. Ugurbil, and E. Yacoub, “Multiplexed echo planar imaging for sub-second whole brain fmri and fast diffusion imaging,” PLoS One, 2010.[2] S. Moeller, E. Yacoub, C. A. Olman, E. Auerbach, J. Strupp, N. Harel, and K. U?urbil, “Multiband multislice GE-EPI at 7 tesla, with 16-fold acceleration using partial parallel imaging with application to high spatial and temporal whole-brain fMRI,” Magn. Reson. Med., vol. 63, no. 5, pp. 1144–1153, May 2010.[3] K. Setsompop, B. A. Gagoski, J. R. Polimeni, T. Witzel, V. J. Wedeen, and L. L. Wald, “Blipped-controlled aliasing in parallel imaging for simultaneous multislice echo planar imaging with reduced g-factor penalty,” Magn. Reson. Med., vol. 67, no. 5, pp. 1210–1224, May 2012.[4] N. Todd, S. Moeller, E. J. Auerbach, E. Yacoub, G. Flandin, and N. Weiskopf, “Evaluation of 2D multiband EPI imaging for high-resolution, whole-brain, task-based fMRI studies at 3T: Sensitivity and slice leakage artifacts,” Neuroimage, vol. 124, pp. 32–42, 2016.[5] S. Posse, S. Wiese, D. Gembris, K. Mathiak, C. Kessler, M.-L. Grosse-Ruyken, B. Elghahwagi, T. Richards, S. R. Dager, and V. G. Kiselev, “Enhancement of BOLD-contrast sensitivity by single-shot multi-echo functional MR imaging,” Magn. Reson. Med., vol. 42, no. 1, pp. 87–97, Jul. 1999.[6] B. A. Poser, M. J. Versluis, J. M. Hoogduin, and D. G. Norris, “BOLD contrast sensitivity enhancement and artifact reduction with multiecho EPI: parallel-acquired inhomogeneity-desensitized fMRI.,” Magn. Reson. Med., vol. 55, no. 6, pp. 1227–35, Jun. 2006.[7] R. Boyacioğlu, J. Schulz, P. J. Koopmans, M. Barth, and D. G. Norris, “Improved sensitivity and specificity for resting state and task fMRI with multiband multi-echo EPI compared to multi-echo EPI at 7T,” Neuroimage, vol. 119, pp. 352–361, 2015.[8] L. Griffanti, G. Salimi-Khorshidi, C. F. Beckmann, E. J. Auerbach, G. Douaud, C. E. Sexton, E. Zsoldos, K. P. Ebmeier, N. Filippini, C. E. Mackay, S. Moeller, J. Xu, E. Yacoub, G. Baselli, K. Ugurbil, K. L. Miller, and S. M. Smith, “ICA-based artefact removal and accelerated fMRI acquisition for improved resting state network imaging,” Neuroimage, vol. 95, pp. 232–247, 2014.[9] L. Griffanti, G. Salimi-Khorshidi, C. F. Beckmann, E. J. Auerbach, G. Douaud, C. E. Sexton, E. Zsoldos, K. P. Ebmeier, N. Filippini, C. E. Mackay, S. Moeller, J. Xu, E. Yacoub, G. Baselli, K. Ugurbil, K. L. Miller, and S. M. Smith, “ICA-based artefact removal and accelerated fMRI acquisition for improved resting state network imaging,” Neuroimage, vol. 95, pp. 232–247, Jul. 2014.[10] C. F. Beckmann, M. Jenkinson, and S. M. Smith, “General multilevel linear modeling for group analysis in FMRI,” Neuroimage, vol. 20, no. 2, pp. 1052–1063, Oct. 2003.[11] M. W. Woolrich, T. E. J. Behrens, C. F. Beckmann, M. Jenkinson, and S. M. Smith, “Multilevel linear modelling for FMRI group analysis using Bayesian inference,” Neuroimage, vol. 21, no. 4, pp. 1732–1747, Apr. 2004.[12] M. Woolrich, “Robust group analysis using outlier inference,” Neuroimage, vol. 41, no. 2, pp. 286–301, Jun. 2008.[13] A. K. Sahib, K. Mathiak, M. Erb, A. Elshahabi, S. Klamer, K. Scheffler, N. K. Focke, and T. Ethofer, “Effect of temporal resolution and serial autocorrelations in event-related functional MRI,” Magn. Reson. Med., vol. 76, no. 6, pp. 1805–1813, Dec. 2016.Figures