2333
Exploiting the physiological properties of the global signal to correct for fluctuations in BOLD fMRI induced by heart rate and respiratory variations1Graduate Program in Biological & Biomedical Engineering, McGill University, Montreal, QC, Canada, 2Department of Bioengineering, McGill University, Montreal, QC, Canada
Synopsis
Functional connectivity (FC) in fMRI has generated major attention recently. Patterns of FC are consistently found in healthy subjects, whereas alterations of these patterns have been associated with many neuropsychiatric disorders. However, confounding factors arising from physiological processes have to be taken into consideration when analyzing and interpreting the results in order to ensure their validity. Even though physiological noise correction is commonly applied to fMRI, it is believed that the field would certainly benefit from more efficient techniques. In this study, we examine the relationship of the global BOLD signal with fluctuations in heart rate and respiration and propose a new method for removing the associated artifacts from whole-brain fMRI data.
INTRODUCTION
Correcting for physiological confounds on the BOLD signal is of great importance for fMRI studies and particularly for dynamic functional connectivity (FC), as it has been shown that a significant source of variations in FC is physiological in nature [1,2]. The effect of variations in heart rate (HRV) and respiration on BOLD fluctuations is typically modelled with the methods proposed by Chang et al [3] and Birn et al [4]. The first model is simply the convolution of HRV, typically extracted from a pulse oximeter, with the so-called “cardiac response function” (CRF) [3]. According to the second model, the respiration volume per time (RVT) (i.e. an index proportional to the breathing rate and depth at each time point) is first estimated based on measurements from a pneumatic belt [5]. Subsequently, RVT is convolved with the “respiration response function” (RRF).
Furthermore, variations in HRV and respiration can
account for substantial fluctuations in the global BOLD signal (GS; mean signal
across all voxels) [5,6]. As a result, the latter signal is often used as
a nuisance regressor in GLM fMRI analysis. Global
artifacts that are physiologically-related may be adequately removed with GS regression but only partially removed with alternative denoising techniques, including the aforementioned model by Birn et al [6]. However, there is growing
evidence that the GS may also contain a neural component that may be
inadvertently removed when the GS is regressed out [6]. In this study, instead of using
the GS as a nuisance regressor in the fMRI analysis, we use this
signal in order to extract different versions of the CRF and RRF that are later
used to assess physiological confounds in the analysis. Moreover, we
examine whether the use of group-, scan- or voxel-specific physiological
response functions (PRFs) explain more variance compared to the “canonical” CRF
and RRF [3,4], referred to as CRFo and RRFo
below.
METHODS
The PRFs are estimated from resting-state fMRI data obtained from healthy subjects from the Human Connectome Project [8] and compared with those reported in [5,6] (CRFo and RRFo respectively). A larger number of scans (59 scans of 15 minutes each from 16 healthy subjects), with improved sampling rate (TR=0.720s) is considered in this work compared to these previous studies. Before any analysis, the motion parameters and the cardiac and respiratory artifacts (2nd order RETROICOR) were regressed out from the minimally preprocessed data. Subsequently, the GS of each scan was calculated.
Four categories of PRFs are examined: (1) the “canonical” impulse responses CRFo and RRFo, as well as (2) group-specific PRFs derived from all subjects, (3) scan-specific and (4) voxel-specific PRFs. In addition, for each of the aforementioned four categories, three models are examined, whereby the HRV, RVT or both are convolved with the corresponding PRFs.
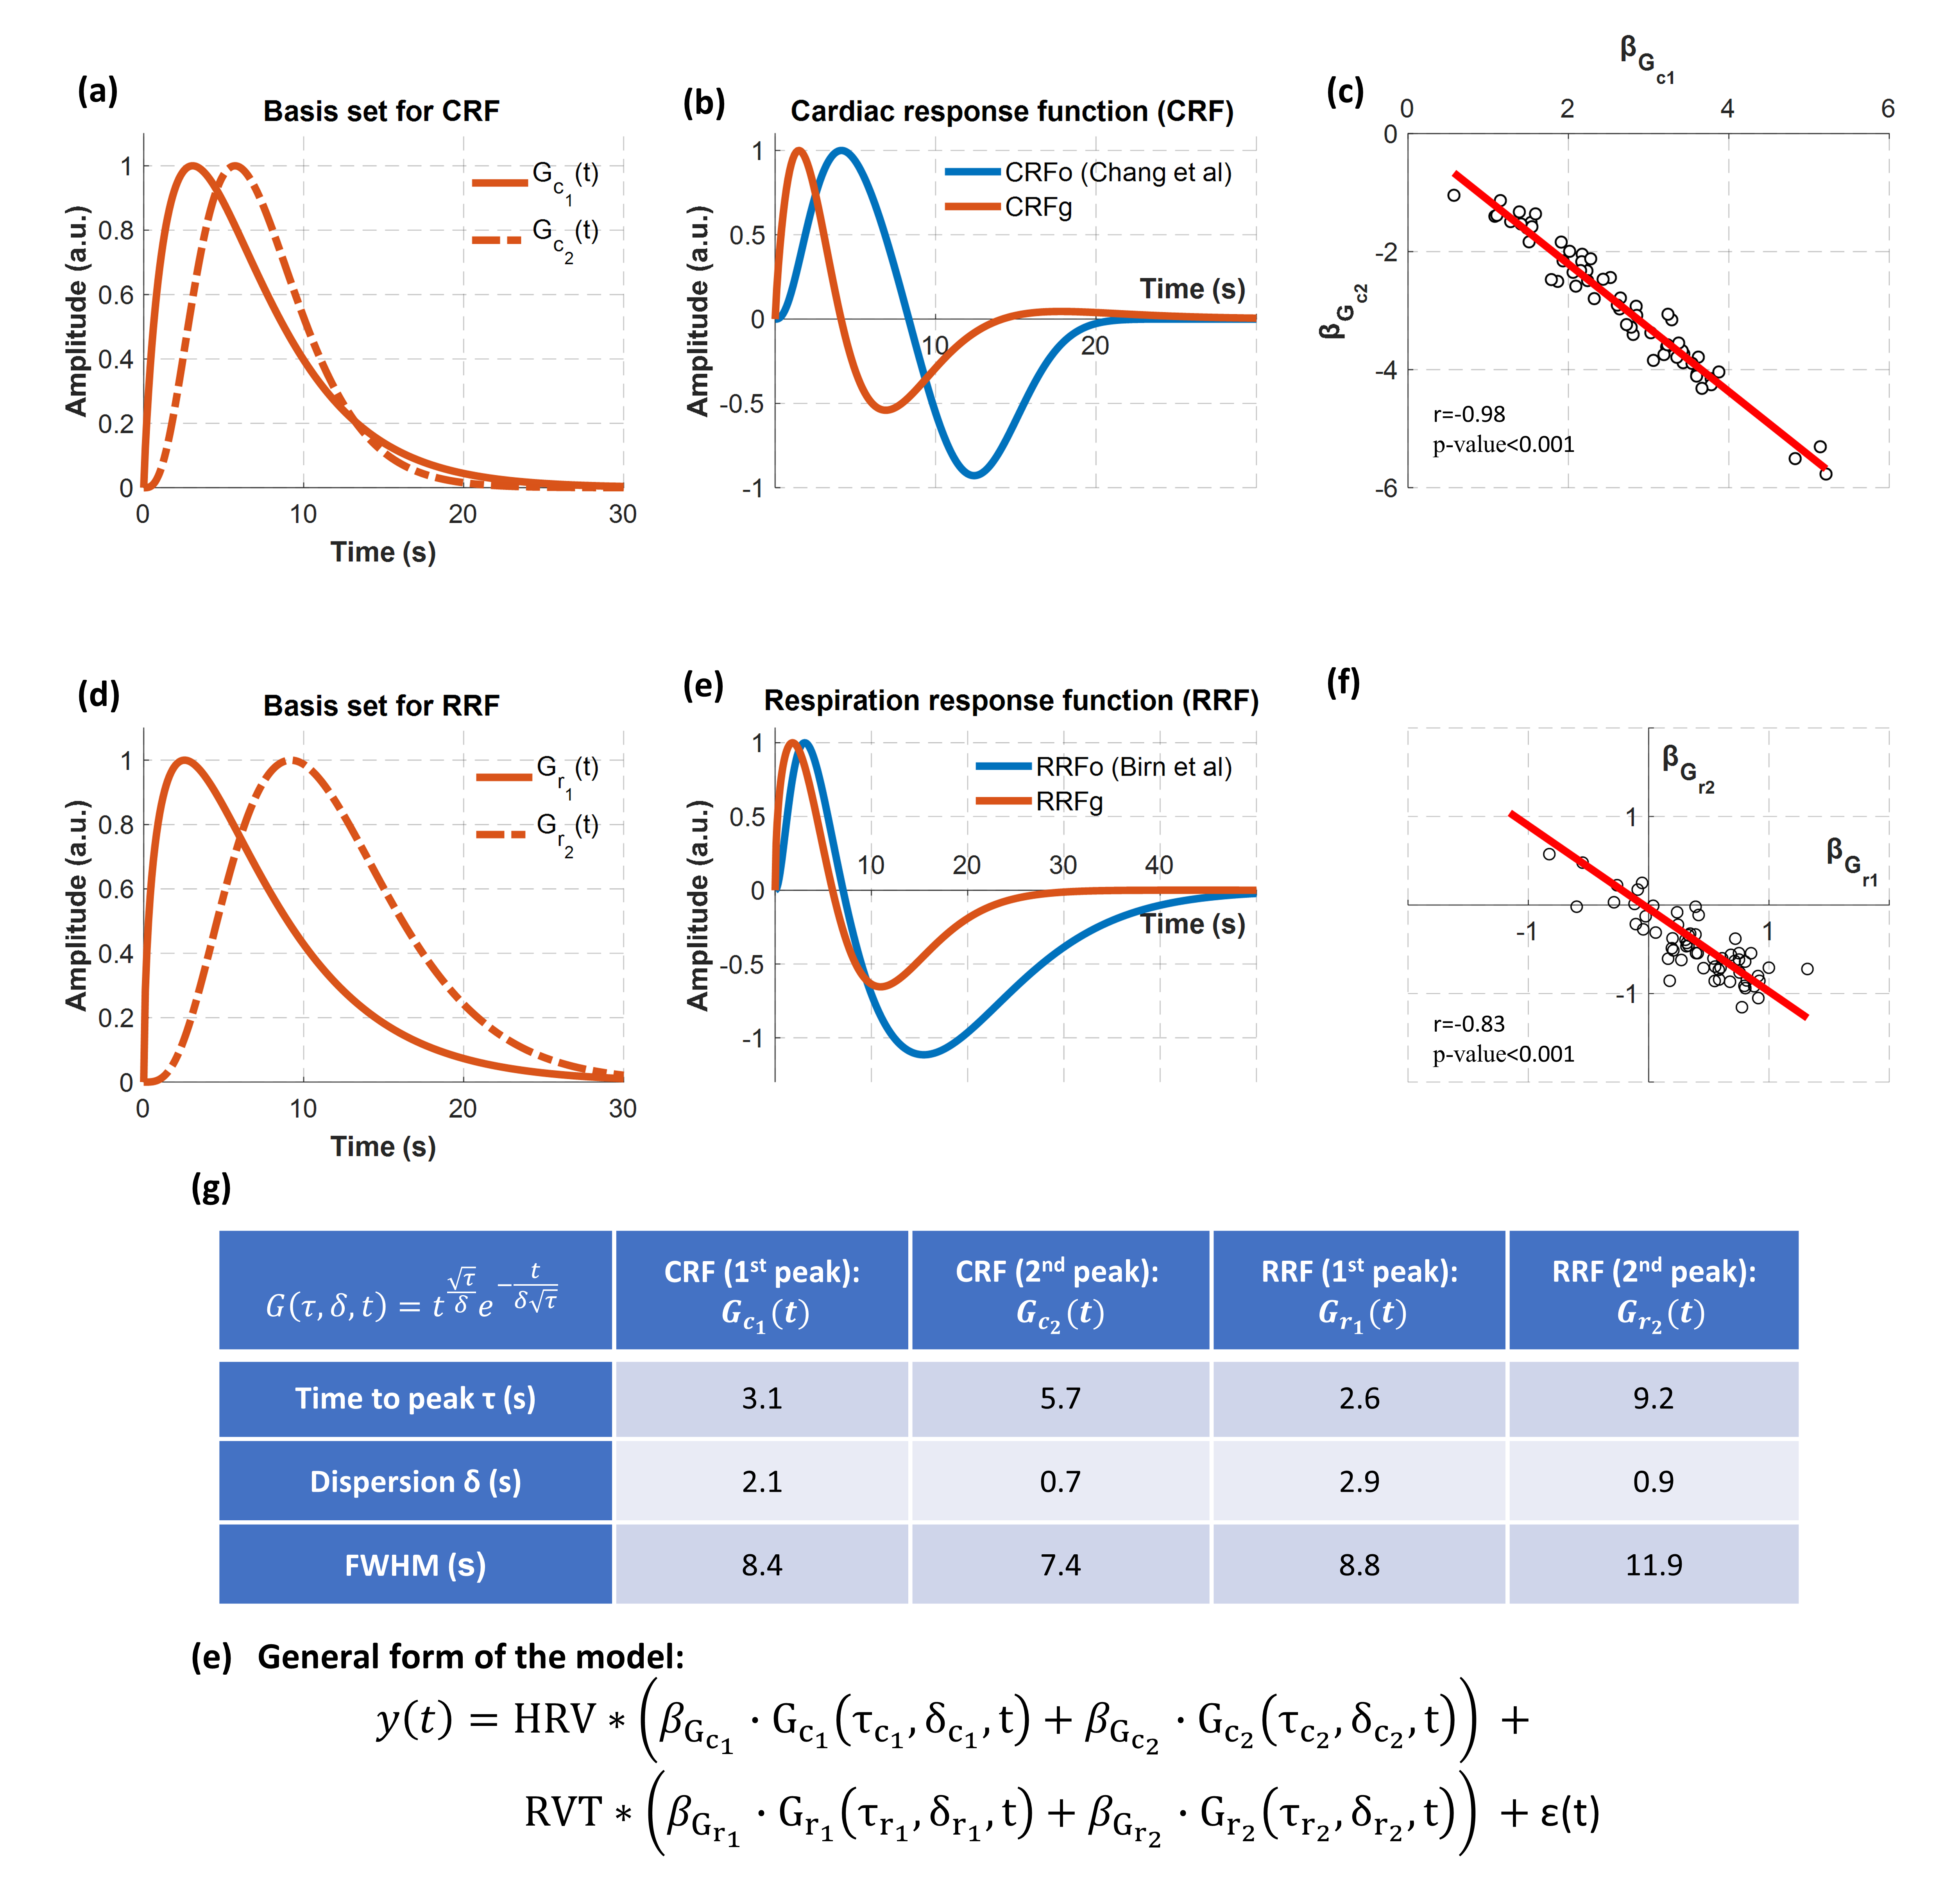
The PRFs were modelled as the weighted sum of two gamma variate functions (Fig.1). The parameters of these gamma functions (i.e. τc1, δc1, τc2, δc2, τr1, δr1 ,τr2, δr2) were estimated using a genetic algorithm (GA) implemented in Matlab [9]. GAs are powerful optimization algorithms that explore the parameter space aiming to find the parameter set that minimizes or maximizes an objective function. In this context, the employed GA was used to identify the 8 parameters, and thus the four gamma functions used to construct scan-specific PRFs, that maximize the fit of the model HRVRVTs (i.e. convolution between HRV and RVT with CRF and RRF respectively) with the GS across all scans. These four gamma functions were used as the basis set for all the subsequently estimated PRFs. The performance of each model was evaluated using k-fold cross-validation analysis (k=3).
RESULTS
Fig.1 shows the basis set used to obtain the CRF and RRF as well as the group-specific PRFs (i.e. CRFg and RRFg). While CRFg has a similar shape with CRFo, its peaks appear at earlier time lags and the negative peak has almost the half amplitude of the one in CRFo. The same holds for the RRF, although to a smaller extent.
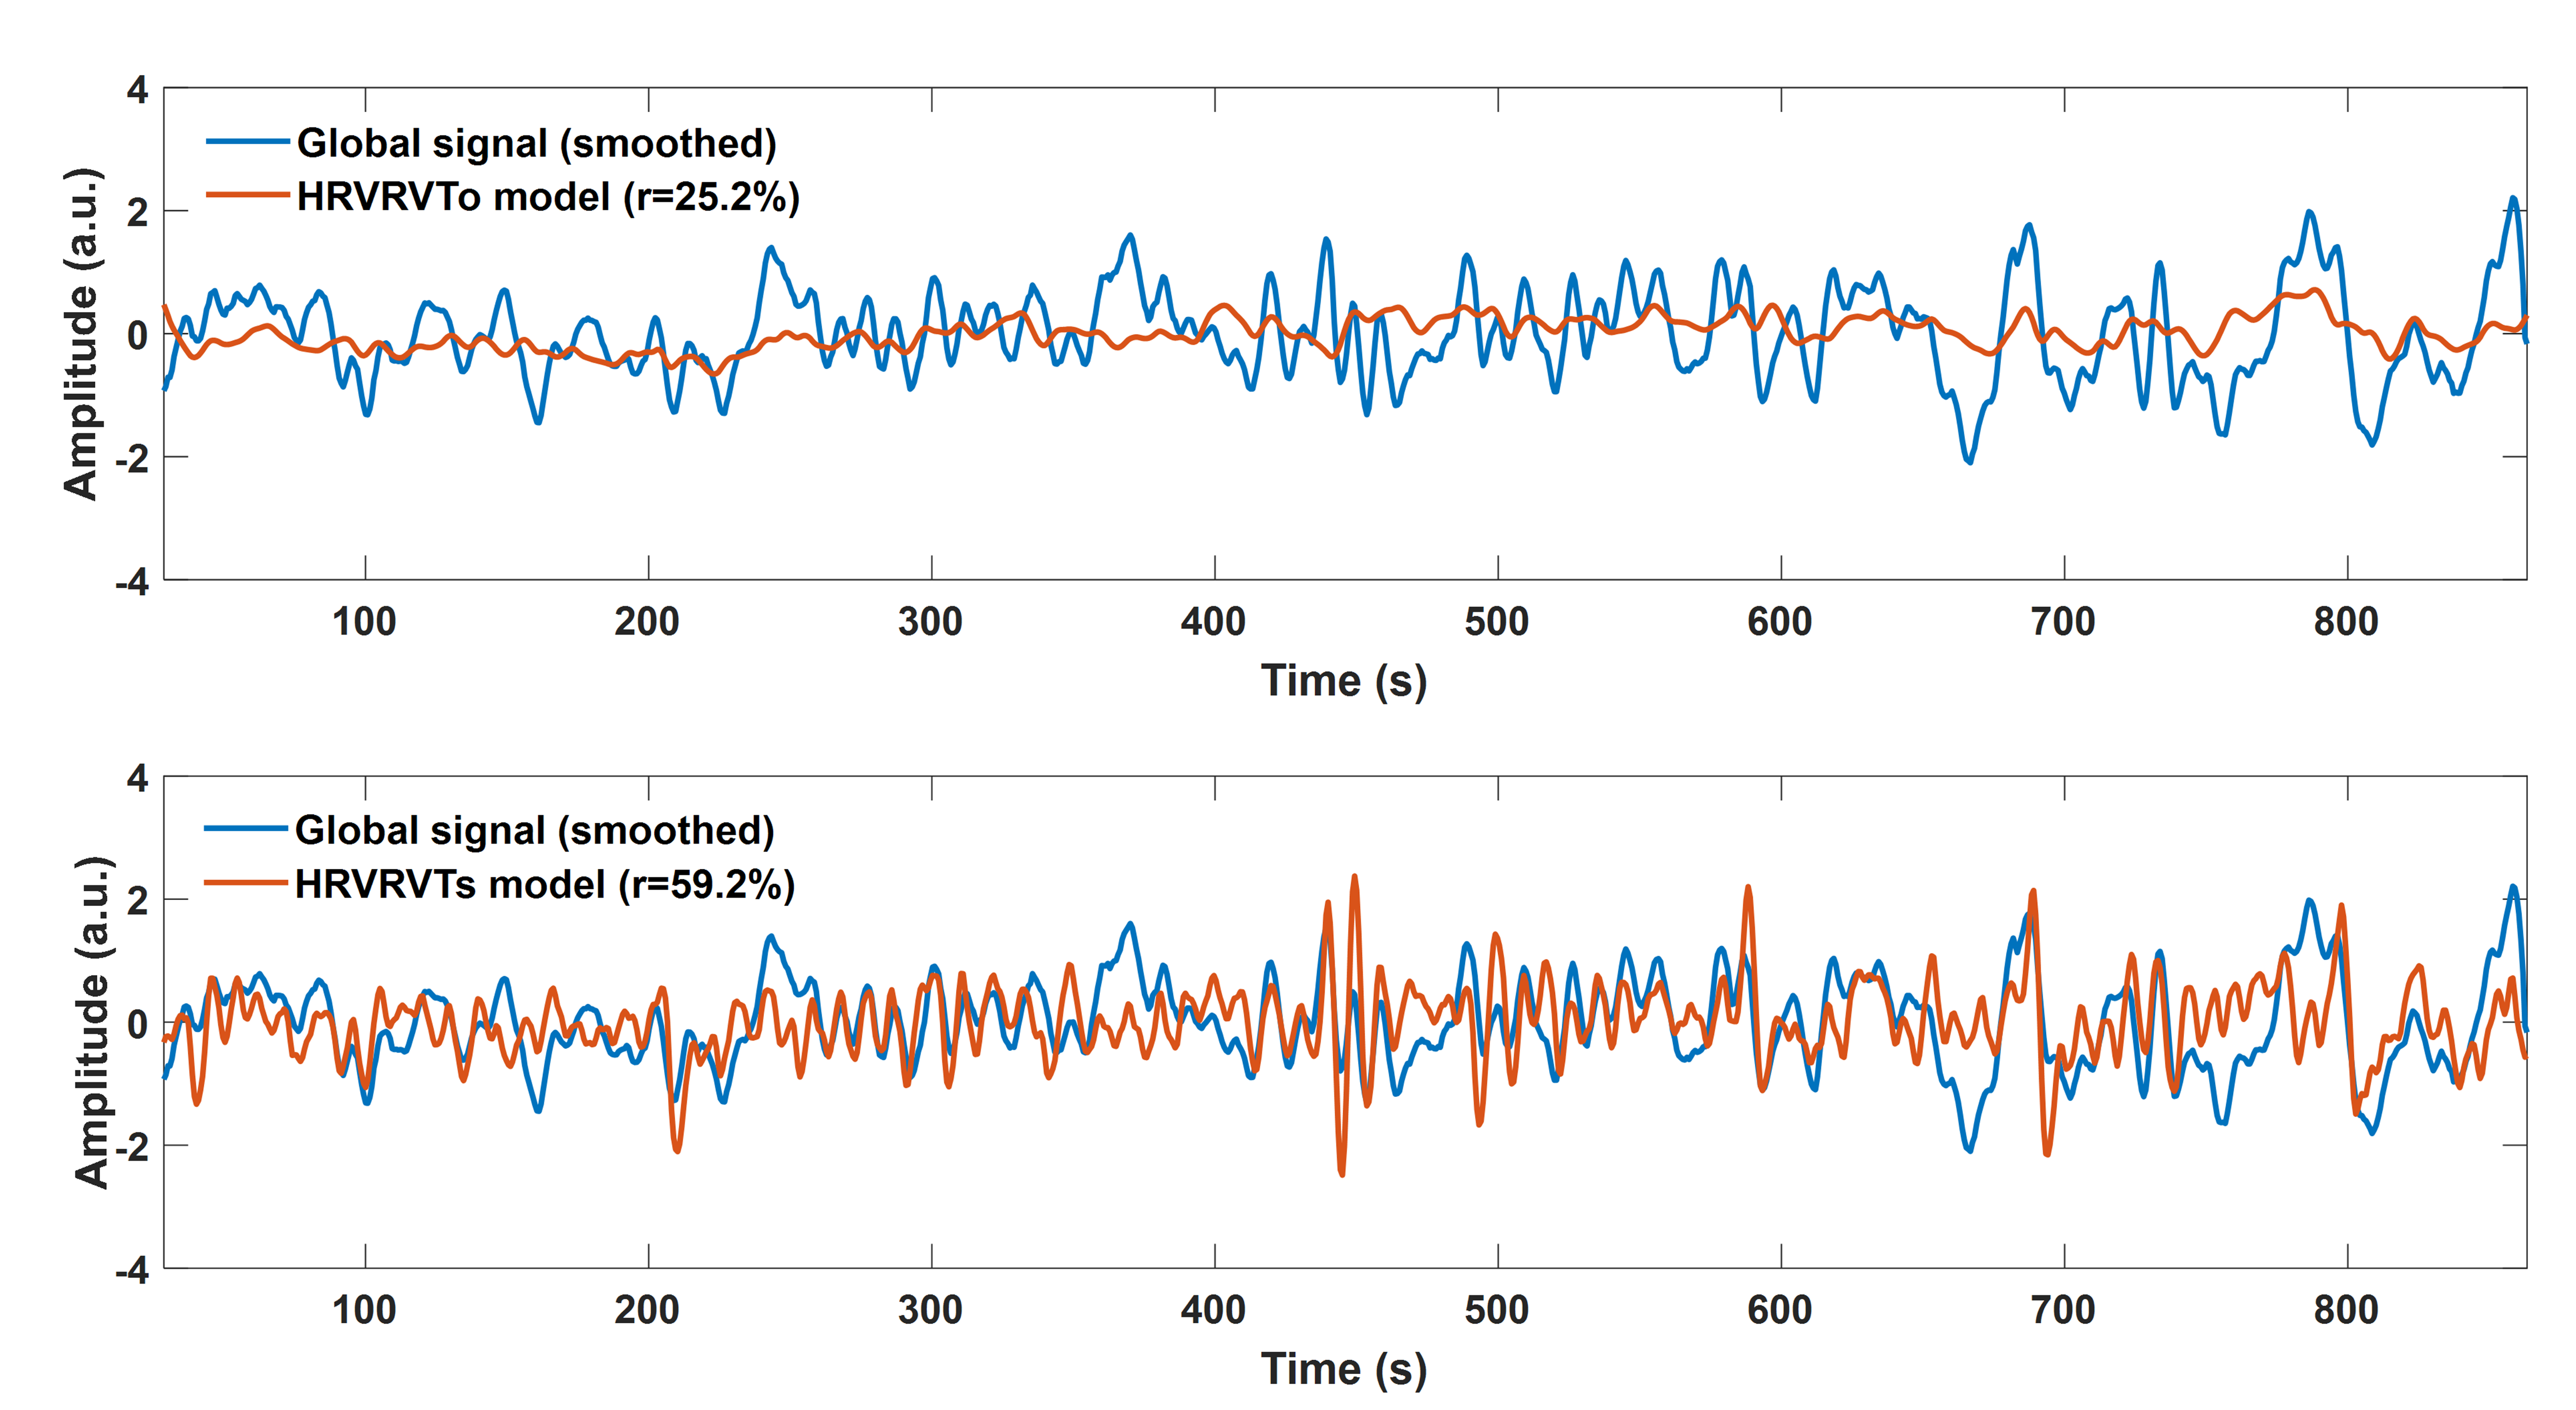
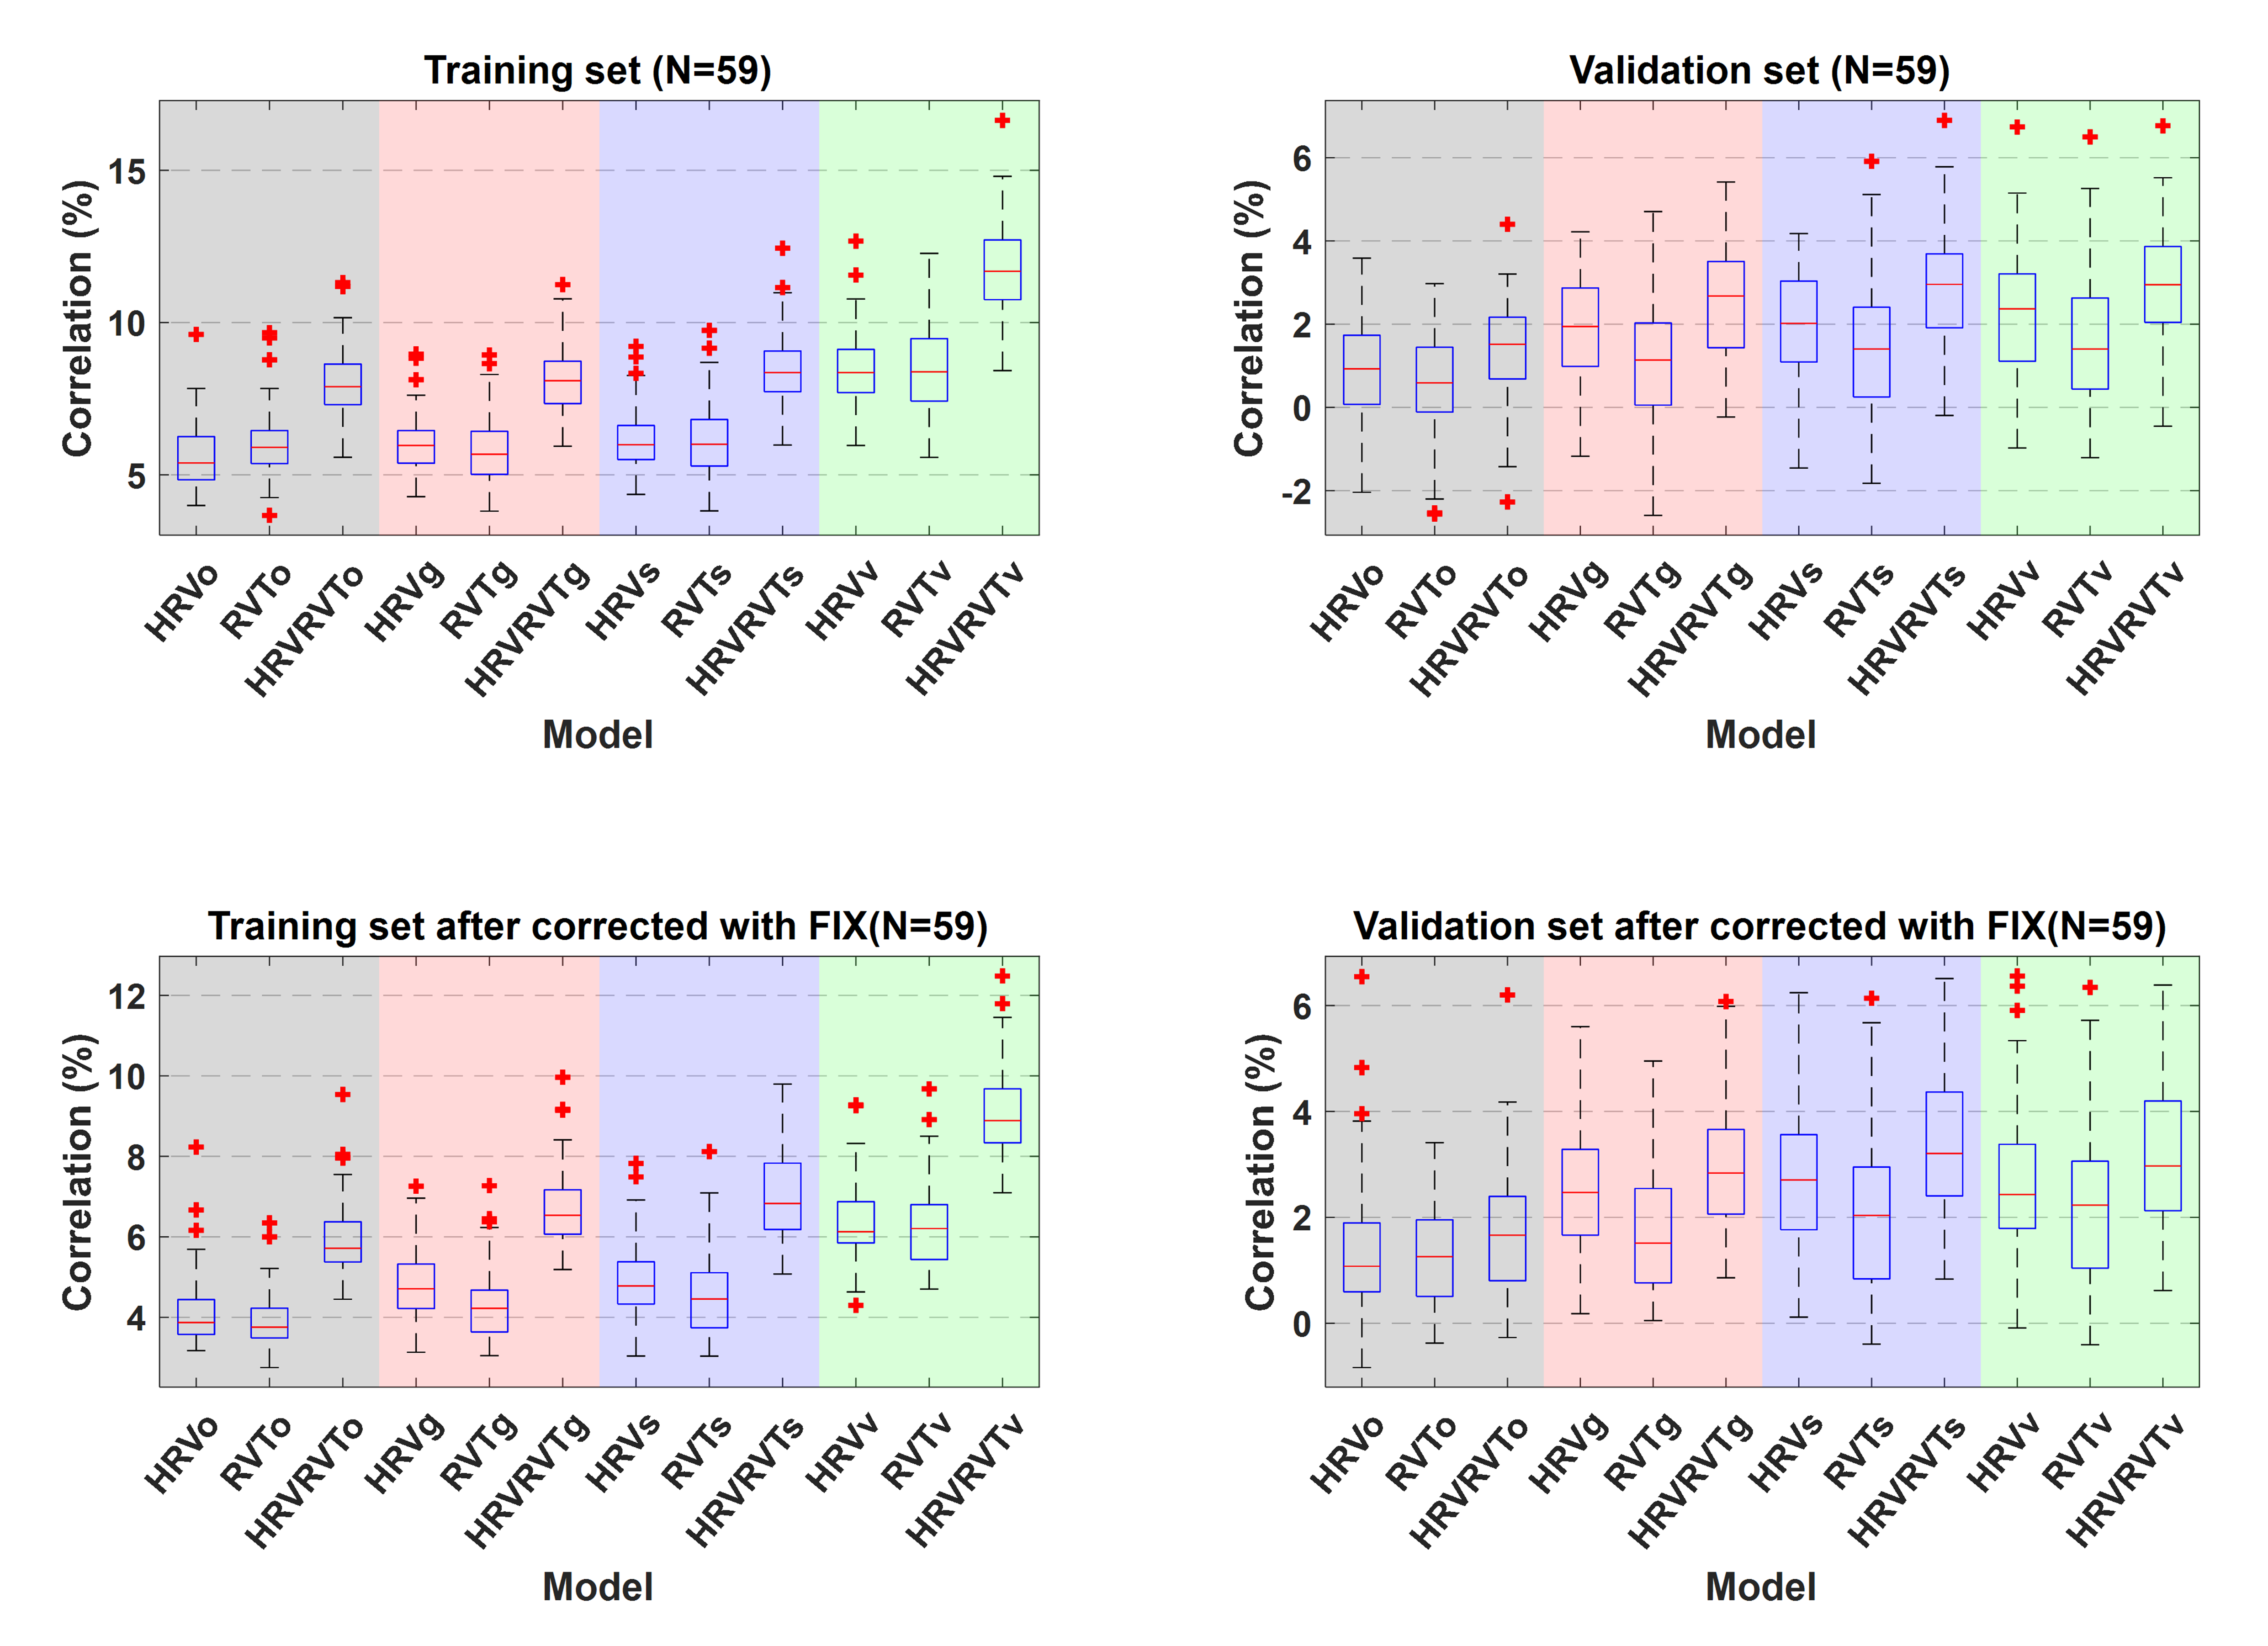
In Fig.2, based on the cross-validation analysis, we observe that the PRFs obtained from the data achieve better performance than the canonical PRFs. The scan-specific PRFs demonstrate a significantly better fit than the canonical and group-specific PRFs, while the voxel-specific PRFs yield slightly lower values than the scan-specific PRFs. Note also that for all categories, HRV explains significantly more variance compared to RVT.
CONCLUSION
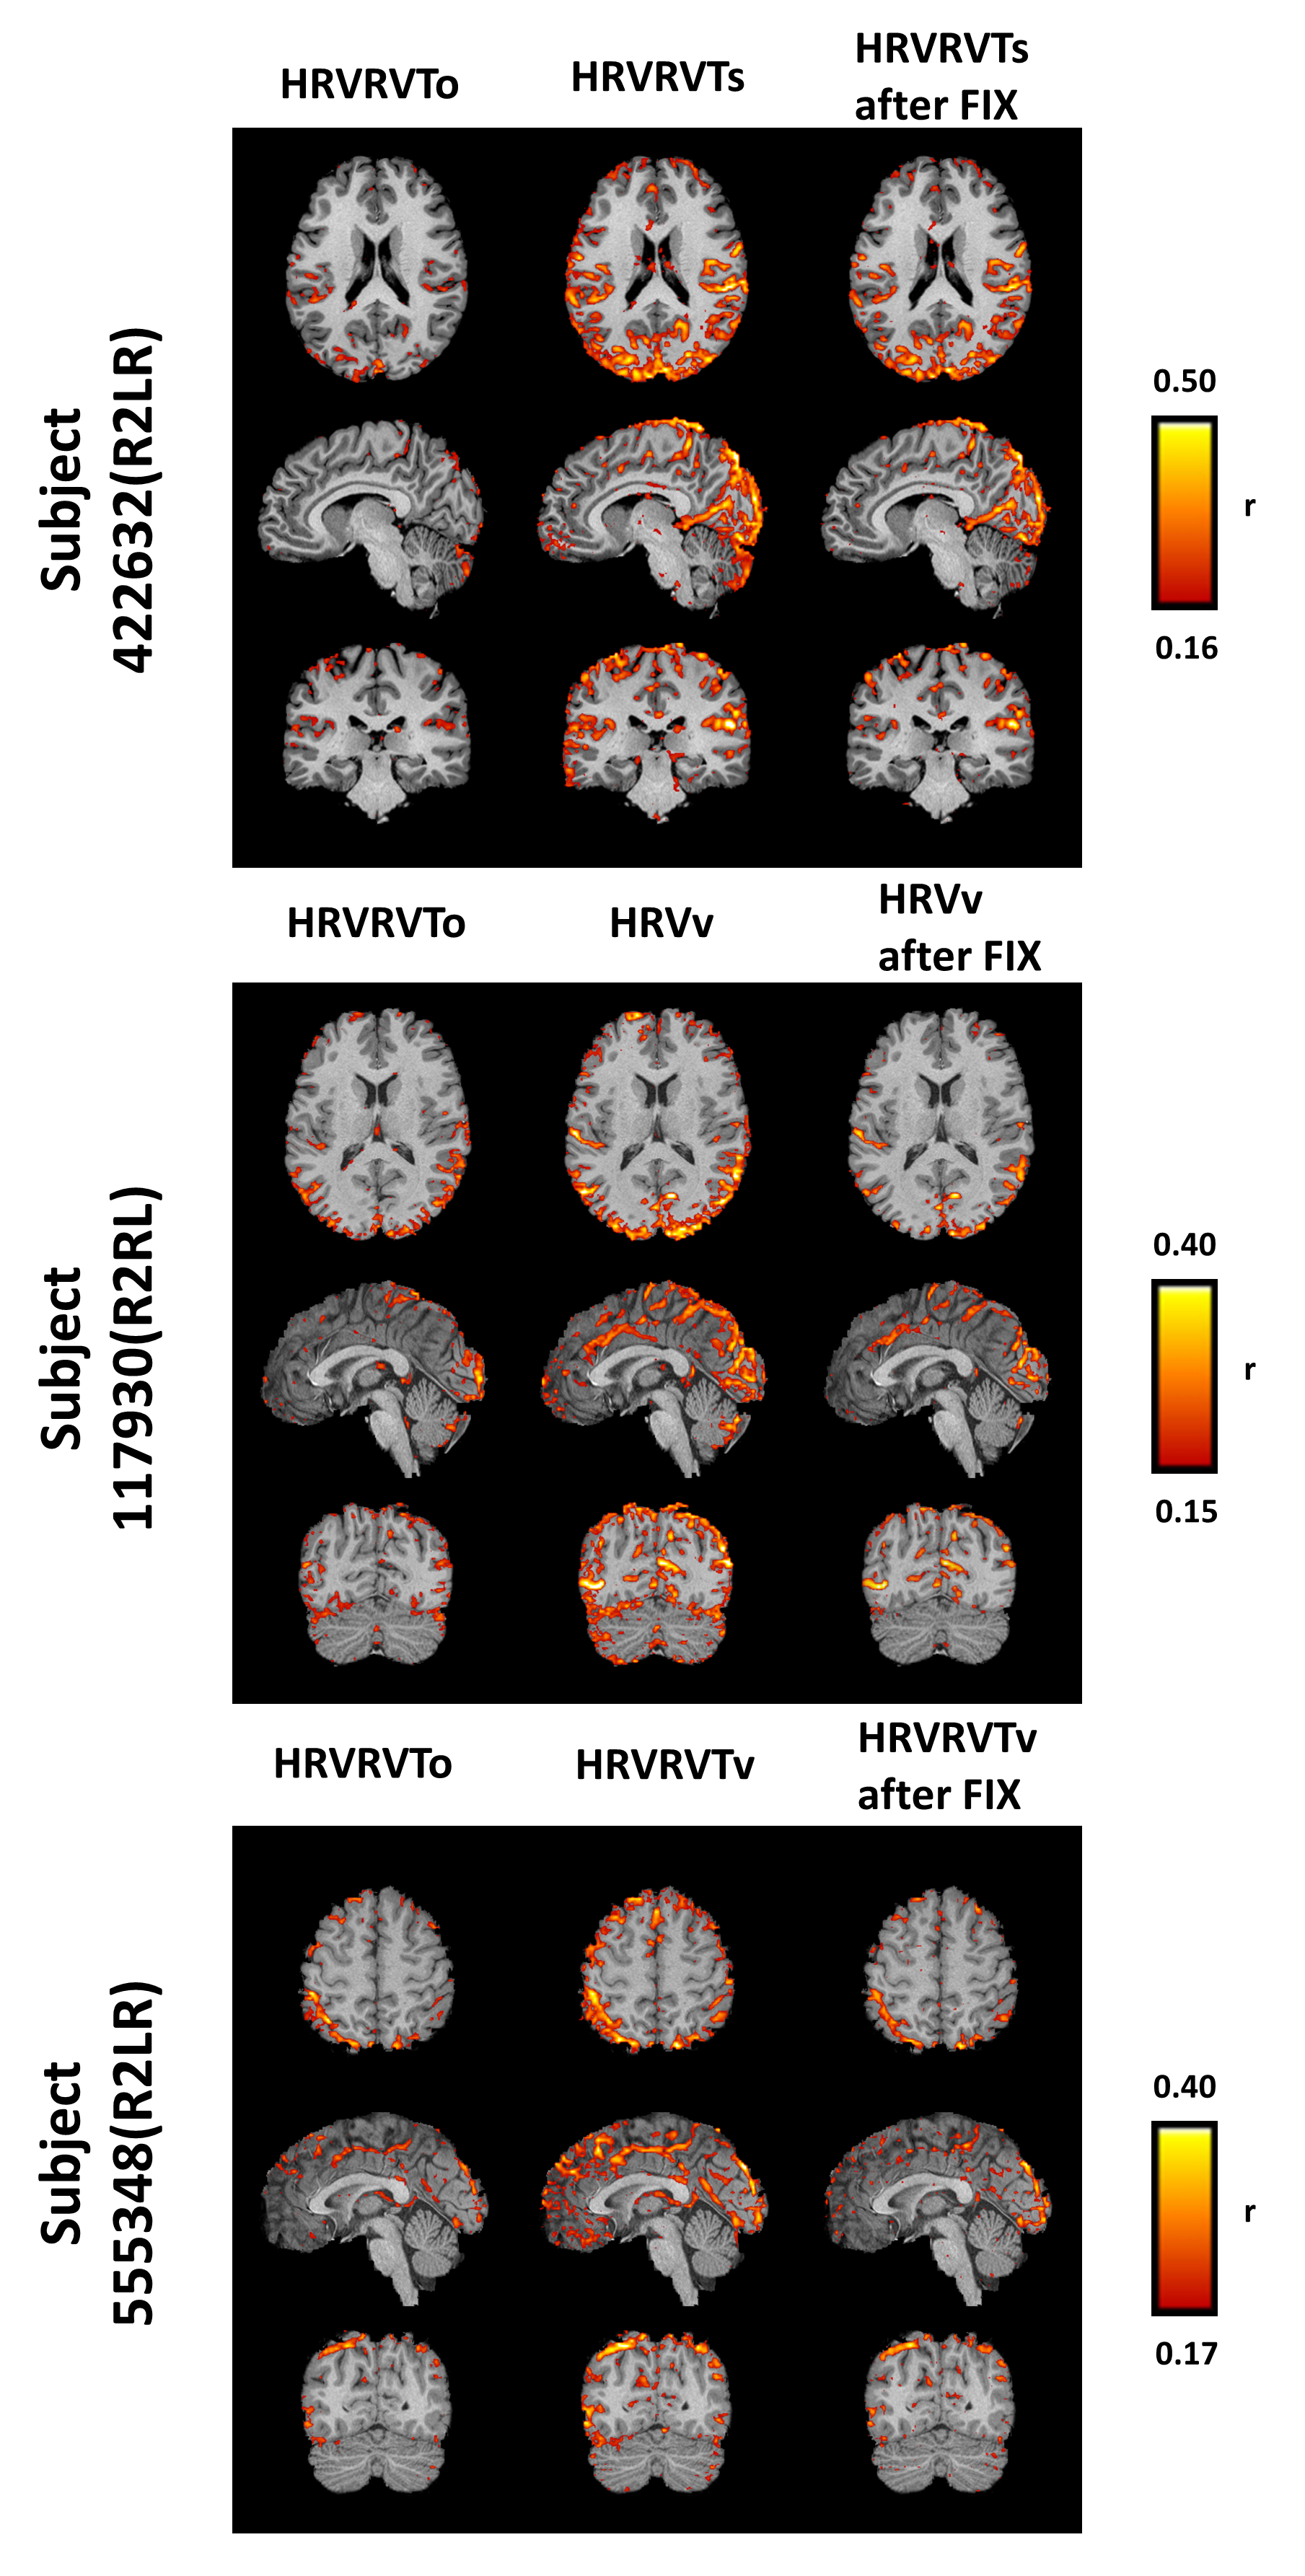
In this study, a new approach is proposed for estimating the CRF and RRF, which exploits the fact that a significant component of the GS is physiological. Our results show that, using this method, global physiological artifacts are better removed without explicitly regressing the global signal from the fMRI data.Acknowledgements
No acknowledgement found.References
[1] R. M. Birn, K. Murphy, and P. A. Bandettini, “The effect of respiration variations on independent component analysis results of resting state functional connectivity,” Hum. Brain Mapp., 2008.
[2] F. Nikolaou, C. Orphanidou, P. Papakyriakou, K. Murphy, R. G. Wise, and G. D. Mitsis, “Spontaneous physiological variability modulates dynamic functional connectivity in resting-state functional magnetic resonance imaging.,” Philos. Trans. A. Math. Phys. Eng. Sci., vol. 374, no. 2067, p. 20150183-, 2016.
[3] C. Chang, J. P. Cunningham, and G. H. Glover, “Influence of heart rate on the BOLD signal: The cardiac response function,” Neuroimage, vol. 44, no. 3, pp. 857–869, 2009.
[4] R. M. Birn, M. a. Smith, T. B. Jones, and P. a. Bandettini, “The respiration response function: The temporal dynamics of fMRI signal fluctuations related to changes in respiration,” Neuroimage, vol. 40, no. 2, pp. 644–654, Apr. 2008.
[5] R. M. Birn, J. B. Diamond, M. A. Smith, and P. A. Bandettini, “Separating respiratory-variation-related fluctuations from neuronal-activity-related fluctuations in fMRI.,” Neuroimage, vol. 31, no. 4, pp. 1536–48, Jul. 2006.
[6] J. D. Power, M. Plitt, T. O. Laumann, and A. Martin, “Sources and implications of whole-brain fMRI signals in humans,” Neuroimage, vol. 146, no. October 2016, pp. 609–625, 2017.
[7] C. W. Wong, P. N. DeYoung, and T. T. Liu, “Differences in the resting-state fMRI global signal amplitude between the eyes open and eyes closed states are related to changes in EEG vigilance,” Neuroimage, vol. 124, pp. 24–31, 2016.
[8] M. F. Glasser, S. N. Sotiropoulos, J. A. Wilson, T. S. Coalson, B. Fischl, J. L. Andersson, J. Xu, S. Jbabdi, M. Webster, J. R. Polimeni, D. C. Van Essen, and M. Jenkinson, “The minimal preprocessing pipelines for the Human Connectome Project,” Neuroimage, vol. 80, pp. 105–124, 2013.
[9] L. Davis, “Handbook of genetic algorithms,” 1991.
[10] G. Salimi-Khorshidi, G. Douaud, C. F.
Beckmann, M. F. Glasser, L. Griffanti, and S. M. Smith, “Automatic denoising of
functional MRI data: Combining independent component analysis and hierarchical
fusion of classifiers,” Neuroimage, vol. 90, pp. 449–468, 2014.
Figures