2332
Cardiac-Gated 4-Echo Spiral Sequence for ME-ICA Denoising of fMRI Data1Bioengineering, Stanford University, Stanford, CA, United States, 2Radiology, Stanford University, Stanford, CA, United States
Synopsis
One challenge in fMRI is separating neuronal from artifactual signal fluctuations. Recent developments in multi-echo fMRI (ME-fMRI) have enabled such classification by examining the TE-dependence of each component after ICA. However, ME-fMRI needs short readouts to fit multiple echoes before signal decay, requiring sparse sampling for EPI-sequences. Here we present our cardiac-gated 4-echo spiral sequence, which allows for short echo time and readout duration, which maximizes SNR and BOLD contrast. We were able to identify and remove T1-artifacts resulting from cardiac-gating’s variable-TR, an essential aspect for applications such as spinal cord fMRI, where cardiac-gating is required to remove CSF pulsation effects.
Introduction
Recent developments in multi-echo fMRI (ME-fMRI), e.g. ME-ICA, have demonstrated improved fidelity and interpretability of fMRI.1-3 Given information on how signals from each source scale across echo times (TEs), ME-fMRI gives insight to whether the fMRI signals originate from BOLD-contrast or non-BOLD artifacts. The BOLD-signal change can be approximated as
$$\Delta S/S =\Delta S_0/S_0-\Delta{R_2}^*TE$$
Hence, the percent signal change from BOLD signals will demonstrate a strong linear TE-dependence; components without strong TE-dependence can be removed as noise. One application where denoising is crucial is spinal cord fMRI where cardiac-cycle-induced motion from CSF pulsation severely degrades image quality. Cardiac-gating can significantly improve tSNR, but the drawbacks include large signal fluctuation resulting from T1-effects due to variable-TR.4
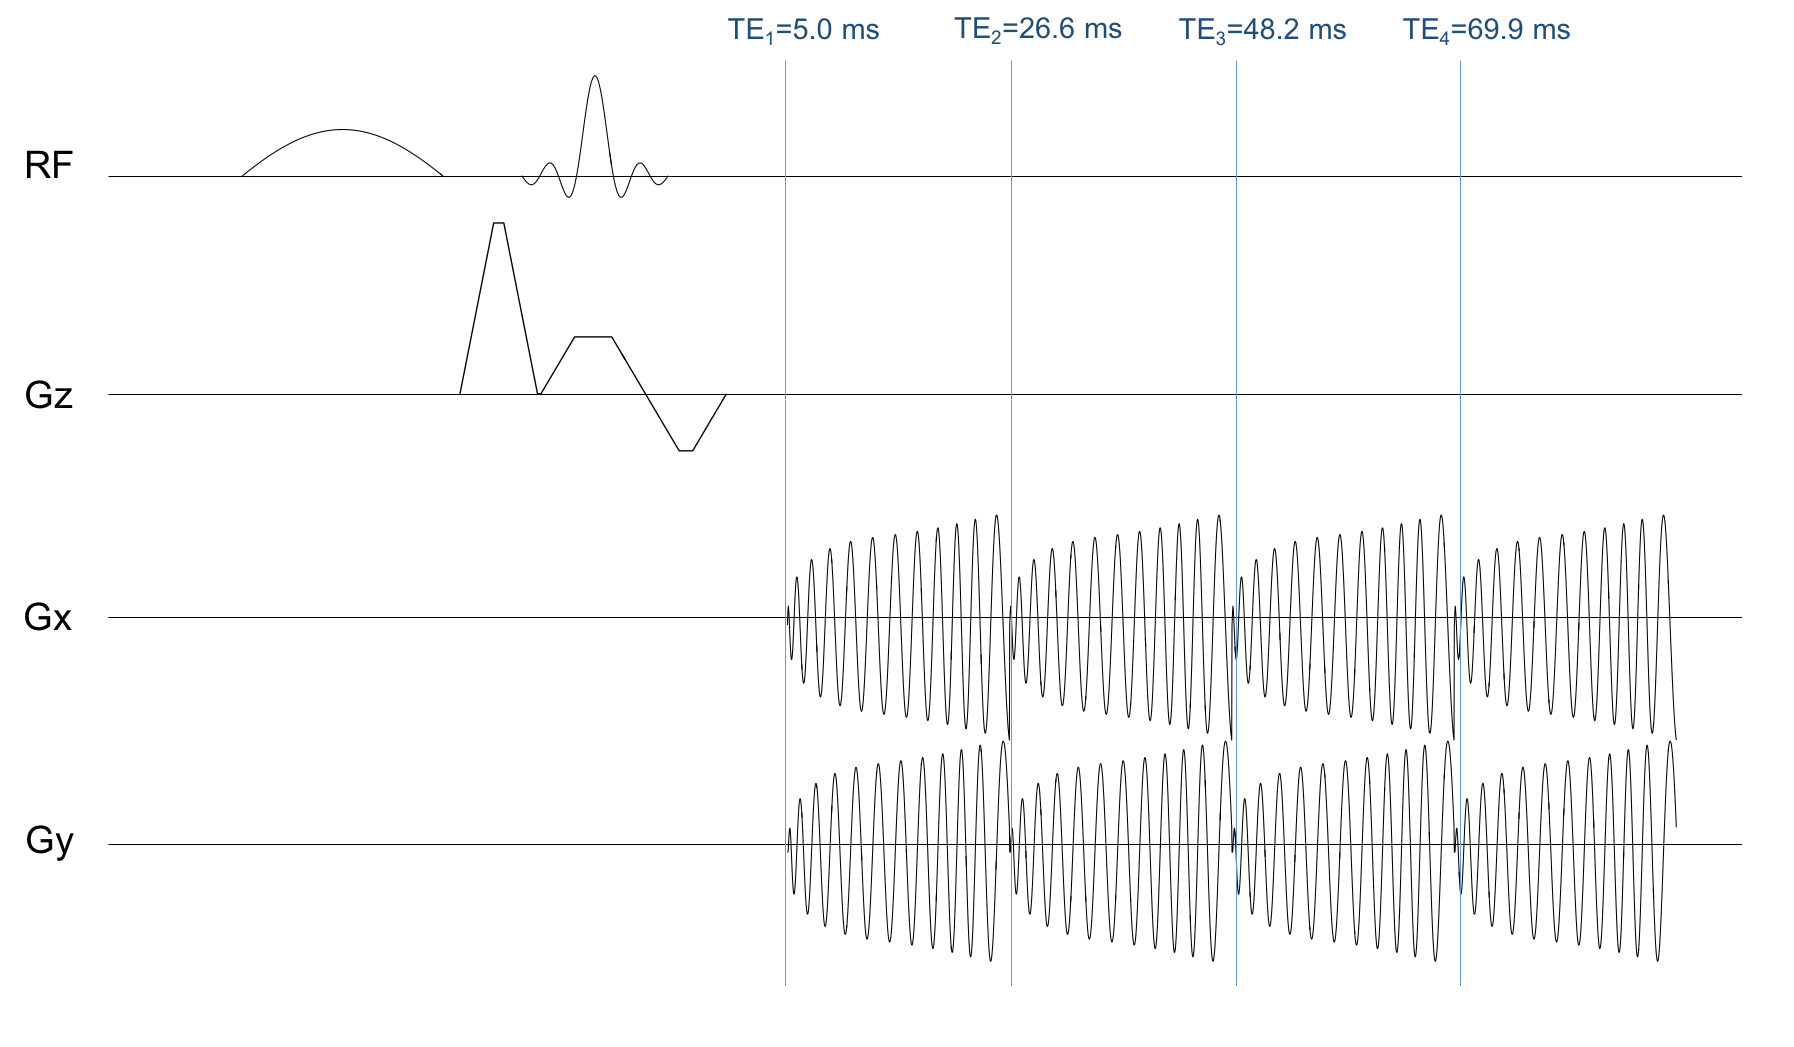
Despite the gain in information from using ME-fMRI, this technique is still not standard. One of the main costs is an increase in TR and reduction in number of time frames due to acquiring extra echoes after the usual TE~T2*. Furthermore, only a few echoes can be acquired with few-shot acquisitions before the SNR drops significantly, requiring SNR-reducing sparse sampling such as parallel-imaging to shorten EPI readouts. We present a custom 4-echo spiral sequence (Fig.1) for ME-fMRI. This sequence takes advantage of spiral readout’s more efficient use of gradient performance, fitting in 4 echoes without parallel-imaging. Additionally, the short TE (~5ms) of the first echo contains most of the information at high SNR, which helps delineate T1-fluctuations from blood-inflow or variable-TR from cardiac-gating. By identifying and removing these non-BOLD effects in spinal cord fMRI applications using ME-fMRI, we can improve detection sensitivity and reliability. In this abstract, we demonstrate the use of our 4-echo spiral sequence to separate BOLD activation from T1-fluctuations in the brain based on the ME-ICA method.2,3
Methods
Data from healthy volunteers was acquired on a 3T-GE-Discovery MR-750 scanner with IRB approval, where the scan plane was oriented to capture the visual and motor cortex in 13 slices. The scan parameters were: TE1/TE2/TE3/TE4=5.0/26.6/48.2/69.9ms, pixel-size=3.1x3.1mm, slice-thickness=4mm, gap=0.5mm. The fMRI experiment, a block-trial paradigm of 15s-on/15s-off, consists of a sensory-motor task with a contrast-reversing checkerboard visual stimulus and plungers for passive finger tapping. Cardiac-gating was implemented by triggering the scanner every 2 heartbeats (R-R intervals) as measured by the scanner’s photoplethysmograph. The cardiac-gated data was resampled to a TR of 2s, and the four echoes were combined with the following weights5 for optimal contrast:
$$w({T_2}^*)_n=\frac{TE_n e^{-TE/{T_2}^*}}{\sum_n TE_n e^{-TE/{T_2}^*}}$$
where $$$n$$$ is echo number and $$$T_2^*$$$ for each voxel is estimated from a log-linear fit to the exponential signal decay equation (along with S0). The optimally-combined time series was then fed into MELODIC6 in FSL for ICA. To calculate percent signal change for each echo and each independent component (IC), the echo was projected onto the IC and normalized by the echo’s time series mean. ICs with no TE-dependence were classified as artifacts and ICs with strong linear TE-dependence were classified as BOLD signals. GLM analysis was performed to generate t-score maps for fMRI activation. A SPGR T1-model was generated from the recorded cardiac-gating timings for comparison with IC time series using an estimated T1=1350ms and flip-angle=80$$$^{\circ}$$$.
Results and Discussion
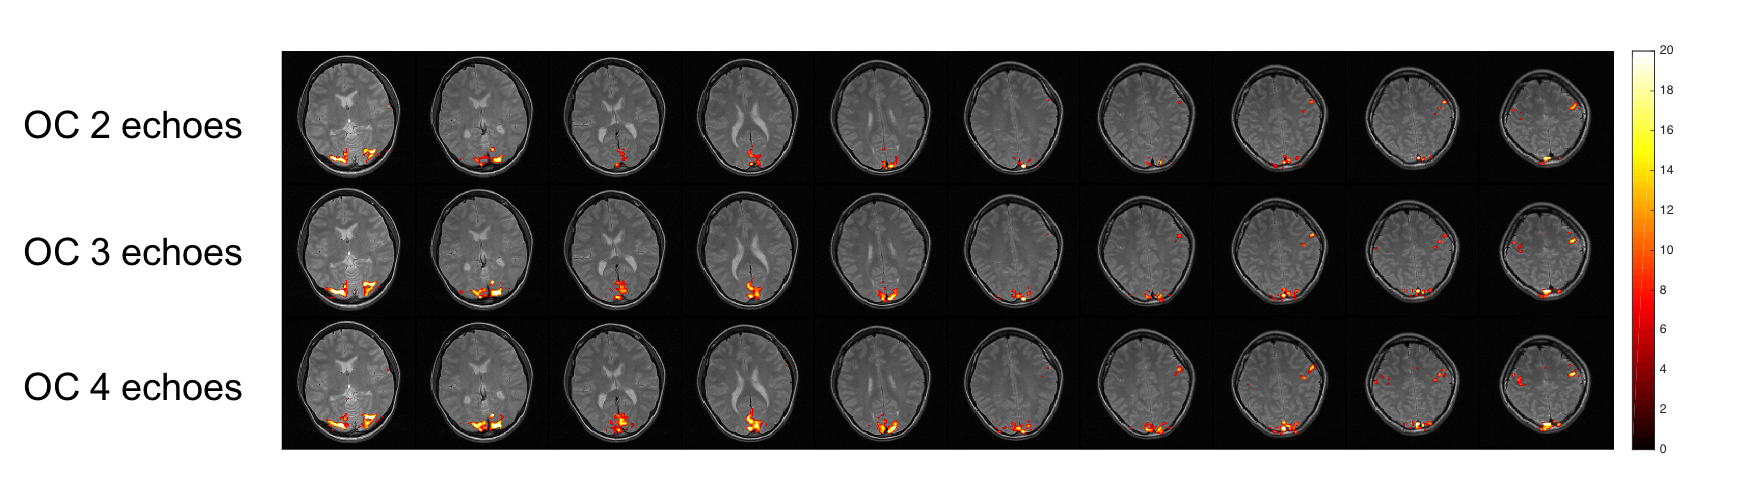
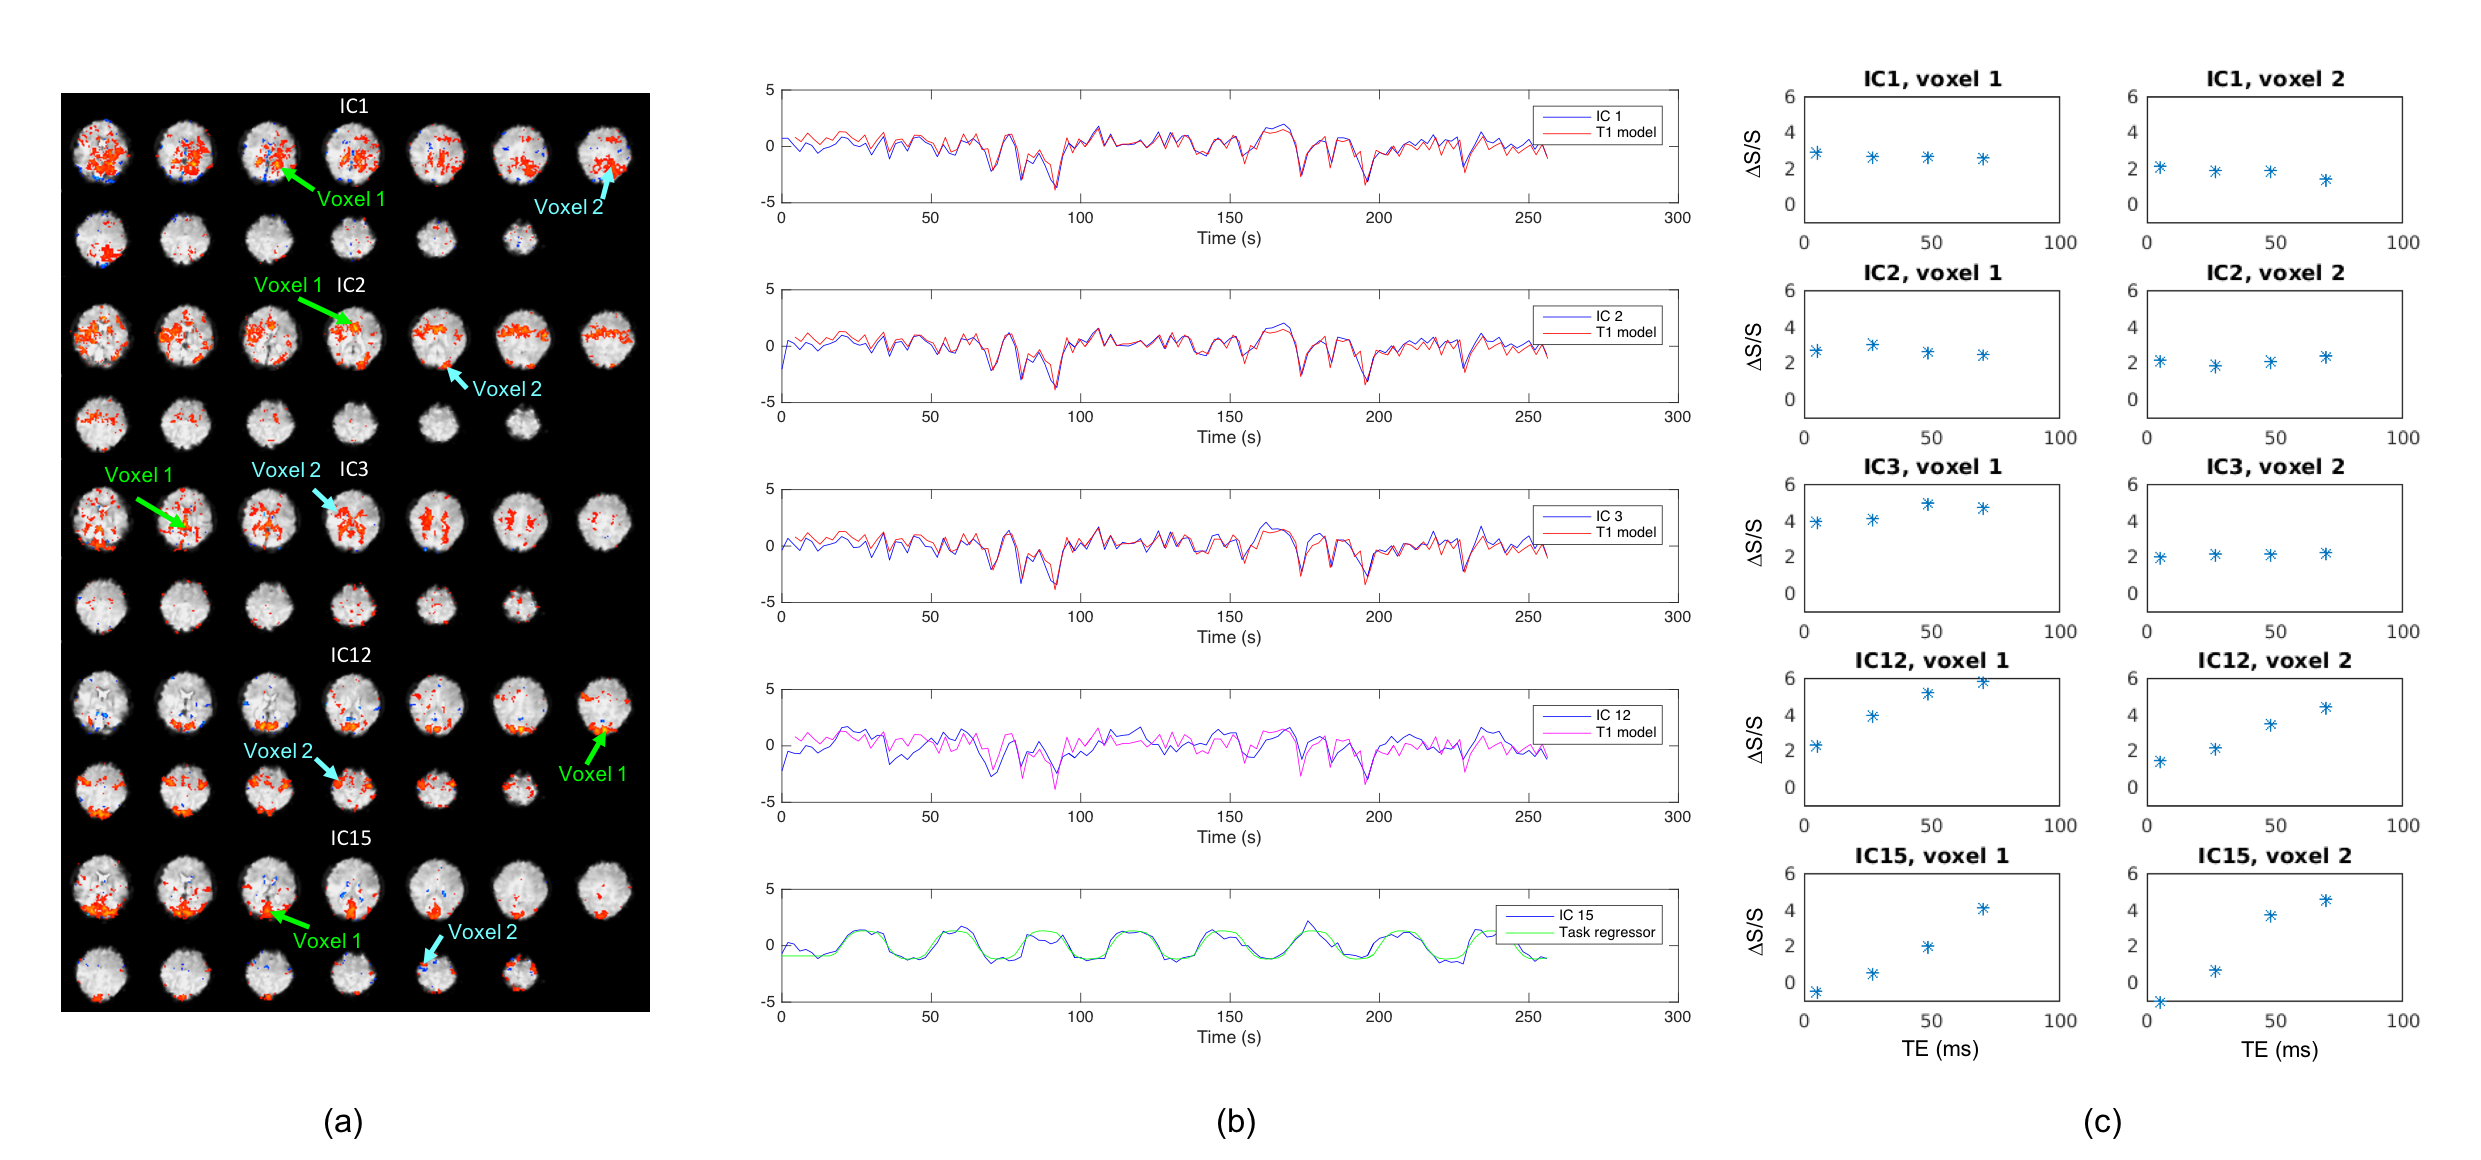
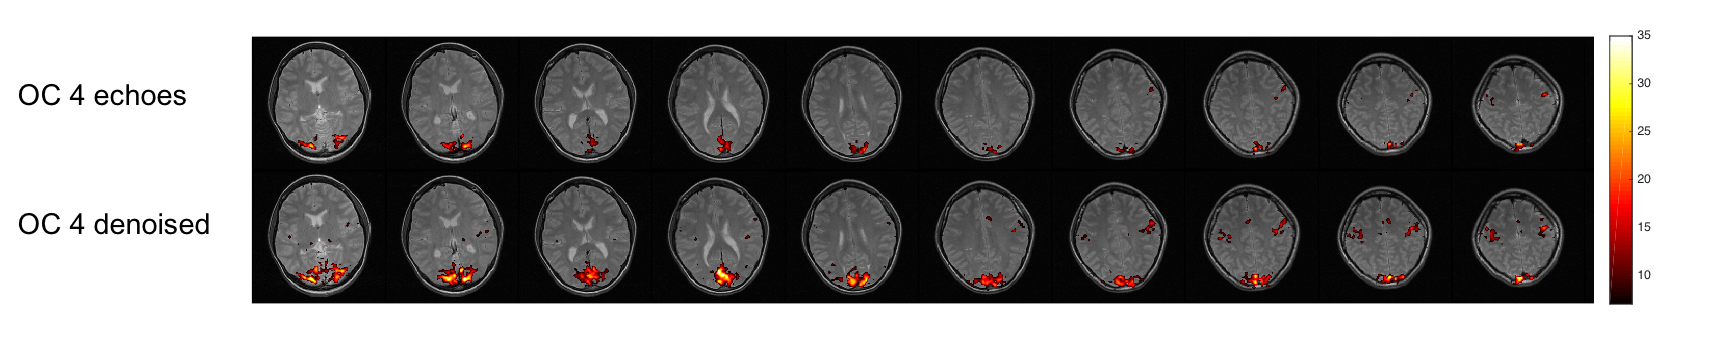
As shown in Fig.2, combining more echoes using the weights in Eq.2 resulted in an increase in BOLD contrast. Hence, we fed the optimally combined 4-echo time series into MELODIC for ICA analysis. The first few independent components (ICs) mimic the T1-model quite well (Fig.3), indicating that they are artifacts from cardiac gating. The percent signal changes from these ICs were not TE-dependent, further confirming that these signal fluctuations are not of BOLD origin. The separation of these T1-components into different ICs is likely due to the different T1s of different tissues in the brain. IC15 follows the task regressor; its clear linear dependence of TE further verifies its BOLD origin. There are some ICs, e.g. IC12, that are not as clear cut that seem to have high T2* contributions (linear TE-dependence) but also some S0 contributions (constant). These components may be further analyzed with statistical programs such as AFNI’s tedana.py1,2,7 to calculate the kappa and rho summary metrics. Here, we regressed out the first three ICs from the optimally combined 4-echo time series for our GLM analysis. As expected, the t-score maps of the denoised time series indicate higher sensitivity (Fig.4).Conclusion
In this study, we have demonstrated that the short readouts of our multi-echo spiral sequence makes ME-fMRI possible without parallel imaging; furthermore, it reliably detects and removes non-neural T1 signal fluctuations caused by variable TRs in our cardiac-gated dataset, increasing statistical power.Acknowledgements
This study was supported by GE Healthcare and NIH-P41EB01589.References
1. Kundu P, Voon V, Balchandani P, Lombardo MV, Poser BA, Bandettini PA. Multi-echo fMRI: A review of applications in fMRI denoising and analysis of BOLD signals. Neuroimage 2017;154:59-80.
2. Kundu P, Inati SJ, Evans JW, Luh WM, Bandettini PA. Differentiating BOLD and non-BOLD signals in fMRI time series using multi-echo EPI. Neuroimage 2012;60(3):1759-70.
3. Gonzalez-Castillo J, Panwar P, Buchanan LC, Caballero-Gaudes C, Handwerker DA, Jangraw DC, Zachariou V, Inati S, Roopchansingh V, Derbyshire JA and others. Evaluation of multi-echo ICA denoising for task based fMRI studies: Block designs, rapid event-related designs, and cardiac-gated fMRI. Neuroimage 2016;141:452-468.
4. Stroman PW, Wheeler-Kingshott C, Bacon M, Schwab JM, Bosma R, Brooks J, Cadotte D, Carlstedt T, Ciccarelli O, Cohen-Adad J and others. The current state-of-the-art of spinal cord imaging: methods. Neuroimage 2014;84:1070-81.
5. Posse S, Wiese S, Gembris D, Mathiak K, Kessler C, Grosse-Ruyken ML, Elghahwagi B, Richards T, Dager SR, Kiselev VG. Enhancement of BOLD-contrast sensitivity by single-shot multi-echo functional MR imaging. Magn Reson Med 1999;42(1):87-97.
6. Smith SM, Jenkinson M, Woolrich MW, Beckmann CF, Behrens TE, Johansen-Berg H, Bannister PR, De Luca M, Drobnjak I, Flitney DE and others. Advances in functional and structural MR image analysis and implementation as FSL. Neuroimage 2004;23 Suppl 1:S208-19.
7. Cox RW. AFNI: software for analysis and visualization of functional magnetic resonance neuroimages. Comput Biomed Res 1996;29(3):162-73.
Figures