2331
Functional MRI of the Letter Cancellation Test1Physical Sciences, Sunnybrook Research Institute, Toronto, ON, Canada, 2St. Michael's Hospital, Toronto, ON, Canada, 3University of Toronto, Toronto, ON, Canada
Synopsis
Letter cancellation test (LCT) variants are widely used pen-and-paper assessment tools in clinical and experimental psychology, but brain regions that mediate LCT performance are not well understood. An fMRI study involving elderly healthy volunteers was conducted to establish the neural correlates of the LCT using a highly novel fMRI-compatible tablet system that enables investigation of drawing behavior. The resultant brain activation highlighted parietal and frontal regions, consistent with existing fMRI literature on visual attention. This is the first fMRI study of the LCT and the results have relevance for future clinically-oriented fMRI studies of this test.
Introduction
LCT variants are widely used in clinical and research settings to probe attention, concentration, visual-spatial scanning abilities and associated dysfunctions. This type of pen-and-paper test involves the crossing out of a target letter from an array containing few targets and many foil letters. Brain regions mediating target cancellation have been suggested by lesion mapping studies in stroke patients using MRI and computed tomography1,2. To our knowledge, however, no task-based functional neuroimaging studies have been performed yet to corroborate and extend these findings. The present work thus aims to probe activity throughout the brain volume using fMRI, in a pertinent normative cohort of healthy elderly individuals. Pen-and-paper tests cannot be studied with high realism using standard fMRI methodology, but we were able overcome this difficulty using a highly novel fMRI-compatible computerized tablet developed by our lab3.Methods
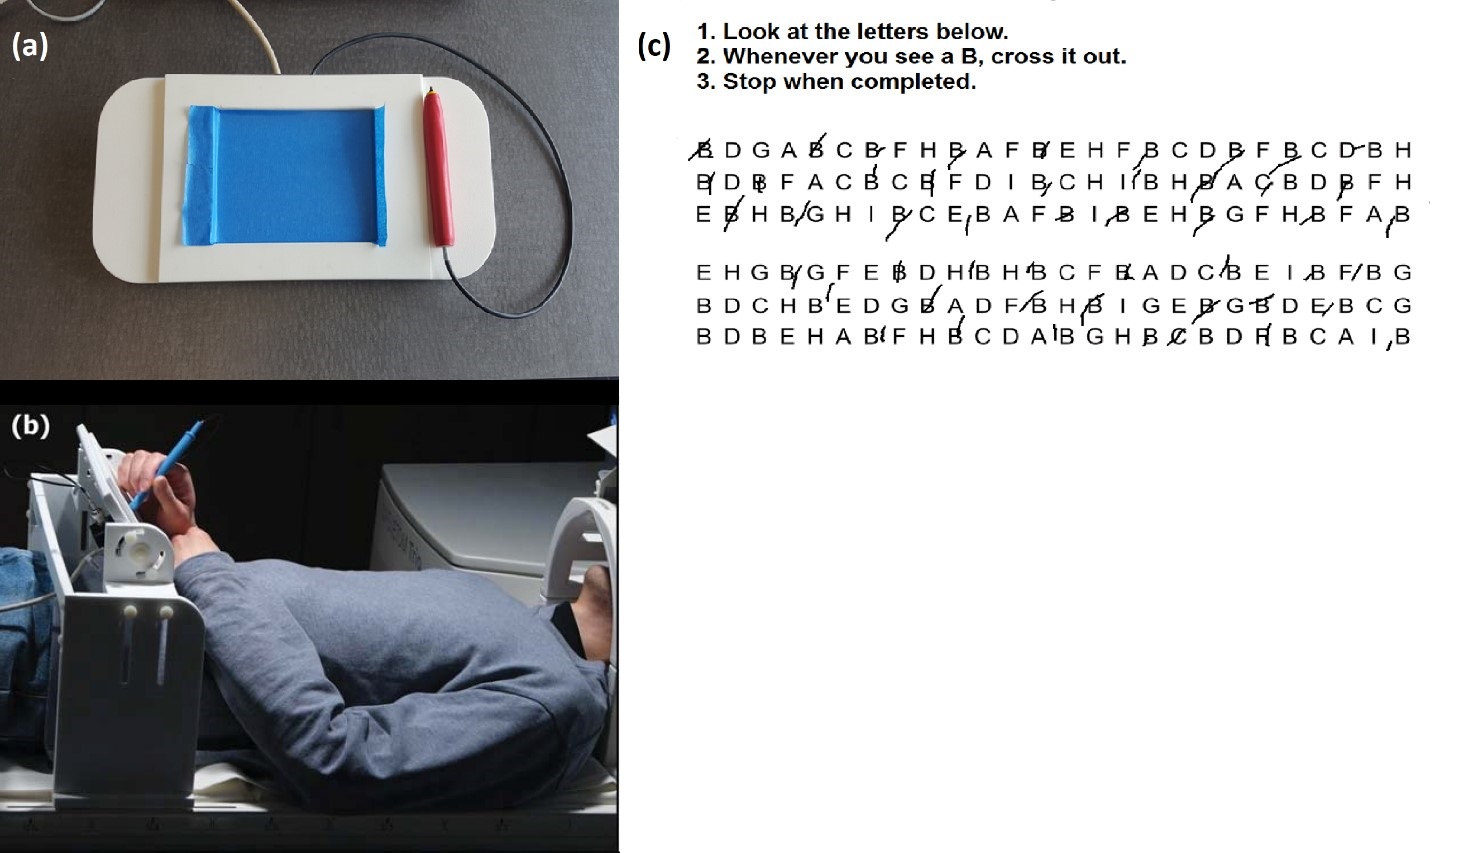
Fifteen healthy subjects (8 males; mean age 64.9 ± 1.5 years) participated in this ethically approved fMRI study and were imaged using a Siemens Skyra 3 T MRI system using our standard lab protocol4. Prior to fMRI, subjects performed the paper LCT and their completion time was recorded. A brief training session of writing and drawing tasks followed so that subjects could become proficient using the tablet in the magnet. Subjects then performed the tablet LCT during fMRI for a unique array of letters in five separate runs, each involving a different target letter, with instructions to cross out (as fast as possible while maintaining accuracy) all instances of the target letter in the array provided. Each LCT task block had a fixed duration of 60 s. Task blocks were separated by 20 s periods of visual fixation. Figure 1 shows the tablet setup and illustrative LCT responses of a single subject during fMRI5.
The fMRI data were analyzed using Optimization of Preprocessing Pipelines for NeuroImaging (OPPNI) methodology6,7,8, Analysis of Functional NeuroImages (AFNI)9 and MRIcron10. Statistical parametric maps were calculated using a General Linear Model (GLM) and thresholded using the two-tailed False-Discovery Rate (FDR) to correct for multiple comparisons11.
Results
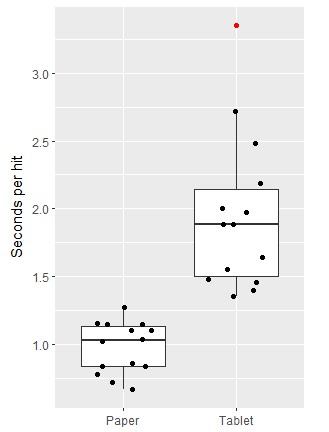
Subjects made both errors of omission (target letters not crossed out) as well as commission (non-target letters crossed out) when performing the tablet LCT. Overall, there were 3.2 ± 0.5 omissions (group mean ± SEM) and 1.9 ± 0.4 commissions, a statistically significant difference (p<0.01). Because not all subjects completed all tablet LCTs within the fixed block duration, comparison of errors and completion time was not attempted between paper and tablet versions of the LCT. Performance was compared instead using a “seconds per hit” metric. Figure 2 shows individual data as well as box and whisker plots of the behavioural results for both LCT versions, indicating that the subjects performed the tablet LCT significantly more slowly (p<0.001). The mean paper LCT performance was 0.98 ± 0.05 seconds per hit, and the mean tablet LCT performance was 1.95 ± 0.15 seconds per hit. A Spearman’s rank-order correlation with bootstrapping showed no significant correlation between subject performance on paper and on the tablet (rs = 0.20, p = 0.48).
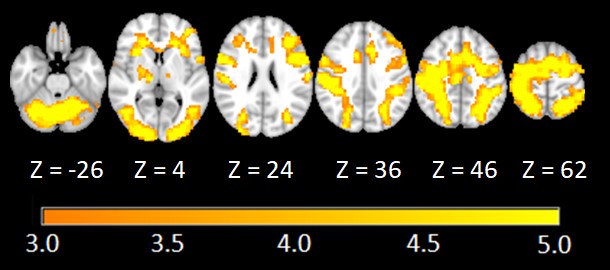
Figure 3 shows the statistical brain maps of selected slice locations for the LCT vs. fixation contrast. Activity primarily involved the cerebellum, occipital areas, middle temporal lobe, precentral gyrus, postcentral gyrus, frontal gyrus, insula, cingulate gyrus, supramarginal gyrus, parietal lobule, and supplementary motor area.
Discussion
Use of the tablet affected the ability of subjects to perform the LCT compared to performance on paper. For example, the tablet resulted in elevated and more variable time to strike out letters on a “per hit” basis. The differences between paper and tablet results could arise from multiple factors such as intrinsic subject variability in task performance, and subject variability in ease of interactivity with the tablet. Regarding brain activation, the letter vs. fixation contrast activated various parietal regions of the brain, consistent with lesion studies in which patients were impaired in cancellation tasks1. This suggests that our results include activation that is crucial to LCT performance. The frontal and parietal regions that showed activation were also consistent with regions known to be involved in spatial guidance towards attentional targets12.Conclusion
The present results help to clarify the regional brain activity that supports LCT performance in healthy elderly individuals. Study limitations include the small sample size over the age range, and therefore a replication effort will be required using the same robust analysis procedures. Overall, the results are sufficiently strong to consider using the tablet to evaluate LCT performance and brain activity in other pertinent cohorts, such as elderly patients with age-related brain dysfunction.Acknowledgements
The authors would like to acknowledge grant support from the Heart and Stroke Foundation of Canada.References
- Molenberghs P, Sale MV and Mattingley JB (2012) Is there a critical lesion site for unilateral spatial neglect? A meta-analysis using activation likelihood estimation. Front. Hum. Neurosci. 6:78.
- Molenberghs P, Sale MV (2011) Testing for Spatial Neglect with Line Bisection and Target Cancellation: Are Both Tasks Really Unrelated? PLoS ONE 6(7): e23017.
- Karimpoor M, Tam F, Strother SC, Fischer CE, Schweizer TA and Graham SJ (2015) A computerized tablet with visual feedback of hand position for functional magnetic resonance imaging. Front. Hum. Neurosci. 9:150.
- Churchill NW, Hutchison MG, Richards D, Leung G, Graham SJ, Schweizer TA (2017) Neuroimage: Clinical 14:480-489.
- Tam F, Churchill NW, Strother SC, Graham SJ (2011) A New Tablet for Writing and Drawing During Functional MRI. Human Brain Mapping 32:240–248.
- Churchill NW, Oder A, Abdi H, Tam F, Lee W, Thomas C, Ween JE, Graham SJ, Strother SC (2012a) Optimizing preprocessing and analysis pipelines for single‐subject fMRI. I. Standard temporal motion and physiological noise correction methods. Human brain mapping, 33(3):609-627.
- Churchill NW, Yourganov G, Oder A, Tam F, Graham SJ, Strother SC (2012b): Optimizing preprocessing and analysis pipelines for single-subject fMRI: 2. Interactions with ICA, PCA, task contrast and inter-subject heterogeneity. PLoS One 7(2): p.e31147.
- Churchill NW, Spring R, Afshin-Pour B, Dong F, Strother SC (2015): An automated, adaptive framework for optimizing preprocessing pipelines in task-based functional MRI. PLoS One, 10(7): p.e0131520.
- RW Cox (1996) AFNI: Software for analysis and visualization of functional magnetic resonance neuroimages. Computers and Biomedical Research, 29:162-173.
- Rorden C, Brett M (2000) Stereotaxic display of brain lesions. Behavioural Neurology, 12:191-200.
- Genovese CR, Lazar NA, Nichols T (2002) Thresholding of statistical maps in functional neuroimaging using the false discovery rate. Neuroimage, 15(4):870-878.
- Baars BJ, Gage NM (2007): Cognition, Brain, and Consciousness. Elsevier Academic Press. 1st Edition: 238.
Figures