2330
ICA cleanup for improved SNR in arterial spin labeling perfusion MRI1USC Stevens Institute for Neuroimaging and Informatics, Keck School of Medicine at USC, University of Southern California, Los Angeles, CA, United States, 2Institute of Radiopharmaceutical cancer research, Helmholtz-Zentrum Dresden-Rossendorf, Dresden, Germany, 3Department of Radiology and Nuclear Medicine, Academic Medical Center, Amsterdam, Netherlands, 4Cardiology and Radiology, Children's Hospital of Los Angeles, Los Angeles, CA, United States
Synopsis
We evaluate the use of Independent Component Analysis (ICA) to separate physiological and other noise from Arterial Spin Labeling (ASL) perfusion MRI as has been shown for BOLD fMRI. We show that this approach improves tSNR and cerebral blood flow (CBF) quantification in a cohort of healthy young controls and a group of children with sickle cell disease.
Introduction
Arterial spin labeling (ASL) is a non-invasive MRI modality that can provide insight in brain hemodynamics. One main limiting factor of ASL is its relatively low signal-to-noise ratio (SNR). New technical developments like 3D readouts and background suppression have improved SNR [1] and additional post processing steps including noise regression methods can further improve temporal SNR (tSNR) [2]. We hypothesize that Independent Component Analysis (ICA) should provide separation of physiological noise from signal and thus improving SNR and cerebral blood flow (CBF) quantification as has been shown for BOLD fMRI. Therefore, in this study, we evaluated the use of ICA to separate perfusion signal from noise in ASL data.Methods
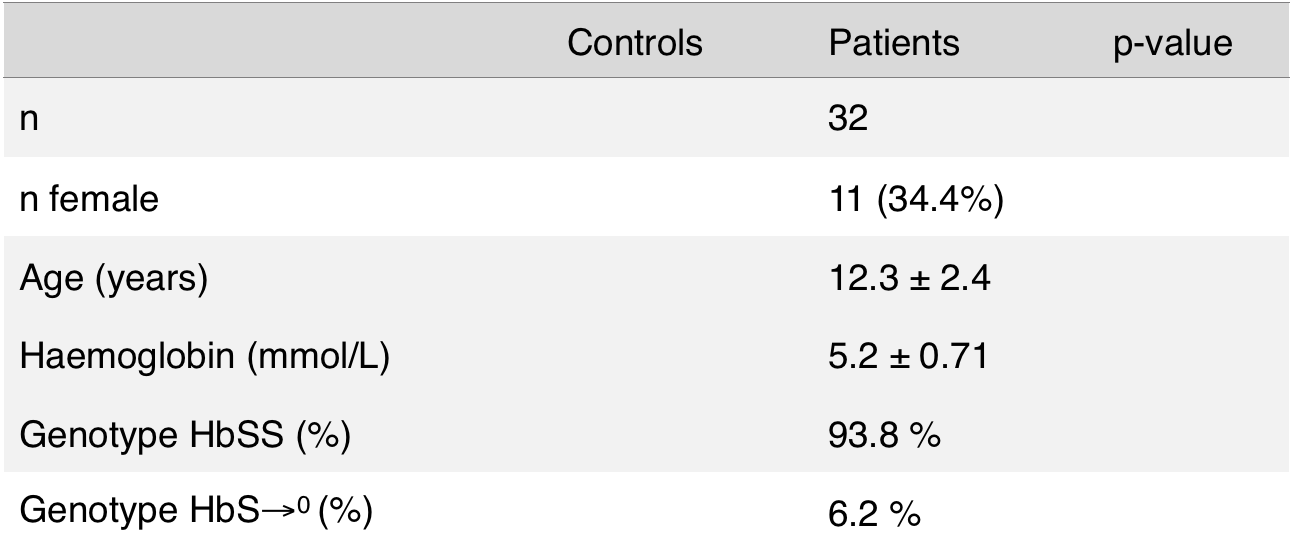
We investigated data from 10 healthy young subjects (22 ± 3 yrs; 40% M) using a 3D GRASE background suppressed pCASL from the study by Jann et al [2] with the following imaging parameters: 3T Tim Trio (Siemens, Erlangen, Germany), 12ch head coil, 60 label/control pairs, TR/TE/labeltime/PLD = 4000/22/1200/1000ms; 26 slices, 64×64 matrix, voxel-size 3.44×3.44×5 mm3. In addition we used 2D EPI BS pCASL data from 32 children (12.3 ± 2.4 yrs, 65.6 M) with sickle cell disease (SCD) drawn from a previous study [3] with imaging parameters as follows: 3T Intera (Philips Healthcare, Best, The Netherlands), 8ch head coil: 75 control/label pairs, TR/TE/labeltime/PLD 4000/17/1650/1525-2005ms; 17slices, 80x80 matrix, voxel-size 3x3x7mm3. Children with SCD have relatively high CBF, short arrival times and long blood T1. Because of these features, the SNR of ASL is also relatively high.
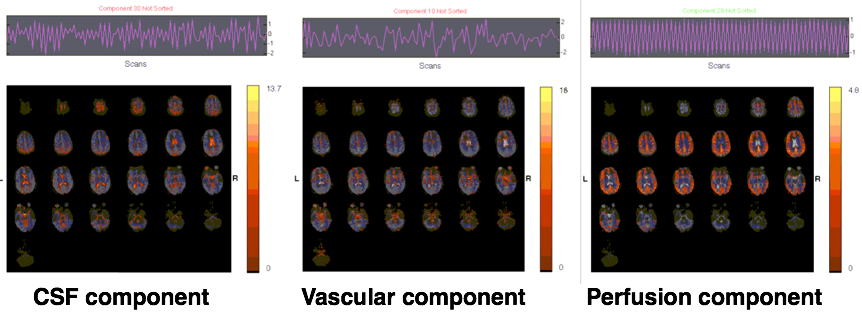
Data analysis was performed in Matlab using SPM12, GIFT toolbox for ICA and in-house scripts. Individual ASL time-series were first motion realigned and then either directly CBF quantified or first subjected to an ICA cleanup (GIFT toolbox) to separate signal from noise and artifacts. ICA was performed individually using a FAST ICA with individually determined dimensionality. Independent components were then visually inspected by two reviewers to classify them into noise (e.g. motion, vascular, physiological or technical) and perfusion-signal components. Characteristically, the components for perfusion signal had spatial maps covering grey matter and a temporal zig-zag pattern reflecting the label/control signal intensity differences. Using the top component classified as perfusion signal and excluding all noise components we reconstructed the ASL label/control time-series. For all participants we then calculated CBF maps, CBF time-series and tSNR maps for raw (i.e. uncorrected) and ICA corrected datasets and normalized them to MNI standard space. CBF and tSNR maps were compared with a paired-sample, two-sided t-test to reveal areas where ICA cleanup potentially altered CBF and improved tSNR.
Results
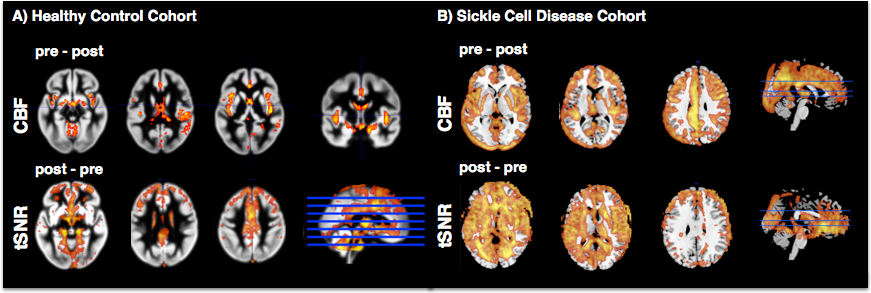
The ICA decomposition identified factors related to noise signals and at least one component of perfusion weighted signal in each subject (Fig1). ICA cleanup caused significant reduction of CBF in areas of major feeding arteries in the healthy controls and across the whole brain in the SCD children (Fig2top). Globally, CBF was reduced around 2% in HC (from 58.8±9.4ml/100g/min to 57.7±9.4ml/100g/min) and around 6% in SCD (66.3±9.7ml/100g/min to 62.3±9.5ml/100g/min). Analysis of tSNR revealed a significant increase of tSNR in both cohorts (Fig2bottom). Figure3 displays the mean of the difference in CBF and tSNR in the uncorrected and ICA corrected results.Discussion
Our preliminary analysis on the feasibility of ICA cleanup in ASL perfusion MRI proved that we can identify instrumental and physiological noise components as well as perfusion components in two independent datasets. While in the HC subjects ICA cleanup had little effect on CBF values, in the SC children we found higher reductions in CBF values after cleanup. This might be due to too restrictive ICA removal in the current analysis as we only kept the best 1 or 2 components as perfusion signal while discarding all others. Alternatively, there might be other factors that artificially increase CBF and are eliminated in the ICA cleanup in the SCD cohort (e.g. more motion). Nevertheless, in both cohorts tSNR significantly increased after ICA cleanup which may provide the opportunity to perform analysis that are currently not possible due to poor tSNR as for example functional connectivity analysis [4]. Moreover, the ICA cleanup approach might reduce the unwanted effect of vascular artifacts. In future research, we plan to fully automate the method by detecting the characteristic patterns of the perfusion component and further validate the method in datasets with regard to motion and test-retest reliability.Acknowledgements
No acknowledgement found.References
[1] Vidorreta et al. 2014 Neuroimage 0:662-671 [2] Jann et al. 2016 Front. Neurosci [3] Van der Land et al. 2016, British Journal of Haematology, 172, 274–284 [4] Jann et al. Neuroimage 2015- Functional connectivity in BOLD and CBF data: similarity and reliability of resting brain networks.Figures