2329
Human brain functional areas of unitary pooled activity identified with fMRI1Department of Radiology, Michigan State University, East Lansing, MI, United States
Synopsis
We define a functional area of unitary pooled activity (FAUPA) as an area in which the temporal variation of the activity is the same across the entire area, i.e., the pooled activity is a dynamically unitary activity. This unitary activity across the FAUPA implies a perfect temporal correlation for the activity-induced BOLD response, i.e., the Pearson correlation coefficient is 1 for the BOLD responses of any two locations within the FAUPA. A FAUPA may play the role of a functional unit at large-scale. We report the identification of FAUPAs for both resting-state and task fMRI.
Introduction: A typical fMRI voxel may contain over one million neurons and its corresponding BOLD signal changes measure activity-induced changes from a pooled activity of these million neurons1. We define a functional area of unitary pooled activity (FAUPA) as an area in which the temporal variation of the activity is the same across the entire area, i.e., the pooled activity is a dynamically unitary activity. As an example, consider performing a finger-tapping (FT) task. Simultaneously tapping five fingers of the right-hand should induce a dynamic response in the well-confined five-finger representation area of the left primary motor cortex, and the temporal variation of this dynamic response should also be the same everywhere within this well-confined area, forming a FAUPA that is specifically associated with the FT task. This unitary activity across the FAUPA implies a perfect temporal correlation for the activity-induced BOLD response, i.e., the Pearson correlation coefficient (R) is 1 for the BOLD responses of any two locations within the FAUPA. When a FAUPA is measured with fMRI, the voxel-wise signal time courses are no longer perfectly correlated among each other due to unavoidable physiological and instrumental noise. We have recently invented a method to identify FAUPAs with fMRI2. In this study, we report the identification of FAUPAs for both resting-state and task-fMRI.
Methods and Materials: Nine healthy subjects (5 male and 4 female, ages from 21 to 55) participated in the study. The task paradigm consists of a total of 24 task trials with 3 different tasks of word-reading, pattern-viewing and FT. Each trial comprises a 6-s task period followed by a 24-s rest period, yielding a 12-min task scan. The presentation of the three tasks is interleaved. For the 12-min resting-state scan, the participants were instructed to close their eyes and try not to think of anything but remain awake during the whole scan. Functional brain images were acquired on a GE 3.0 T clinical scanner with an 8-channel head coil using a GE-EPI pulse sequence (TE/TR = 28/2500 ms, flip angle 80°, FOV 224 mm, matrix 64×64, slice thickness 3.5 mm, and spacing 0.0 mm). Thirty-eight axial slices to cover the whole brain were scanned. Image preprocessing of the time series was performed using AFNI3, including (1) removing spikes; (2) slice-timing correction; (3) motion correction; (4) spatial filtering with a 4 mm full-width-half-maximum; and (5) bandpassing to the range of 0.009-0.08 Hz. A statistical model and Matlab-based software algorithms have been developed and tested to identify FAUPA2. FAUPA identification is based on the assessment of the similarity of the time series of voxels within an area, and the determination is objective and automatic, with no a-priori knowledge. For an identified FAUPA, the mean time course of all voxels within the FAUPA was used to compute an R value for each voxel, and the mean (µ) and standard deviation (σ) of these R values was computed to characterize the FAUPA.
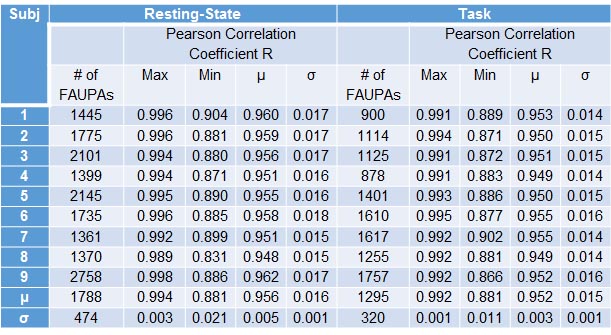
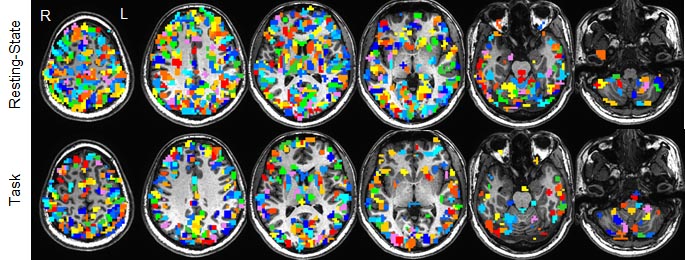
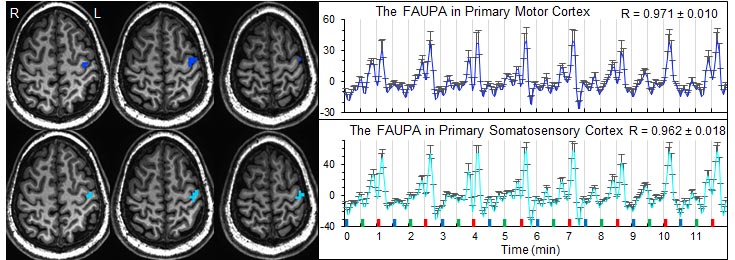
Results and Discussion: FAUPAs were detected for each scan and each subject, and the total number of the identified FAUPAs across the whole brain varied substantially among the subjects and between the two scans (Table 1, Fig.1). The group-mean of the total number of the FAUPAs was µ±σ=1788±474 for the resting-state and 1295±320 for the task, significantly different from each other (paired-ttest, P=0.008), showing the dependence of the FAUPAs on the brain functional state. The mean size of the FAUPAs was about 300 mm3 that contains seven voxels. For each subject, the maximum, minimum, µ and σ of the R values of all FAUPAs for each scan are tabulated in Table 1. The group-mean of the mean R is µ±σ=0.956±0.005 for the resting-state and 0.952±0.003 for the task, respectively, demonstrating an almost perfect temporal correlation within each FAUPA. A task-associated FAUPA is defined as a FAUPA that activates when performing the task. Task-associated FAUPAs were identified for each task scan, and the two panels in Fig. 2 illustrate two FT-associated FAUPAs with their signal time courses, respectively. These two FAUPAs reflect two different functions; one reflects the finger movements and the other reflects the sensory signal from the touch of the fingers to the keypad. As the R between these two time courses is 0.981 (P=3.3×10-62, N=288), the most popular general linear model4 for task-fMRI analysis is incapable of differentiating them. All task-associated FAUPAs may compose a task-specific network, and their signal time courses may characterize the dynamic activity of the network. FAUPAs identified for resting-state fMRI may serve as ideal seeds for brain functional connectivity mapping.
Acknowledgements
This work was supported by the Michigan State University Radiology Pilot Scan Program.References
1. Logothetis, N. K. What we can do and what we cannot do with fMRI. Nature 453, 869-878 (2008).
2. Huang, J. Method and system for determining brain-state dependent functional areas of unitary pooled activity and associated dynamic networks with functional magnetic resonance imaging. United States Patent and Trademark Office, Provisional Patent Application, Serial No. 62/464,413 (2017).
3. Cox, R. W. AFNI: software for analysis and visualization of functional magnetic resonance neuroimages. Comput Biomed Res 29, 162-173 (1996).
4. Friston, K. et al. Statistical parametric maps in functional imaging: A general linear approach. Hum Brain Mapp 2, 189-210 (1995).
Figures