2327
Quantitative assessment of fMRI head motion metrics and motion correction methods using digital motion phantoms1Radiology, Duke University, Durham, NC, United States, 2Duke University, Durham, NC, United States
Synopsis
Head motion remains a major obstacle in fMRI. We have used realistic human digital motion phantoms with empirically-derived head movements and known BOLD signals to address two unresolved questions: 1) how effective are motion correction algorithms? and 2) how much motion is too much when assessing scan quality? Our analysis evaluated different motion metrics and motion correction methods using both block-designed and event-related fMRI task data. The results show that head motion metrics need to distinguish between positional offsets versus active movement, that combining image realignment plus motion-censoring is most effective, and that residual motion after corrections determines acceptability thresholds.
INTRODUCTION
Head motion is a major source of unwanted variance in both clinical and research fMRI. To perform a systematic quantitative assessment of the impact of motion we have created realistic human digital motion phantoms with empirically-derived head movements and known BOLD signals to address two unresolved questions: 1) how effective are motion correction algorithms? and 2) how much motion is too much when assessing scan quality?METHODS
Generating Motion Phantom Scans: Empirical patterns of head movements were extracted from over 5000 clinical fMRI scans, from which 999 were selected that cover a broad range, from essentially no motion to severe head motion. Each pattern is described by 19,880 motion parameters (3 translations + 3 rotations for each of 22 slices in 150 image volumes). Digital fMRI phantom scans were created by adding a known “true” pattern of BOLD signal activity (extracted from either event-related or clinical block-designed tasks) to “rest” EPI scans with no head motion, spatially up-sampling each EPI volume 10x on each axis, applying the 6 motion parameters to move each slice independently, then resampling to obtain new 64x64 voxel images. Phantoms were prepared using fScan software1. These synthetic data sets have realistic image and motion properties, and known task-related activation signal properties. For each set of rest EPI plus BOLD signal scans, 999 different motion phantoms were generated and analyzed.
Correcting Motion: Multiple motion compensation methods were tested for every phantom scan. These included volume realignment algorithms (FSL MCFlirt, AFNI 3dVolReg, and SPM realign), as well as censoring motion by omitting volumes with excessive motion from fMRI signal analysis. Multiple censoring levels were tested, either alone or combined with volume realignment.
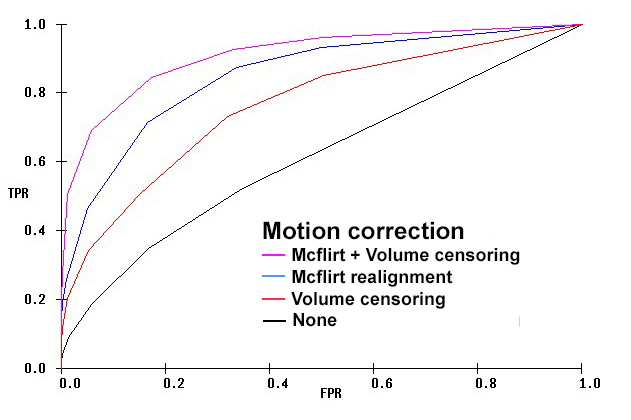
Assessing Activation Maps: fMRI maps were created for each data set using FSL FEAT software, with and without each type of motion correction. Overall map quality was assessed by generating ROC curves comparing detected task signal to true signal. The size and location of individual BOLD active areas were also compared to the known true active areas.
Measuring Motion: Image motion was measured in every EPI data set, both before and after applying correction methods, to calculate multiple motion metrics. Metrics involved both volume-to-volume changes over time, as well as volume displacement relative to a static reference volume. Summary metrics included mean and maximum displacements, volume-to-volume motion2, and novel indices based on what fraction of each scan was actively moving and by how much.
RESULTS
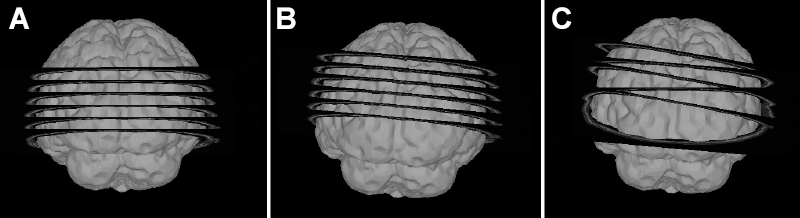
Motion Measurements: Comparing motion estimations across all patterns of empirically measured motion it was evident that head movement over time can be characterized as either a change in head position, relative to some reference position (Fig 1B), or active motion, in which the head can be in a different position during acquisition of each slice within a volume (Fig 1C). Volume-to-reference summary metrics are useful for position changes, whereas volume-to-volume metrics indicate active motion.
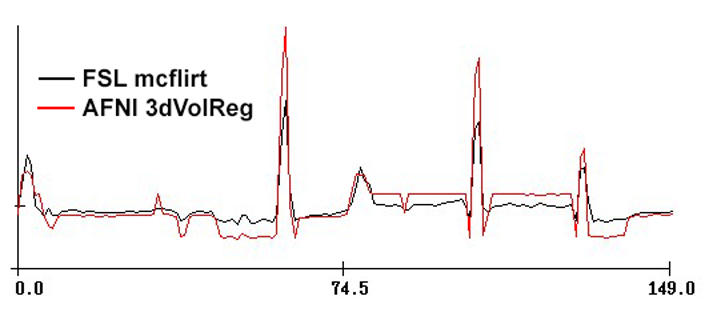
Motion Correction: All 3 volume realignment programs tested were very successful at compensating for head positional motion, but were less effective at correcting volumes with active head motion. In particular, the fact that these programs use an aribitrary reference volume (1st or middle timepoints) at times resulted in poor corrections if the patient happened to be actively moving at the reference time point (Fig 2). Activation map quality was improved if actively moving image volumes were removed from analysis (volume censoring). In general, optimal motion correction was obtained by combining positional volume realignment (choosing a non-moving volume as reference) and active motion censoring (Fig 3).
Quality Thresholds: Whereas measuring motion metrics before motion correction is important for performing optimal motion compensation, measuring metrics of residual image motion after correction is important for determining overall data quality. In particular, preliminary results indicate that detection of true BOLD fMRI signals is compromised if over 20% of image volumes have residual active motion (over 1mm).
CONCLUSIONS
- Head motion metrics need to distinguish between positional offsets versus active movement
- Combining image realignment plus motion-censoring is most effective for detecting true activation signals
- Measuring residual active movement after corrections should be used to determine acceptability thresholds.
Acknowledgements
Thanks to the Quantitative Imaging Biomarkers Alliance (QIBA) of the Radiological Society of North America for support of initial digital phantom efforts and to the QIBA fMRI Biomarker Committee for many useful discussions.References
- Voyvodic J. Activation mapping as percentage of local excitation (AMPLE): fMRI stability within scans, between scans, and across field strengths , Magnetic Resonance Imaging 2006; 24:1249-1261.
- Seto E, Sela G, McIllroy WE, et al. Quantifying Head Motion Associated with Motor Tasks Used in fMRI, NeuroImage 2001; 14(2):284-297
Figures