2326
Multivariate Second Level Analysis in fMRI with Canonical Correlation Analysis1Cleveland Clinic Lou Ruvo Center for Brain Health, Las Vegas, NV, United States, 2University of North Taxes, Fort Worth, TX, United States, 3University of Colorado, Boulder, CO, United States
Synopsis
A multivariate CCA method is introduced for fMRI 2nd level analysis to incorporate local neighboring information, and to improve the sensitivity in group activation and group difference detection in noisy fMRI data. Statistical thresholds for significance of the group-inferences in the multivariate method are computed non-parametrically. Results from both simulated data and real episodic memory data indicate that a higher detection sensitivity for a fixed specificity can be achieved in both 2nd level activation and difference detection with the proposed method, as compared to the widely used univariate techniques.
Introduction
Data analysis in fMRI usually consists of a two level model where the 1st level detects the effect of each individual subject and the 2nd level makes group-inferences1. In the 2nd level analysis, summary statistics and combining hypothesis tests such as Fisher’s data fusion are most widely used2,3,4. These univariate methods assume independent neighboring voxels and are not sensitive enough for data with low signal-to-noise ratio. Multivariate canonical correlation analysis (CCA) has been applied in fMRI 1st level analysis and has been shown to improve sensitivity in activation detection5,6. In this study, we introduce a multivariate CCA model to incorporate neighboring voxels in fMRI 2nd level analysis to obtain more accurate group activation maps and group activation difference maps.Methods
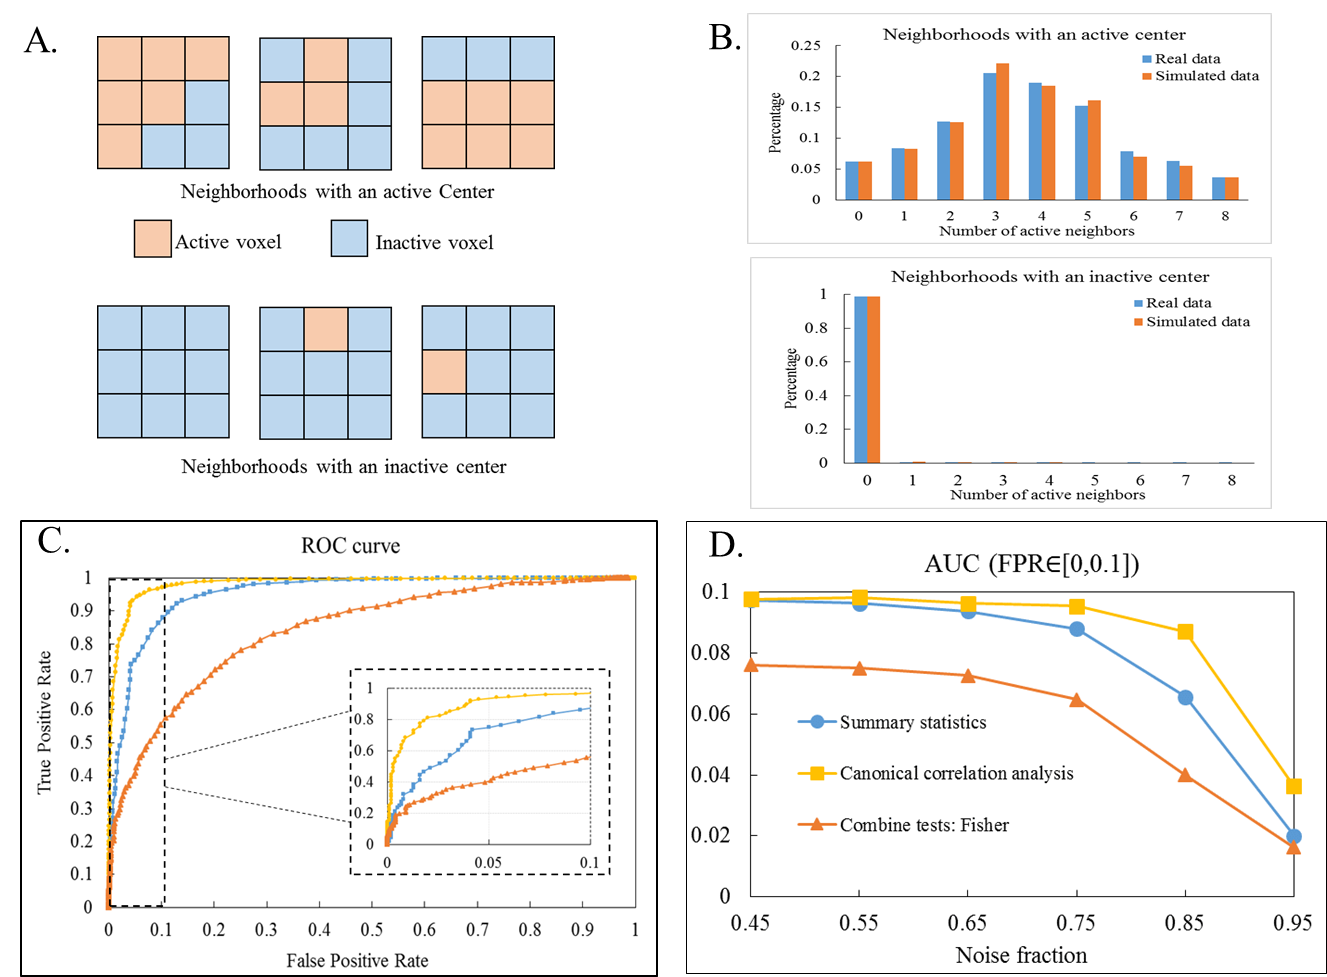
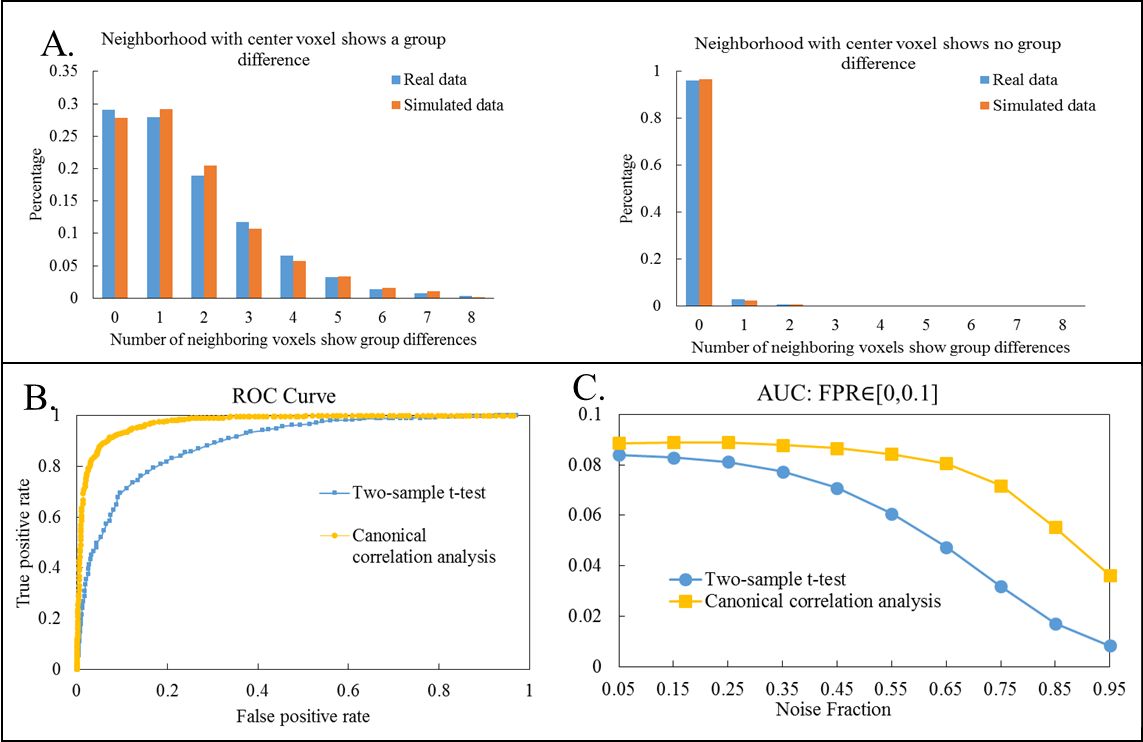
Model: The 1st level model in fMRI can be written as y=Xβ+ε, where vector y represents time course from a single voxel, X represents functions used to model the BOLD response, and β is the subject effect. The 2nd level CCA is then modeled as BαG=XGβG+εG, where B=(β1,β2,...,βm)(size: Nxm) is a matrix that represents 1st level effects of m voxels in a local neighborhood (m= 9 for a 3x3 neighborhood) from N subjects, and XG (size: Nx1or2) is the design matrix modeling either within-group activation detection (XG=[1,...,1]T) or between-group difference detection (XG=[1,...,1,0,...,0;0,...,0,1,...,1]T ). Using CCA, local weighting coefficient αG for the neighborhood and group inference βG for the centering voxel are found by maximizing the canonical correlation coefficient between BαG and XGβG. With a proper normalization term, the solution of maximizing the correlation is equivalent to minimizing the variance of the error term εGTεG. Statistical analysis: Wilk’s lambda statistics is used to determine the group inference of the center voxel for a specific contrast c (c=1 for within-group activation detection and c=[1,-1]T for between-group difference detection). Statistical thresholds for significance are computed from the null distribution non-parametrically (see Table. 1). Imaging: fMRI data (TR/TE/resolution=2s/30ms/1.7x1.7x5mm3, 25 slices, coronal oblique, 288 time frames) from 8 normal subjects and 8 MCI subjects each consisting of a resting-state data set and a memory task data set were analyzed. The memory task involved viewing faces paired with occupations and contained instruction, encoding, recognition and control (distraction) periods. Validation with Simulated data: 1000 3x3 neighborhoods with active center voxels and 1000 neighborhoods with inactive center voxels for 16 subjects were simulated. The distribution of active neighbors in each local neighborhood followed the empirical distribution of real fMRI data analyzed with the summary statistics method. Time courses for simulated neighborhoods were obtained from neighborhoods in real data with the same activation patterns (both resting-state and task fMRI). Specifically, wavelet-resampled resting-state time courses were added to the task time-series with different noise fractions to simulate time courses at different noise levels. Both univariate and multivariate techniques were applied to the simulated data and receiver operating characteristic (ROC) method was used to evaluate the performance of each method. Validation with real data: Standard mass-univariate method was applied in fMRI 1st level analysis and a voxel-wise effect map of contrast encoding v/s control was computed for each subject. Both univariate and multivariate techniques were applied to the 2nd level analysis. Both within-group activation map and between-group difference map were computed.Results
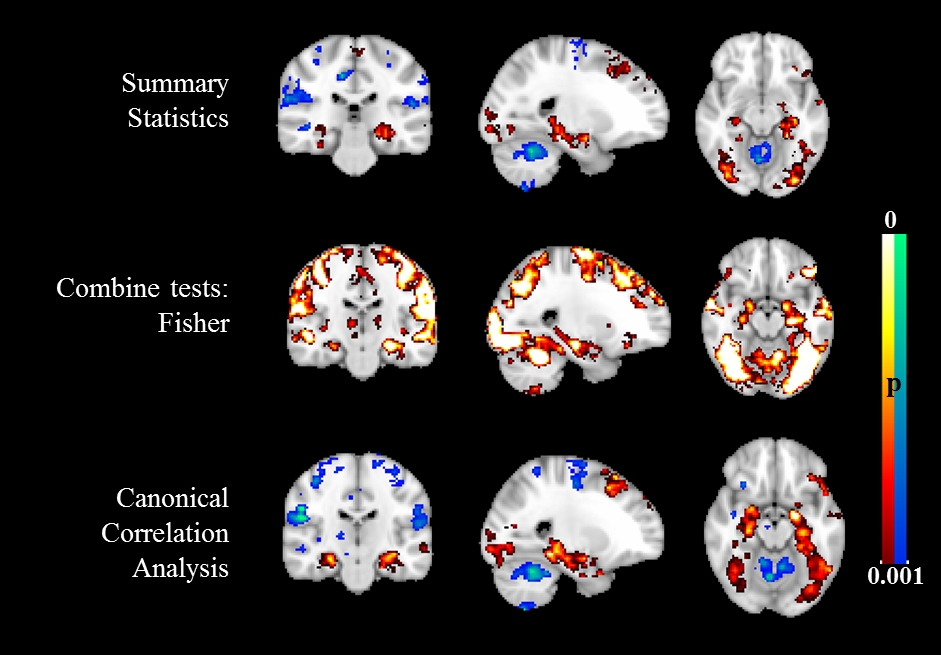
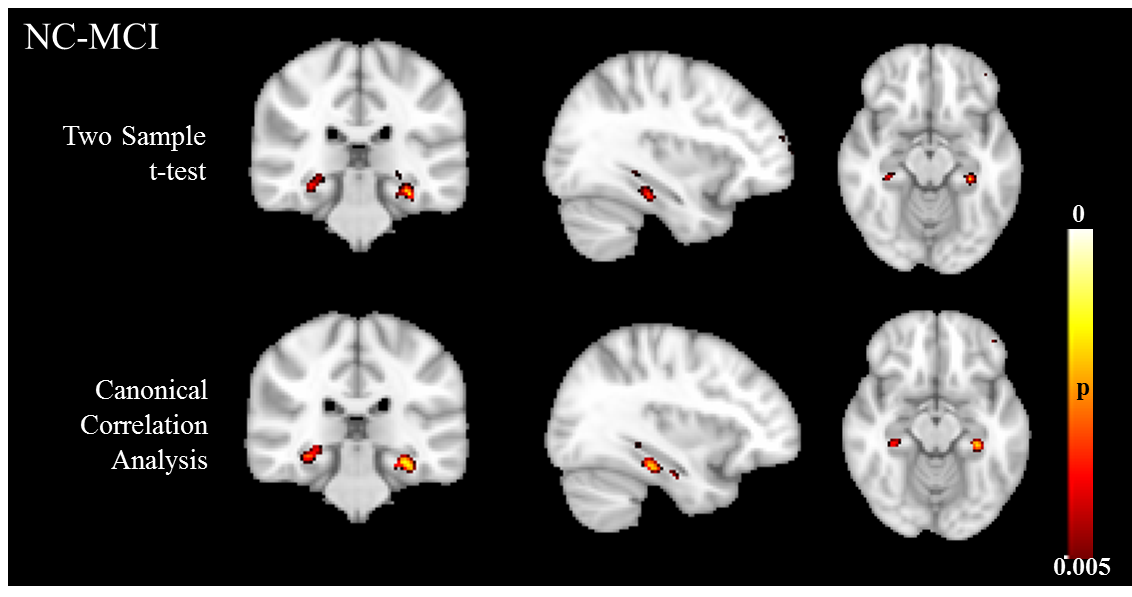
Table. 1 summarizes the univariate and multivariate methods applied in the 2nd level analysis. Results from simulation are shown in Fig.1 (within-group activation detection) and Fig.2 (between-group difference detection). Area under the ROC curves (AUC) at multiple noise levels demonstrate optimum performance of the proposed CCA methods, especially at high noise levels. Whole brain within-group activation map for real fMRI data with contrast encoding v/s control is shown in Fig.3 (p<0.001, uncorrected) and between-group difference map (NC-MCI) for the same contrast is shown in Fig. 4 (p<0.005, uncorrected). Improved activations are observed in fusiform gyrus (Fig. 3) and larger between-group differences are seen in hippocampus (Fig. 4) using multivariate CCA method, as compared to the univariate summary-statistics. Further, when compared to the fisher’s data fusion technique in detecting within-group activations, multivariate CCA method detects less false positives (Fig. 3).Discussion and Conclusion
We have introduced a multivariate CCA method to incorporate local neighboring voxels in fMRI 2nd level analysis. Using simulation, we demonstrated better performance in both activation and difference detection of the proposed method over univariate techniques. Applying the proposed method to real fMRI episodic memory data, larger within-group activation in fusiform gyrus and stronger between-group differences in hippocampus were found.Acknowledgements
The study is supported by the National Institutes of Health (grant number 1R01EB014284 and P20GM109025).References
[1]. Lindquist M.A., 2008. The statistical analysis of fMRI data. Statistical Science.
[2]. Friston K.J et al., 1999. Multi-subject fMRI studies and conjunction analyses. Neuroimage.
[3]. Lazar N.A et al., 2002. Combining brains: a survey of methods for statistical pooling of information. Neuroimage.
[4]. Schwarz N.F et al., 2015. Alternative group analysis method may provide alternative to spatial smoothing of fMRI data. OHBM annual meeting.
[5]. Cordes D et al., 2012. Optimizing the performance of local canonical correlation analysis in fMRI using spatial constraints. Human brain mapping.
[6]. Zhuang X et al., 2017. A family of locally constrained CCA models for detecting activation patterns in fMRI. NeuroImage.
Figures