2325
Registration Comparison using Unsaturated EPI vs Anatomy for Resting State Motor Network at 7T1Imaging Institute, Cleveland Clinic Foundation, Cleveland, OH, United States
Synopsis
Taking advantage of improvements to EPI imaging at 7T could allow for direct use of EPI volumes when registering multiple volumes to a common space. We proposed using an unsaturated EPI template in order to perform the spatial co-registration of multiple subjects. In this study, we compare the quality of a resulting group map resting state motor network connectivity in order to evaluate different registration pipelines, one utilizing an EPI template as well as one based on the commonly used T1 weighted image template.
Introduction
Resting state (rs-) and fMRI have been commonly used to investigate neuronal connectivity and activation1. To conduct group analysis, individual scans must be transformed into a common space. At 3 tesla the EPI images typically used for BOLD imaging, are relatively low-resolution (>16mm3), do not provide good tissue contrast, and thus are not suitable for performing high quality spatial co-registration. High-resolution individual anatomical images are used as a bridge between EPI and a common space.
Due to the increased SNR, short T2, and state-of-the-art acceleration techniques2,3, EPI images taken at 7 tesla (7T) provide anatomical information with relatively high resolution and contrast. When doing group analysis, spatial blurring can occur due to small misalignments in registration. This can obviate the gain in spatial resolution at 7T. This problem has been poorly addressed in the literature4. To evaluate a possible gain in registration accuracy at 7T, we test a pipeline where the individual unsaturated EPI volume acquired from the first shot of a time-series is registered to a common space directly without the usage of the T1-weighted image (T1w). Additionally, this study investigates registration outcomes using non-linear versus conventional linear spatial transformation in order to investigate possible additional advantages in functional registration accuracy.
Methods
Nineteen healthy subjects were scanned at 7T (Siemens MAGNETOM) with a 32-channel receive, single transmit head coil (Nova, Inc.). Rs-fMRI was acquired using a simultaneous multi-slice EPI protocol (TR=2.8 sec, 1.2x1.2x1.5mm3). The T1-weighted image was acquired using a MP2RAGE5 sequence. After the first ten volumes were removed, head-motion and physiologic noise were corrected using SLOMOCO6 and PESTICA7 based on the first volume EPI, which has unsaturated tissue contrast (called unsaturated EPI here). Seeds were chosen in the left hemisphere primary sensorimotor cortex. These were used to create whole-brain correlation maps in EPI space based on temporal correlation to the selected seed regions8. Individual correlation maps were converted to t-scores and normalized to z-scores preceding group analysis. The M1 cortex was defined using the left and right hemisphere precentral cortex as defined by Freesurfer.
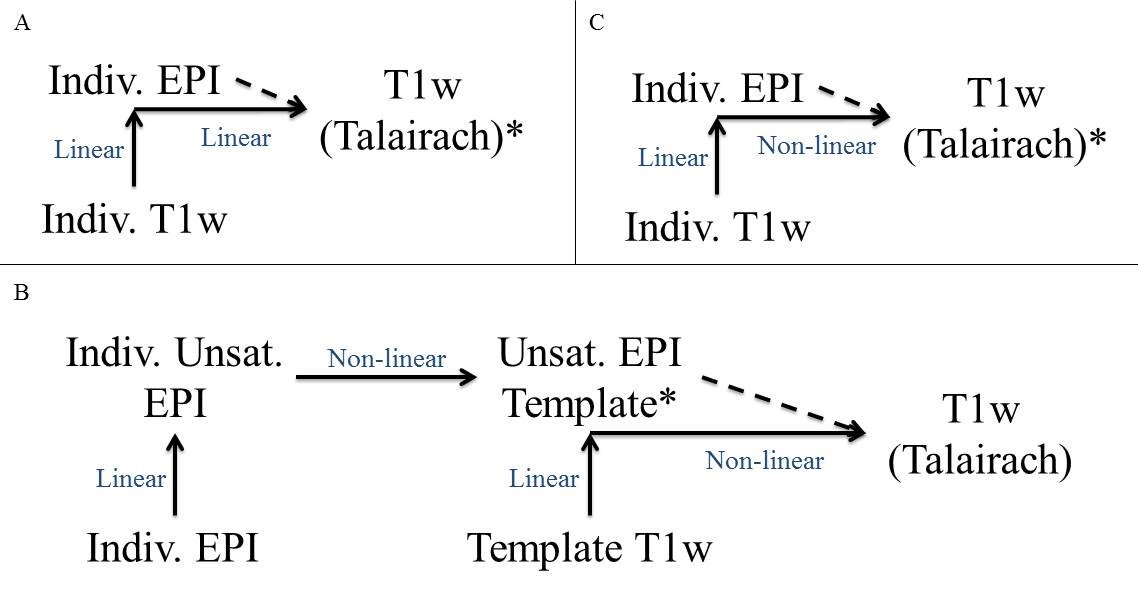
Three pipelines were used in this study. A) The conventional pipeline used a linear registration method with T1w image. Individual T1w images were aligned to the EPI scan and transformed to the Talairach T1w template using linear registration. Individual z-score maps were registered to Talairach with a transformation matrix and a group-averaged map was created. B) Individual unsaturated EPIs were registered to a template unsaturated EPI using a non-linear transformation with ANTS9, and the z-score maps were then transformed to this EPI template where a group-averaged map was created. The T1w corresponding to the EPI template was linearly transformed to the EPI template. The T1w image was then used to non-linearly transform the group-averaged map z-score map to Talairach space. C) Individual T1w images were aligned to EPI using a linear transformation registration. Then, T1w images were transformed to Talairach space using a non-linear transformation with ANTS9. Individual z-score maps were registered to Talairach space using the transformation matrix where the group-averaged map was created. A diagram of these pipelines can be seen in Figure 1.
Results
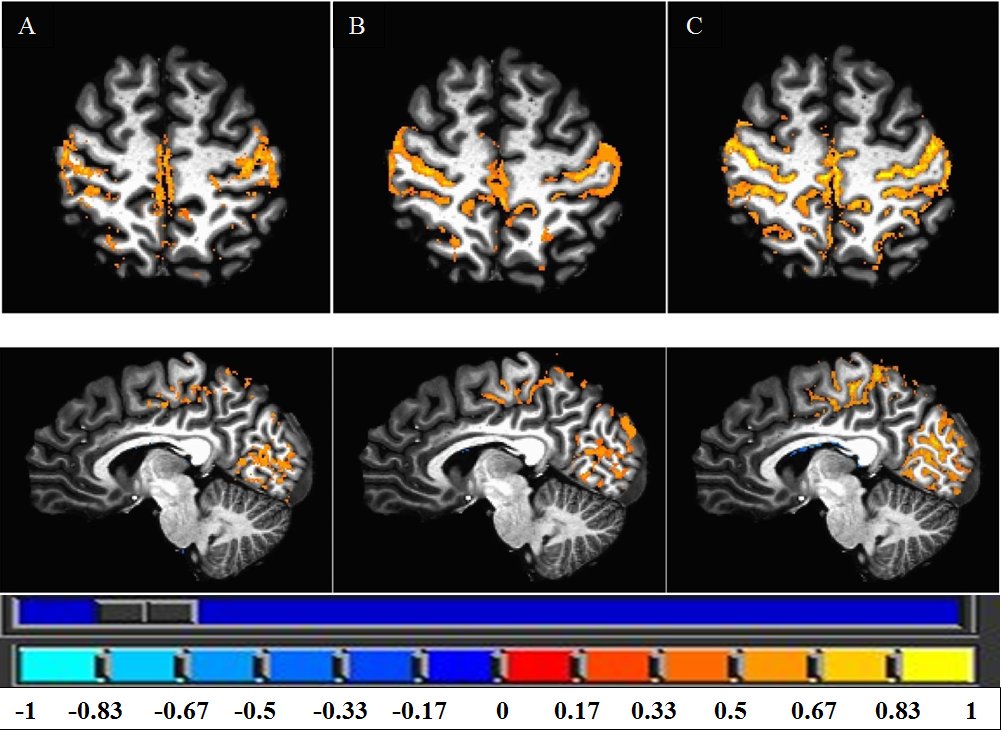
Group-averaged z-score maps were compared in Talairach space. Both non-linear EPI and T1w registration pipelines depicted M1 cortex layers with stronger correlation than the conventional method. The conventional method had the weakest correlation and did not align well with the motor cortex layers (Figure 2).
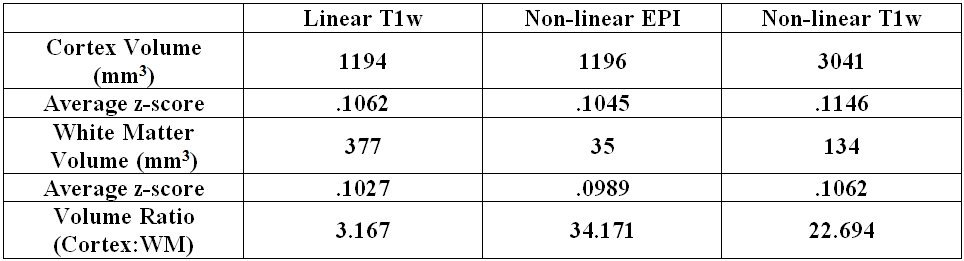
The significantly correlated volume (p≤1×10⁻⁴) of M1 measured 3,041mm3 using the non-linear T1w registration, 1,196mm3 using non-linear EPI pipeline, and 1,194mm3 using the conventional pipeline. Non-linear EPI pipeline produced the greatest ratio of cortex volume to white matter volume. Average z-score in the activated M1 regions (p≤1×10⁻⁴) is calculated as .1146 with non-linear T1w registration, .1045 with non-linear EPI , and .1062 with a conventional pipeline (Table 1).
Discussion
We found that non-linear registration methods outperformed linear registration at 7T for a rs-fMRI group analysis. This suggests that more accurate alignment of individual anatomy to a common space improves the group analysis power and results in less spatial blurring of the transformed volumes.
We observed that group analysis using non-linear T1w registration pipeline is superior to that using nonlinear EPI registration. The relatively large EPI distortion at 7T could be a source of bias for the group alignment and iso-0.75mm high resolution T1w image at 7T could provide the performance of the reliable non-linear registration.
Conclusion
For 7T, the use of a T1w-based template outperformed an EPI-based template for registration to common space. Additionally, nonlinear registration produced a more spatially coherent group map, preserving the high spatial resolution features of the underlying data. Non-linear registration methods, where appropriate, are recommended for high spatial resolution fMRI data.Acknowledgements
This work was supported by Cleveland Clinic. Author gratefully acknowledges technical support by Siemens Medical Solutions, especially Dr. Tobias Kober for MP2RAGE, from Dr. Himanshu Bhat, for SMS EPI.References
1. Fox MD, Raichle ME. Spontaneous fluctuations in brain activity observed with functional magnetic resonance imaging. Nat Rev Neurosci. 2007;8(9):700-11.
2. Chen LT, Vu A, Xu S, et al. Evaluation of highly accelerated simultaneous multi-slice EPI for fMRI. Neuroimage 2015;104:452-459.
3. Preibisch C, Castrillón G. JG, Bührer M, et al. Evaluation of Multiband EPI Acquisitions for Resting State fMRI. PLoS ONE. 2015;10(9):e0136961.
4. Moeller S, Yacoub E, Olman CA, et al. Multiband multislice GE-EPI at 7 tesla, with 16-fold acceleration using partial parallel imaging with application to high spatial and temporal whole-brain fMRI. Magn Reson Med. 2010;63(5):1144-1153.
5. Marques JP, Kober T, Krueger G, et al. MP2RAGE, a self bias-field corrected sequence for improved segmentation and T1-mapping at high field. Neuroimage. 2010;49(2):1271-1281.
6. Beall EB, Lowe MJ. SimPACE: generating simulated motion corrupted BOLD data with synthetic-navigated acquisition for the development and evaluation of SLOMOCO: a new, highly effective slicewise motion correction. Neuroimage. 2014;101:21-34.
7. Beall EB, Lowe MJ. Isolating physiologic noise with independently determined spatial measures. Neuroimage. 2007;37(4):1286-300.
8. Lowe MJ, Mock BJ, Sorenson JA. Functional Connectivity in Single and Multislice Echoplanar Imaging Using Resting-State Fluctuations.Neuroimage. 1998;7:119-132.
9. Li M, Lin J, Koenig K, Lowe M. Automatic nonlinear transformation of 7T MRI brain image to Talairach stereotaxic space. Presented at: Magnetic Resonance in Medicine. Honolulu, HI, USA; April22-27, 2017.
Figures