2324
Neurophysiological Basis of Multi-Scale Entropy Analysis of Brain Complexity and Its Relationship with Functional Connectivity1Laboratory of FMRI Technology, Stevens Neuroimaging and Informatics Institute, University of Southern California (USC), Los Angeles, CA, United States, 2Center for Cognition and Brain Disorders, Institutes of Psychological Sciences, Hangzhou Normal University, Hangzhou, China, 3Neuroimaging Research Branch, National Institute on Drug Abuse, Baltimore, MD, United States
Synopsis
Recently, non-linear statistical measures such as multi-scale entropy (MSE) have been introduced as indices of the complexity of BOLD fMRI time-series across multiple time scales. In this work, we investigated the neurophysiological underpinnings of complexity (MSE) of electrophysiology and fMRI signals and their relations to functional connectivity (FC). We include both simulation data using neural mess model based brain network model and animal models with concurrent recording of fMRI and electrophysiology in conjunction with pharmacological manipulations. Our results show that the complexity of regional electrophysiology and fMRI signals is positively correlated with network FC.
Introduction
Recently, non-linear statistical measures such as multi-scale entropy (MSE) have been introduced as indices of the complexity of BOLD fMRI time-series across multiple time scales(1). MSE builds on an important characteristic of complex or chaotic systems – self-similar or “fractal” behavior across multiple measurement scales, thereby may offer a unique approach to bridge cellular and circuit level recordings with systems level brain imaging. The purpose of this work was to investigate the neurophysiological underpinnings of complexity (MSE) of electrophysiology and fMRI signals and their relations to functional connectivity (FC).Theoretical Modeling
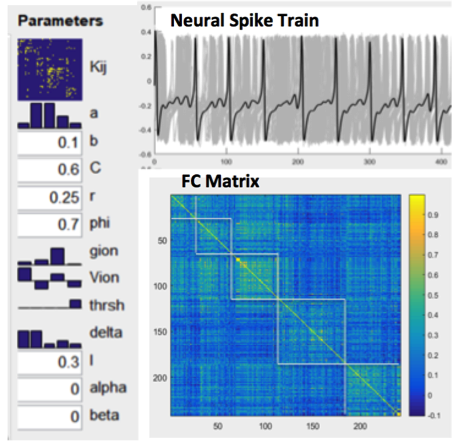
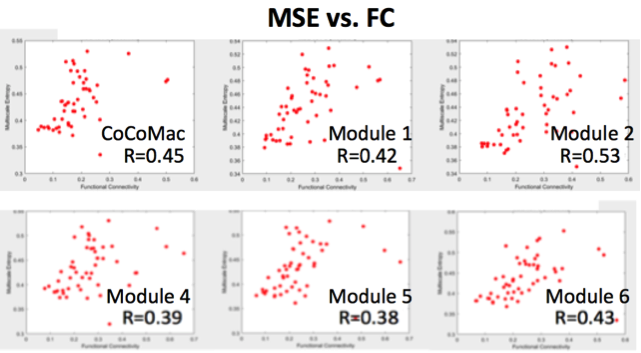
The Brain Dynamics Toolbox (https://github.com/breakspear/bdtoolkit) was used for simulation that includes neural mess model (NMM) based brain network models (BNMs)(2). The NMM describes local populations of densely interconnected inhibitory and excitatory neurons whose behaviors are determined by voltage- and ligand-gated membrane channels. A medium-scale (mesoscopic) array (BNM) is then constructed from these local nonlinear populations by introducing long-range pyramidal connections, mimicking glutamate-induced synaptic currents. Spatiotemporal patterns arise through reentrant excitatory–excitatory feedback(3). We used CoCoMac(4) as structural connectivity matrix and set all physiologically measurable parameters within their accepted ranges to generate dynamically plausible behavior(3), while ensuring different nodes wouldn’t stay synchronized because of too strong coupling. The relationship between MSE and FC of nodal spike trains was investigated by repeated simulations while varying excitatory-to-excitatory connectivity (Aee), and calculating the cross-correlations between corresponding MSE and FC measures.Animal Experiment
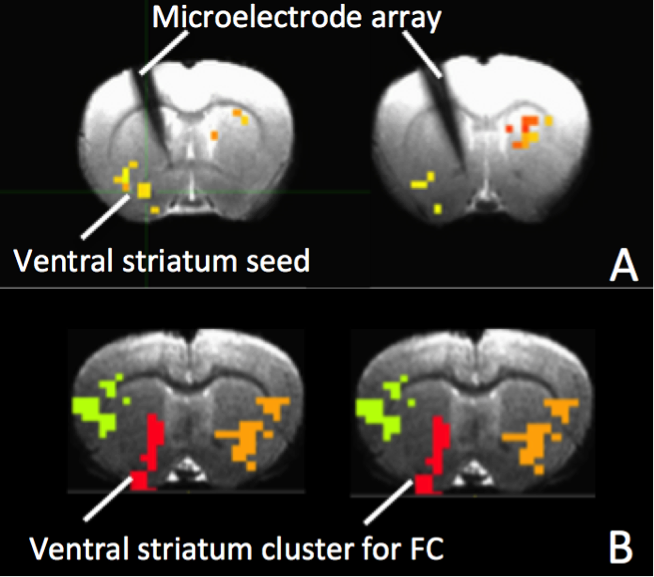
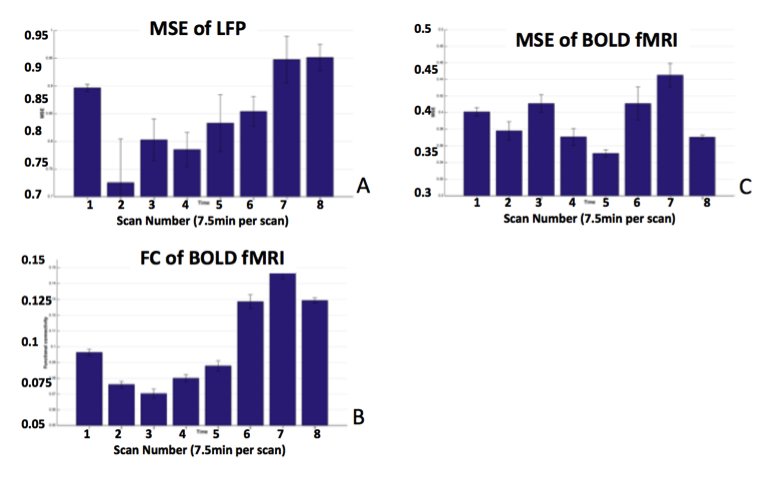
Silicon-based MRI-compatible microelectrode arrays (NeuroNexus) were implanted into the left striatum in rats (N=8), and a microinjection cannula was implanted above the ventral tegmental area (VTA) for AMPA (α-amino-3-hydroxy-5-methyl-4-isoxazolepropionic acid) microinjections to modulate VTA neuronal activity and connected striatum areas. After one-week recovery from surgery, rats underwent repeated concurrent fMRI and electrophysiological recording experiments on a Bruker 9.4T scanner. A single shot GE-EPI sequence (TR=1500ms, TE=15ms, matrix=64x64, FOV=1.92 x1.92cm2, 5x0.3mm slices) was used to acquire BOLD data for ~60 min. MR gradient and RF induced artifacts on local field potential (LFP) were corrected by linear interpretation followed by cubic-spline interpretation with data from epochs of LFP before and immediately after the artifacts(5). LFP data were low-pass filtered to 100Hz and down-sampled to 250Hz for final analysis. Repeated fMRI/LFP data were recorded pre and post microinjection of AMPA (1μl, 100μM) in VTA (7.5min per epoch). MSE was calculated pixel by pixel, and FC was calculated using ventral striatum as the seed area. ANOVA was then applied to detect brain regions with significant MSE and/or FC changes by AMPA injection. Cross-correlations were calculated between MSE of LFP and fMRI in ventral striatum as well as FC of fMRI within the ventral striatum cluster showing significant FC changes following AMPA injection.Results
Figure 1 shows our modeling parameters and simulated neural spike trains and FC matrix based on the CoCoMac(4). The simulated neural spike train of one node (solid curve) exhibits a pattern of synchronization – desynchronization with the rest nodes (grey curves). The FC matrix clearly demonstrates 5 modules of functionally connected networks, which is highly consistent with the partition of CoCoMac into 5 structural modules(6). Significant positive correlations (r>=0.38, p<=0.01) between FC and MSE were observed in the whole CoCoMac as well as its 5 modules by varying Aee while adding random noise (Fig. 2).
Figure 3A&B show MRI of electrode positions and clusters with significant MSE and FC changes due to AMPA injection in animal experiment. As shown in Fig. 4A&B, both mean MSE of LFP (recorded at electrode tip) and FC of BOLD fMRI (within ventral striatum cluster) decrease following AMPA injection, with a significant correlation (r=0.5, p<0.001) between the two measures. All metrics return to baseline at 37.5min post AMPA with overshoot afterwards. MSE of BOLD fMRI in ventral striatum also shows a trend of decreasing followed by signal recovery in response to AMPA injection (Fig. 4C), which is significantly correlated with that of fMRI FC (r=0.3, p=0.014).
Discussion and Conclusion
Both simulation and animal experiment showed positive correlations between MSE of regional neural signals (LFP and/or fMRI) and network FC. Neural complexity has been linked to brain’s capacity for information processing – systems engaging in greater transition or exploration between different states (i.e., a higher level of complexity) have greater propensity for information processing(7). Therefore our results indicate that regional neural complexity and network FC may be two related aspects of brain’s information processing: the more complex regional neural activity, the higher FC this node has with rest network nodes. We also notice such relationship is replicated across network modules and at the whole network level.Acknowledgements
This work was partially supported by National Institute on Drug Abuse Intramural Research Program. The authors would like to thank Drs. Michael Breakspear and Stewart Heitmann for help with Brain Dynamics Toolbox.References
1. R. X. Smith, L. Yan, D. J. Wang, Multiple time scale complexity analysis of resting state FMRI. Brain Imaging Behav 8, 284-291 (2014).
2. S. Heitmann, M. Breakspear, Handbook for the Brain Dynamics Toolbox. (QIMR Berghofer Medical Research Institute, ed. Version 2017c, 2017).
3. M. Breakspear, J. R. Terry, K. J. Friston, Modulation of excitatory synaptic coupling facilitates synchronization and complex dynamics in a biophysical model of neuronal dynamics. Network 14, 703-732 (2003).
4. C. J. Honey, R. Kotter, M. Breakspear, O. Sporns, Network structure of cerebral cortex shapes functional connectivity on multiple time scales. Proc Natl Acad Sci U S A 104, 10240-10245 (2007).
5. S. Jaime, H. Lu, J. Cavazos, Y. Yang, Concurrent 32-channel electrophysiological recording and fMRI in bilateral rat striatum. Proc ISMRM 24, 3785 (2016).
6. L. Harriger, M. P. van den Heuvel, O. Sporns, Rich club organization of macaque cerebral cortex and its role in network communication. PLoS One 7, e46497 (2012).
7. I. M. McDonough, K. Nashiro, Network complexity as a measure of information processing across resting-state networks: evidence from the Human Connectome Project. Front Hum Neurosci 8, 409 (2014).
Figures