2323
Energy-Period Characteristics of Brain Networks using Empirical Mode Decomposition1Cleveland Clinic Lou Ruvo Center for Brain Health, Las Vegas, NV, United States, 2University of Colorado, Boulder, CO, United States, 3University of Management & Technology, Lahore, Pakistan
Synopsis
In this project, we have studied resting-state networks using Empirical Mode Decomposition (EMD) to obtain time-frequency-energy information. Intrinsic Mode Functions (IMFs) and associated spatial maps provide a data-driven decomposition of resting-state networks. We investigated the average energy-period relationship of IMFs of group independent components analysis (ICA) networks to better characterize temporal properties of networks and found that the IMFs of BOLD data provide inverted V-shaped energy-period signatures that allow a natural ranking of all resting-state networks when compared to signatures of pure noise.
Introduction
Empirical Mode Decomposition (EMD)1,2,3 was used as a data-driven method to study the natural occurring frequency bands of resting-state data, and specifically investigate energy-period relationships of Intrinsic Mode Functions (IMFs) for resting-state networks. The novelty of the current approach lies in the data-adaptive and user-independent decomposition of fMRI data using the Hilbert-Huang Transform and identification of networks based on characteristic data-driven energy-period signatures of IMFs.Methods
FMRI was performed on 22 healthy subjects in a 3T Siemens MRI scanner equipped with a 32-channel head coil using multiband EPI with imaging parameters: MB8, TR 765ms, TE = 30ms, flip 44deg, partial Fourier 7/8 (phase), FOV = 19.1 x 14.2 cm, 80 slices in oblique axial orientation, resolution 1.65mm x 1.65mm x 2mm, BW =1724 Hz/pixel, 2380 time frames (30min scanning duration). After the usual preprocessing steps all voxels were resampled to a 2mm x 2mm x2mm grid. Group ICA (based on the FastICA algorithm4) was performed by stacking all data in the temporal domain and 30 resting-state networks were computed. The group time series signatures of all ICA networks were obtained and further decomposed by EMD into 9 IMFs. The mean energy per unit time and the mean period were computed for each IMF of all ICA components. Energy and period of all IMFs can be considered as a feature vector of each ICA component. We used k-means clustering on all feature vectors, ran cross- validation using the leave-one-out method and determined the optimal number of clusters. Using Principal Component Analysis (PCA) we plotted all 30 ICA time signatures in a 2-dim plot spanning the major principal components. To compare EMD results, we also generated artificial Gaussian noise data (1000 time series, TR 765ms, 30 min duration) using 3 different AR(1) processes. Energy-period plots were then generated for all noise processes and compared with fMRI resting-state signatures.Results
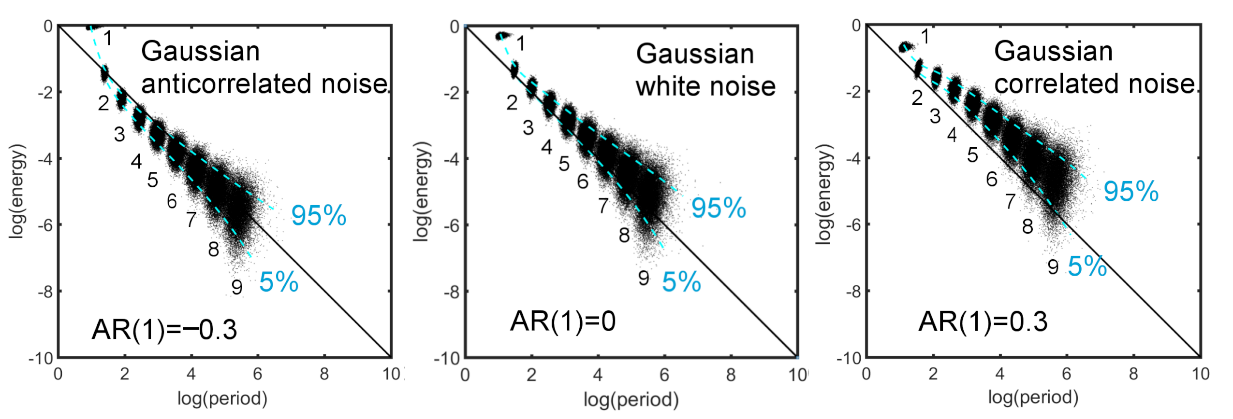
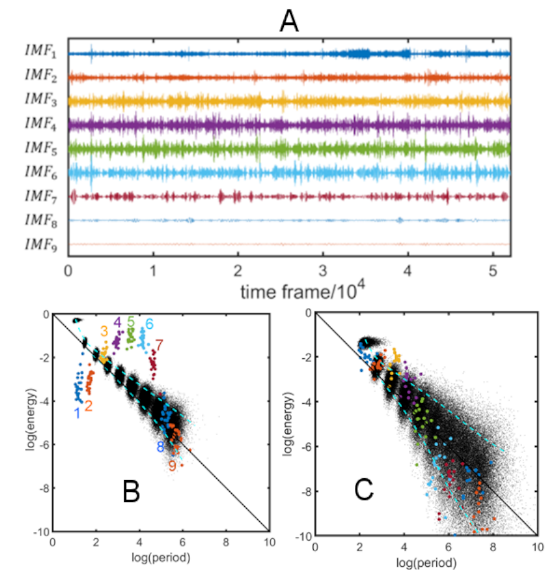
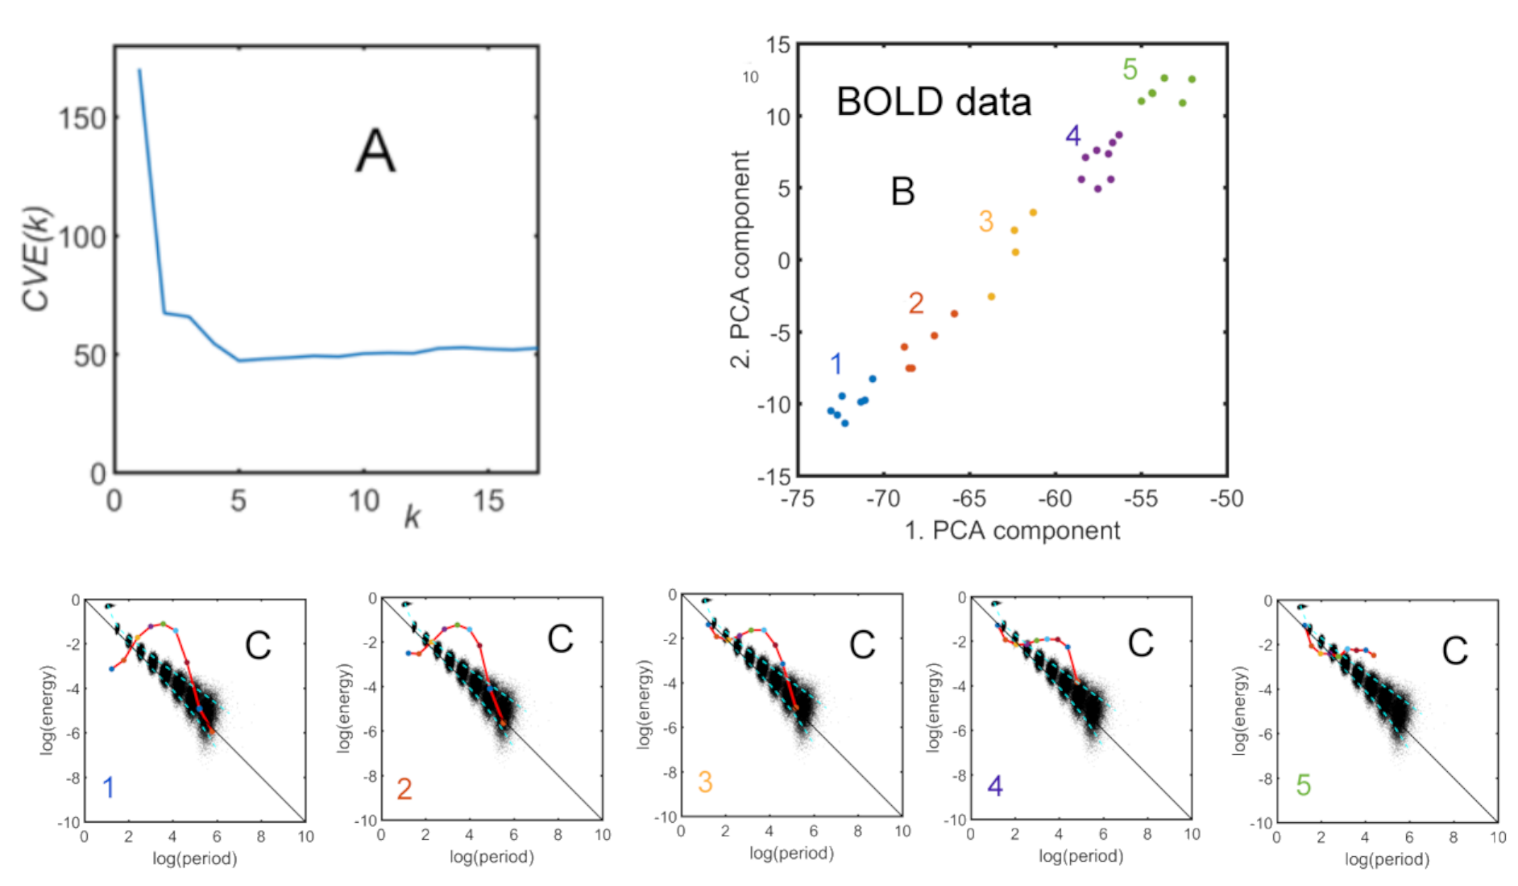
Fig.1 shows the energy-period relationship for different noise processes. All energy-period data points belonging to a specific IMF form an oval-shaped cluster of points. Note that with increasing AR(1) coefficient, the energy-period spectrum is shifted upwards for IMFs 2-9, whereas for IMF1 the shift is downwards towards the diagonal line. The blue dotted lines represent the 5 and 95 percentile of the energy-period distribution for all IMFs. Fig.2A shows the results for the fMRI resting-state data for the Default mode Network (DMN) time signature using EMD. The top portion shows the temporal decomposition into 9 IMFs. The bottom portion (Fig. 2B) shows the energy-period relationship of the IMFs superimposed on the white noise spectrum (black dots). Note the characteristic inverted V shape of the fMRI signal characteristic. For comparison, we show similar resting-state data but collected with a larger TR (TR 2.4s) leading to a spread of the noise component and no characteristic shape of the energy-period signature of the DMN. Here, all signal components are within the 5 to 95 percentile of the noise distribution. Fig.3 shows the results of the K-means clustering of all energy-period feature vectors overlaid on white noise data. The cross-validation error leads to an optimum cluster size of 5 (Fig.3A). Fig. 3B shows the partitioning of all 30 ICA time signatures into 5 clusters. Fig. 3C shows the corresponding mean energy-period profiles of the 5 clusters.Discussion
The energy-period relationship of the fMRI IMFs provides characteristic signatures that have the shape of an inverted V and are quite different from Gaussian white noise properties. In general, the intermediate IMFs bulge out above the diagonal white noise line defined by log(E)+log(T)=0 and signify networks with strong autocorrelations. Clustering of the shape of these energy-period signatures leads to well-defined ordering of ICA components. We obtained 5 major clusters and were able to rank each network component according to the form of the energy-period relationship by PCA. It is interesting to see that cluster 1, containing 7 ICA components, has the largest signature difference from white noise. These components consist of visual networks, DMN, fronto-parietal networks and auditory network. The clusters further away from cluster 1 (the extreme case is cluster 5) contain higher frequency networks with cerebellar and subcortical features and a signature closer to the white noise energy-period line.Conclusion
We have studied resting-state networks using EMD to obtain energy-period information. IMFs and associated spatial maps provide a data-driven decomposition of resting-state networks. We found that the IMFs of resting-state networks showed characteristic inverted V-shaped energy-period signatures that allows a natural ranking of all resting-state networks when compared to signatures of white noise.Acknowledgements
This research project was supported by the NIH (COBRE grant 1P20GM109025 and 1R01EB014284).References
[1] Huang NE, et al. The empirical mode decomposition and the Hilbert spectrum for nonlinear and non-stationary time series analysis. Proc. R. Soc. Lond. 1998, A 454, 903-995.
[2] Flandrin P. et al. Empirical mode decomposition as a filter bank, IEEE Sig. Proc. Letters 2004, 11(2), 112-114.
[3] Niazy RK, et al. Spectral characteristics of resting-state networks. Prog. Brain Res. 2011, 193:259-276.
[4] Hyvärinen A. Fast and Robust Fixed-Point Algorithms for Independent Component Analysis. IEEE Transactions on Neural Networks 1999, 10(3):626-634.
Figures