2322
A Weighted Square Averaging Method of Combining Primary and Temporal Derivative Parameter Estimates In General Linear Model Analysis of Functional MRI1Human Magnetic Resonance Center, Institute of Applied Life Sciences, University of Massachusetts Amherst, Amherst, MA, United States, 2Austen Riggs Center, Stockbridge, MA, United States
Synopsis
The temporal derivative has been considered as a mathematical solution for the latency variation of the hemodynamic response function (HRF) in the general linear model (GLM) analysis of the task-based functional MRI (fMRI). A method of combining the primary and derivate estimates was developed by Calhoun and its implementation was introduced. However, serious defects were revealed in the existing methods from a GLM analysis of an event-related fMRI. Here, the method is revised to provide a correct combined estimate using a weighted square average method. The proposed method was confirmed with event-related fMRI studies at various phases of the double Gamma HRF.
Introduction
The temporal derivative has been considered as a mathematical solution for the latency variation of the hemodynamic response function (HRF) in the general linear model (GLM) analysis of the task-based functional MRI (fMRI). A method of combining the primary and derivate estimates was developed using a weighted square summation (WSS) method1 and its implementation script was provided.2 However, serious defects were revealed in the existing methods from a GLM analysis of an event-related fMRI: (i) The sign of the combined estimate was not reliable; (ii) The magnitude of the combined estimate was not normalized. Here, the Calhoun’s WSS method is revised to provide a correct sign and magnitude of the combined estimate using a weighted square averaging (WSA) method.Methods
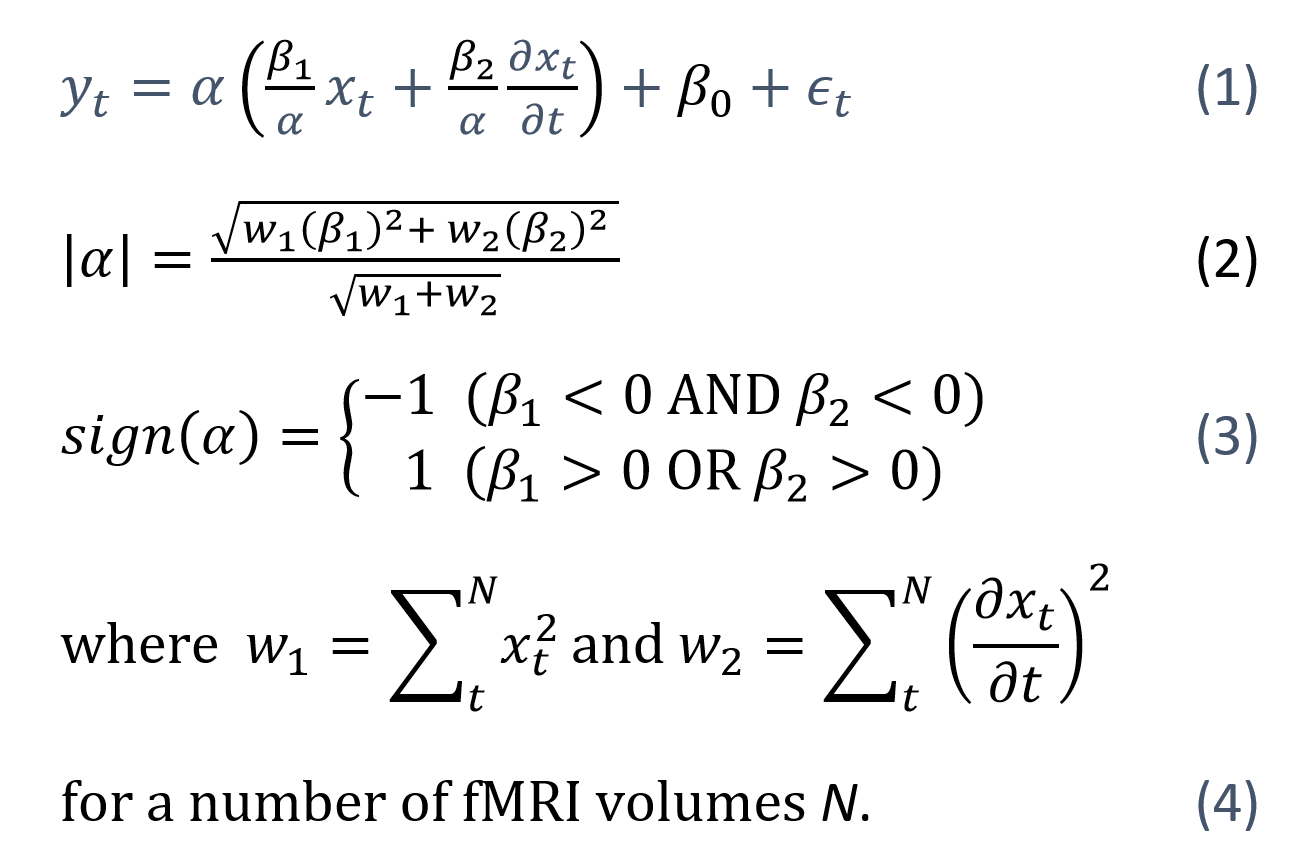
The sign of the combined estimate α in Calhoun’s1 and Pernet’s3 papers was only determined by the sign of the primary (non-derivative) estimate β1. However, β1 can be negative when the magnitude of β1 is smaller than the magnitude of the derivative estimate β2. This is corrected by assigning a negative sign to α only when both β1 and β2 are negative (see Equation 3). Regarding the normalization defect, α in the Calhoun's paper1 was essentially a weighted sum with the design matrix values as weights, not a weighted average, and thus the magnitude of Calhoun’s estimate is problematically dependent on both the number of temporal points and the magnitudes of the design matrix (xt) (see Equations 2 and 4).2,3 This paper proposes these respective corrections: (i) The combined estimate’s sign matches the signs of the parameter estimates it is combining; and (ii) the weighted sum of squared parameter estimates is divided by the sum of the weights, creating a weighted average within the same range of the parameter estimates it is based on. The problems in the existing methods as well as the effectiveness of these corrections were confirmed using fMRI data of an event-related design for the bilateral finger button press task. The event was a single button press of randomly chosen hand side followed by a fixation with a random inter-stimuli interval of 3 to 8s (scan time=310s). A blocked design fMRI was also collected for a reference BOLD activation map with a block duration of 18s followed by 18s fixation (scan time=304s). The data was collected at 3T MRI for 2 volunteers with 20-ch head and neck RF coil, TR=1.5 s, slice acceleration=2, TE=30ms, and voxel=3x3x3mm3. The GLM analysis was processed using FSL FEAT with the double Gamma HRF and a routine preprocessing except the slice timing correction. The recorded button response times were used in the GLM model instead of the visual stimuli time to improve the temporal accuracy of button presses. The FSL ‘fsleyes’ program was used in displaying the parameter estimates in both positive and negative polarities simultaneously. The WSA method was programmed in a ‘perl’ script using the FSL’s ‘fslmaths’ library. The script also calculated the contrasted estimates of the WSA- and WSS-combined estimates for a higher level analysis. The existing and proposed methods were tested with a range of HRF’s phases to simulate the latency of BOLD responses.Results
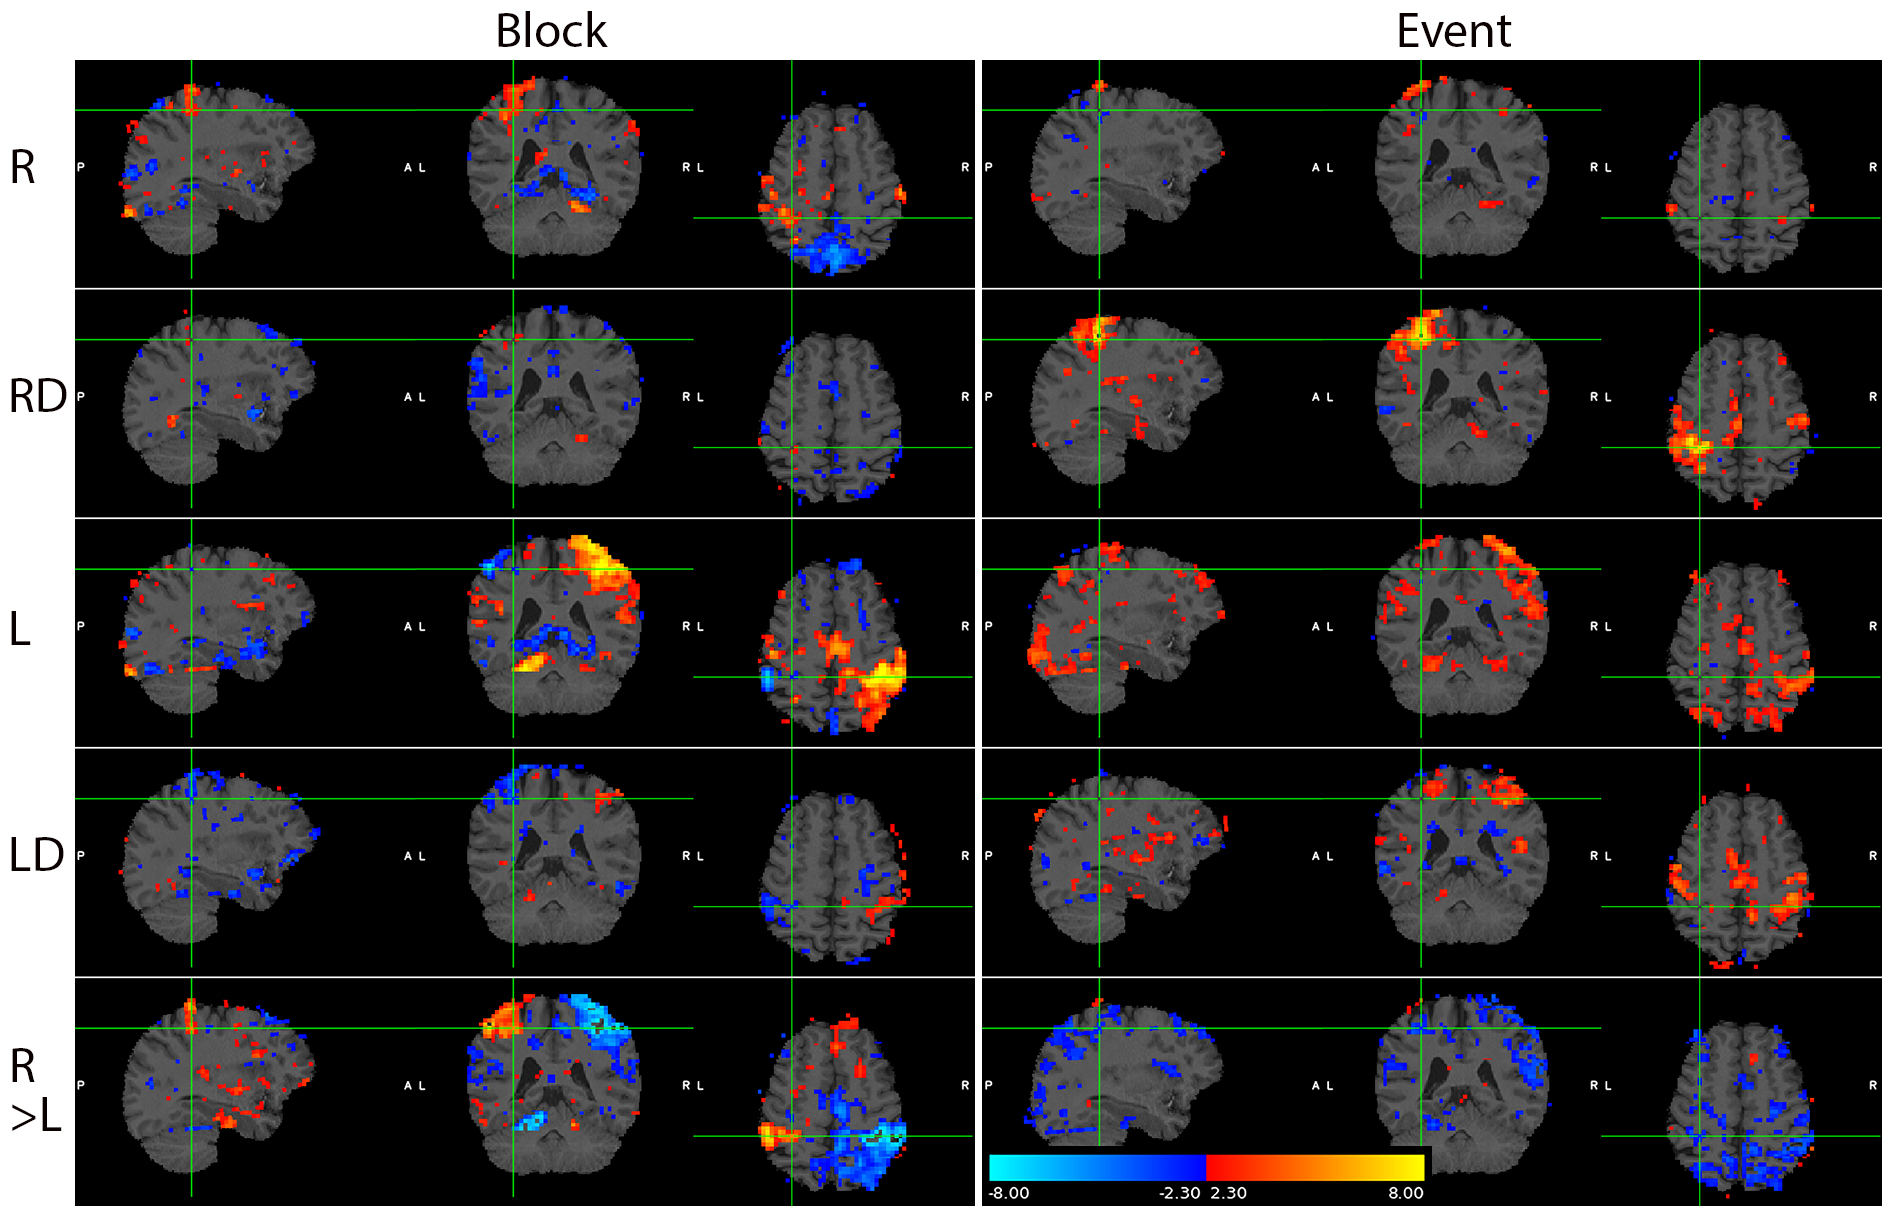
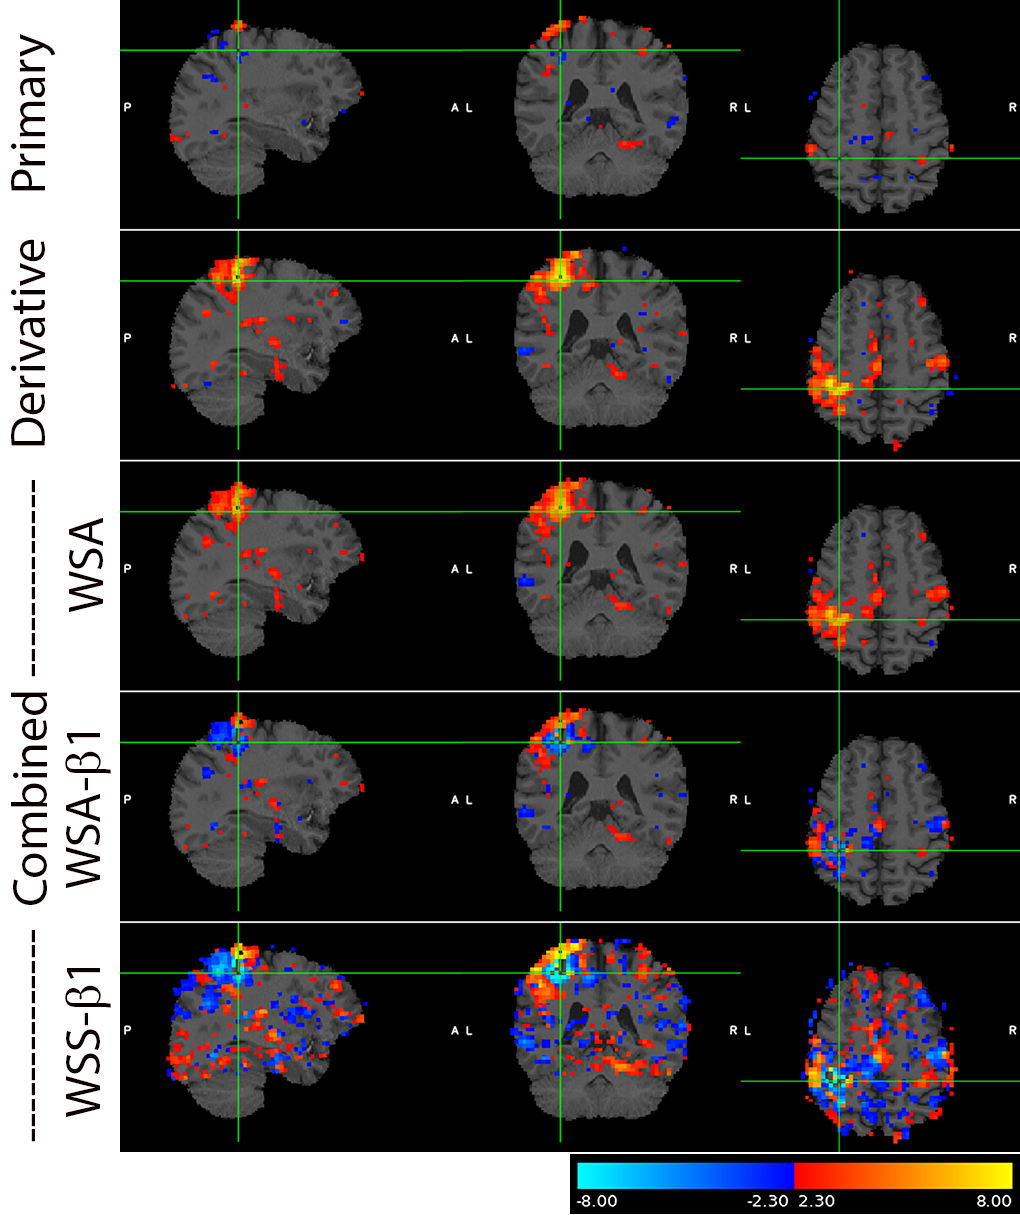
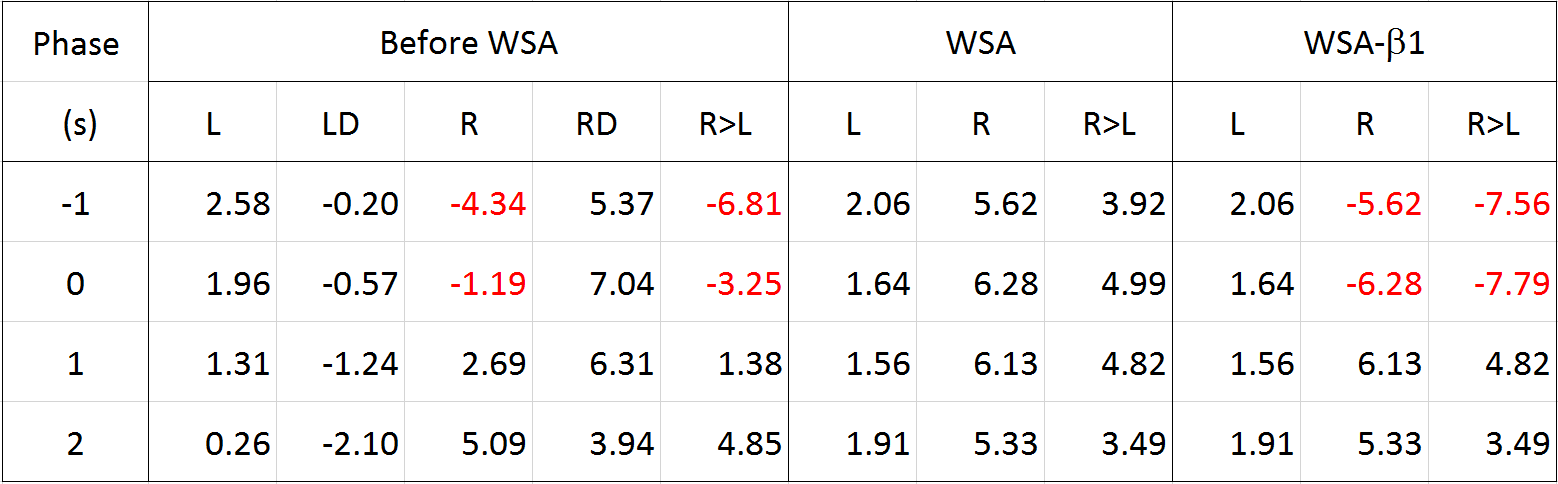
The BOLD activation maps of the blocked and event-related designs are shown in Fig. 1. In the block fMRI the expected motor regions were activated in the primary estimate while they were negligibly activated in the derivative estimate. However, the BOLD maps of the event-related fMRI showed more activation in the derivative estimate, particularly in the right hand button press, which affected the ‘R>L’ contrast as well. The z-scores of the BOLD activation are summarized in Table 1 for a range of HRF’s phases. The relative contribution of the primary and the derivative estimates were dependent on the phase of HRF, which resulted in unreliable combined estimates. The proposed WSA method indeed restored the BOLD signal, while the existing methods failed (see Fig. 2 and Table 1). The WSA method was confirmed to yield a reliable BOLD map for a range of HRF's phases, which is shown in Fig. 3 and Table 1. Furthermore, the higher level ‘R>L’ contrast was reliably obtained from the WSA-processed R and L estimates for a range of HRF's phases. The same trend was reproduced in another subject.Conclusions
The proposed WSA method was confirmed to provide a correct sign and magnitude for a range of HRF's phases while the existing WSS methods failed. Furthermore, the proposed method was confirmed to estimate a correct higher level contrast between the WSA estimates. The temporal derivative method in GLM can finally be applied to the fMRI analysis without the effect of the latency problem using the proposed WSA method.Acknowledgements
A script provided from Dr. Steffener was helpful in obtaining the weights from the design matrix stored in the FSL Feat directory.References
1. Calhoun VD, et al. fMRI analysis with the general linear model: removal of latency-induced amplitude bias by incorporation of hemodynamic derivative terms. Neuroimage 2004;22(1):252-257.
2. Steffener J, et al. Investigating hemodynamic response variability at the group level using basis functions. Neuroimage 2010;49(3):2113-2122.
3. Pernet CR. Misconceptions in the use of the General Linear Model applied to functional MRI: a tutorial for junior neuro-imagers. Front Neurosci 2014;8:1.
Figures