2321
Approximation of 1H MRS glutamate from fMRI hemodynamic response function1Department of Psychiatry and Biobehavioral Sciences, University of California Los Angeles, Los Angeles, CA, United States, 2Department of Electrical and Computer Engineering, Auburn University, Auburn, AL, United States, 3Department of Psychology, Auburn University, Auburn, AL, United States, 4Alabama Advanced Imaging Consortium, Auburn University and University of Alabama Birmingham, Auburn, AL, United States
Synopsis
Functional MRI is a blood-based marker of neural activity. The transfer function relating the two is the hemodynamic response function (HRF), which varies across both brain regions and individuals. It is traditionally considered a confound in fMRI analysis; however, the underlying biophysics suggests that HRF might in part reflect local neurochemical substrates, specifically glutamate, GABA and serotonin. Here, we found evidence that HRF shape is associated with, and predictive of, 1H MRS glutamate in thalamus. These results open the possibility of approximating neurochemical concentrations using resting-state fMRI. Future studies could validate this in an independent and larger sample.
Introduction
Multimodal magnetic resonance spectroscopy/functional MRI (MRS/fMRI) provides complementary regional information from two modalities. However, unimodal acquisition of fMRI data is more commonly performed, often for cost and time considerations. It would be advantageous, therefore, if MRS information could be derived from fMRI alone.
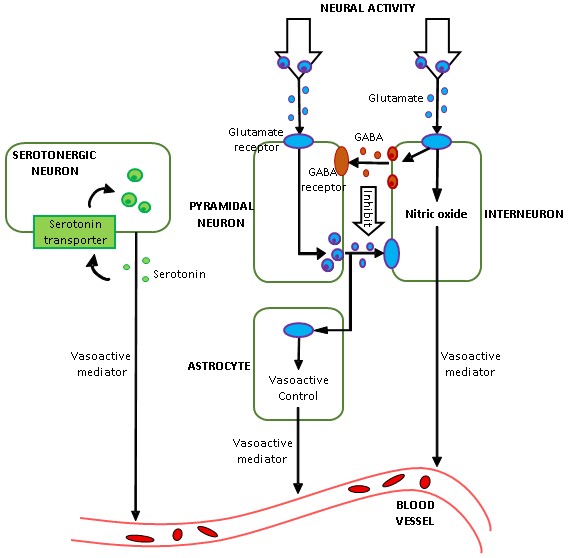
FMRI is an indirect measure of neural activity as it measures changes in blood oxygenation level. The hemodynamic response function (HRF) represents the transfer function that links neural activity with its vascular after-effects. HRF varies across brain regions and individuals [1]. The prevailing approach is to minimize the effect of HRF in fMRI data, so that underlying latent neural activity can be inferred without confounds. In contrast, the underlying biophysics mediated by vasodilation/vasoconstriction suggests that HRF contains correlates of neurochemicals (Fig.1), especially glutamate, GABA and serotonin [2] [3] [4], but this has never been directly tested. Here, we tested MRS-HRF associations and the ability of the HRF, estimated from resting-state fMRI, to predict MRS-glutamate values. MRS associations with other regional fMRI measures have been inconclusive [5] [6]. No studies have attempted to predict MRS from fMRI.
Methods
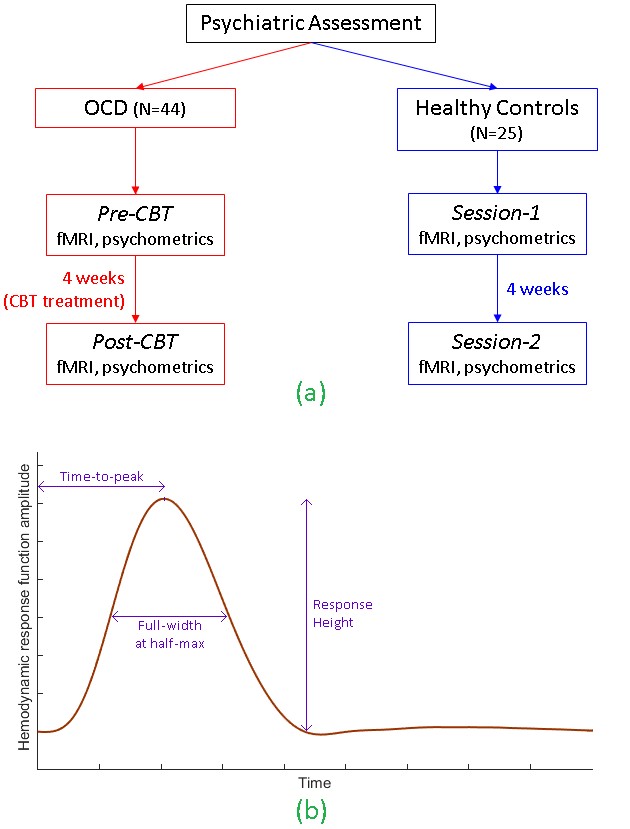
1H MRS glutamate and resting-state fMRI data were obtained from a longitudinal sample of 25 healthy controls (HC) scanned twice (in a 3T Siemens Trio) and 44 adults with obsessive-compulsive disorder (OCD) before and after 4-weeks of intensive cognitive-behavioral therapy (CBT). This dataset was useful to evaluate whether the hypothesized MRS-HRF relationship is affected by psychiatric disease, interventional treatment or repeated scanning. Single-voxel water-suppressed point-resolved spectroscopy (PRESS) MRS (TR/TE=2000/30ms, 96 NEX, voxel-size=15×15×15 mm3) was obtained in 6 regions-of-interest (ROIs): bilateral pregenual anterior cingulate cortex (pACC), anterior mid-cingulate cortex (aMCC) and thalamus. Whole-brain resting-state fMRI: T2*-weighted EPI, eyes closed runtime=7 min; TR/TE=2000/25ms; flip-angle=78°; matrix=64×64; field of view=195mm; voxel-size=3×3×3 mm3; total interleaved slices=35. Data were obtained on two occasions for each participant (Fig.2a): (i) OCD participants, pre- and post-CBT, and (ii) HCs, sessions 1 and 2 separated by 4 weeks.
MR spectra were fit with LCModel to measured levels of glutamate, and corrected for white-matter and CSF in each voxel. For fMRI, motion correction was performed but coregistration was not performed, because the ROIs were defined in each participant’s native brain space as 15mm-diameter spheres around the exact centroids of each MRS voxel location, to align MRS voxels and fMRI ROIs. ROI timeseries were extracted and hemodynamic deconvolution was performed to estimate the HRF [7]. The technique considers resting-state fMRI as a spontaneous pseudo-event-related signal and uses a variant of Wiener deconvolution. HRF shape was characterized by three parameters: response height (RH), time-to-peak (TTP), and full-width at half-maximum (FWHM) [8] (Fig.2b). First, we assessed associations between HRF parameters and MRS glutamate using the entire dataset. Next, we developed a linear support vector regression model for the MRS-HRF relationship in the OCD group (the larger group, for robustness), and tested it on the HC group to predict experimentally obtained glutamate concentrations in the control participants.
Results and Discussion
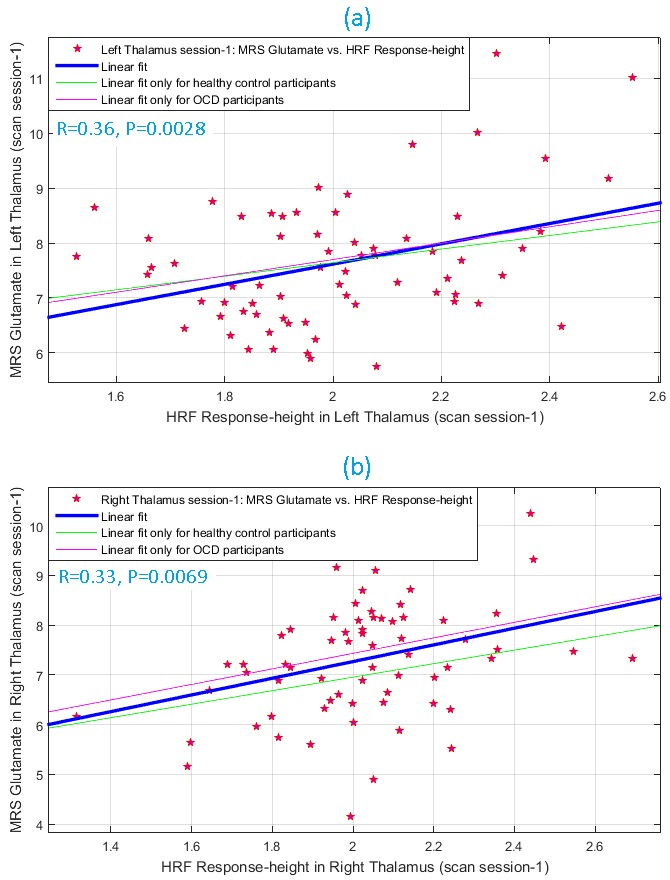
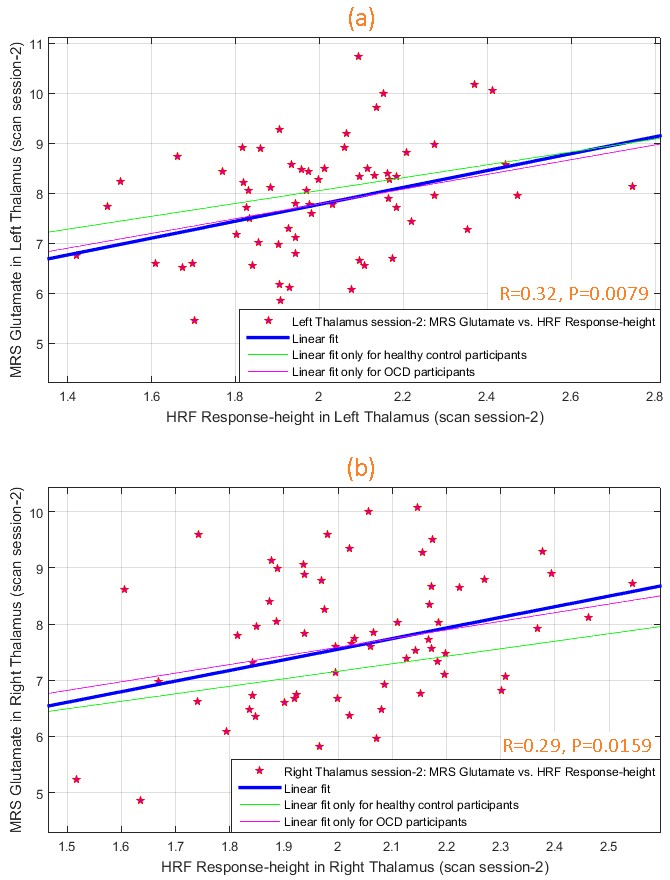
During scan-1, glutamate and HRF RH were significantly associated (Fig.3) in left (R2=0.13, R=0.36, P=0.0028) and right (R2=0.11, R=0.33, P=0.0069) thalami. This was replicated in scan-2 (Fig.4) in both left (R2=0.10, R=0.32, P=0.0079) and right (R2=0.09, R=0.29, P=0.0159) thalami, assuring test-retest reliability. The association was not significant in other ROIs, though a trend was observed in bilateral pACC (P=0.07 to 0.2 across both scans). Overall the associations were consistent between hemispheres and across scans. TTP and FWHM were not associated with glutamate.
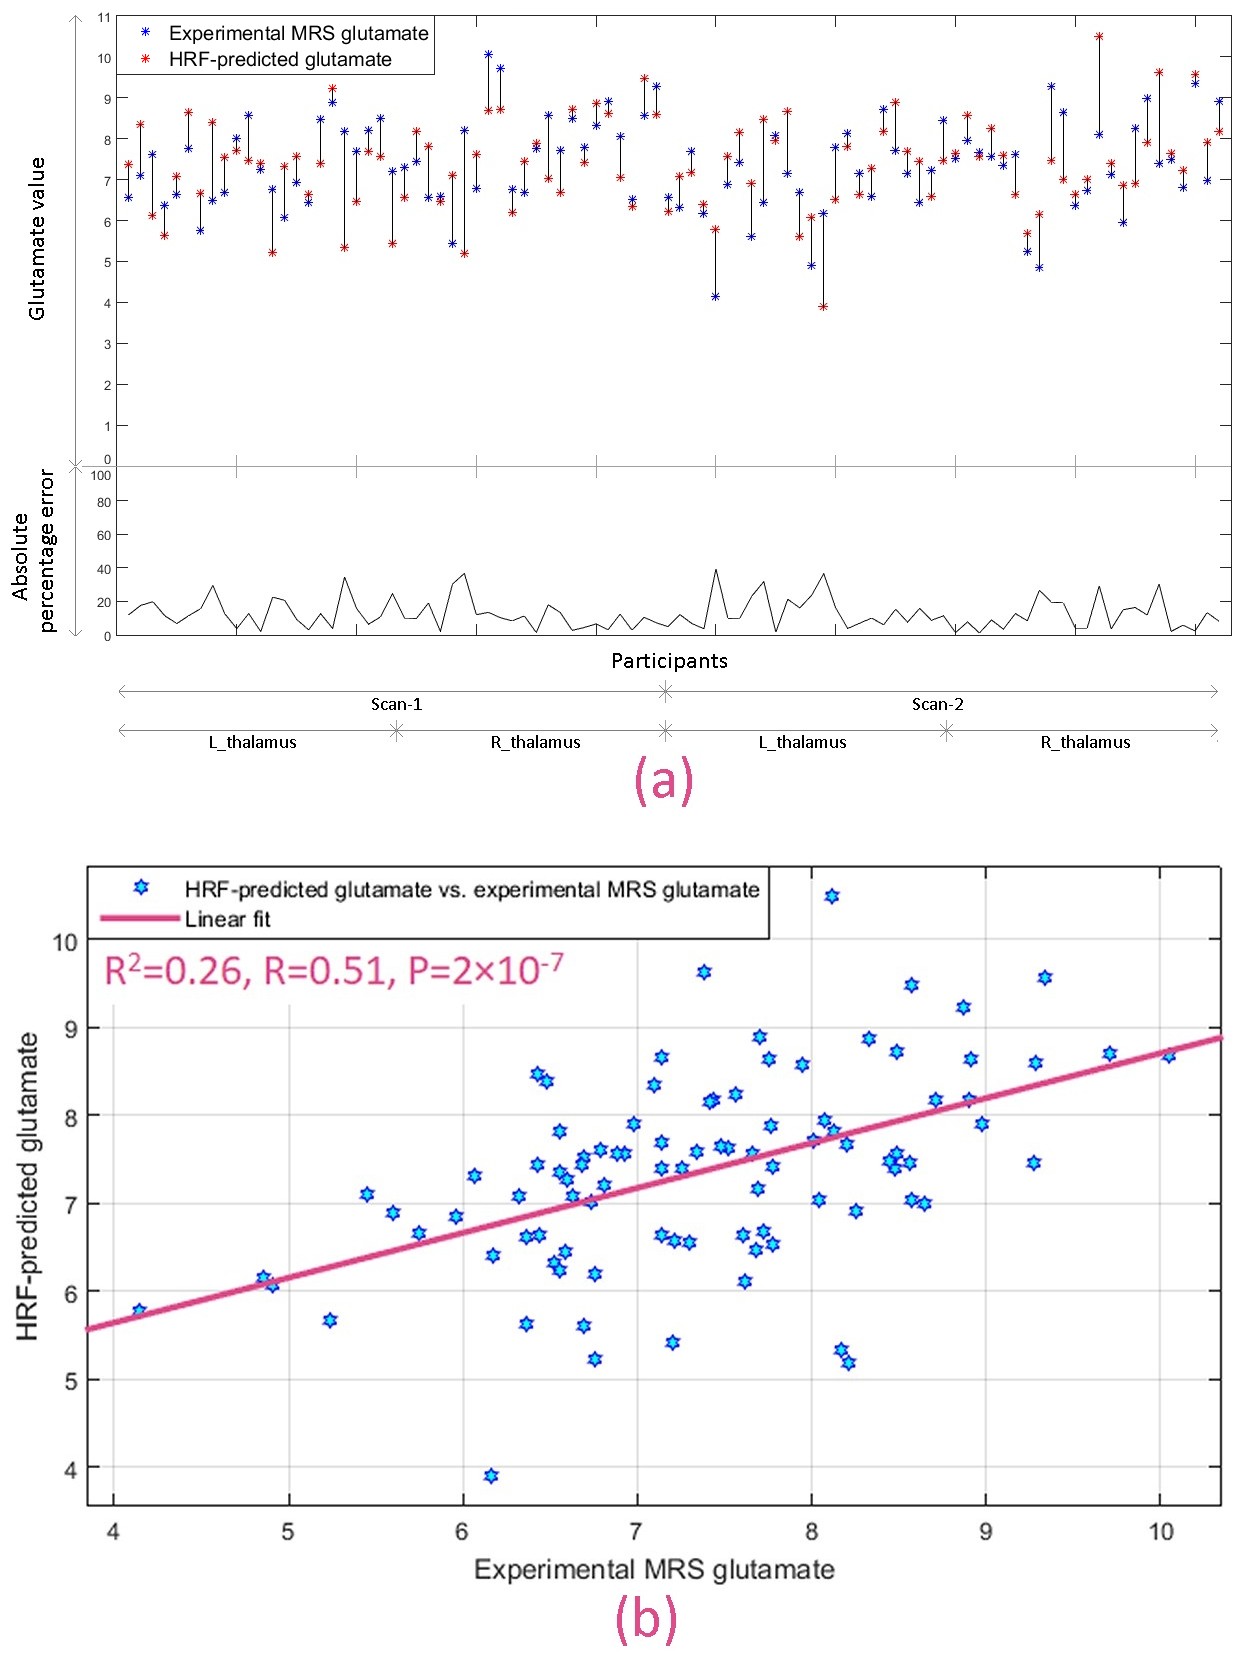
Next, we developed a Glu-RH regression model in the thalami using OCD group, and predicted glutamate values in HC using it. We found that RH in HC participants was able to predict experimental glutamate values in the same participants with mean absolute percentage error of 13%, although the model itself was trained using the OCD sample. Fig.5a shows the error in predicted glutamate for each participant. In addition, estimated and observed MRS glutamate values in HC sample were significantly associated (Fig.5b) (R2=0.26, R=0.51, P=2×10⁻⁷).
While the findings are intriguing, it must be acknowledged that MRS glutamate is only an approximation of true glutamate and the HRF is impacted by several factors apart from glutamate, including vasculature, other neurochemicals, and neural activity [1]. Therefore, there is likely a modest “ceiling” for how tightly MRS glutamate and HRF are associated.
Nonetheless, if our findings are replicated in independent and larger samples, this first-of-a-kind study suggests that information contained in the MRS glutamate signal can be approximated from fMRI HRF alone, at least regionally. This could enable fMRI studies to draw inferences similar to MRS, albeit with less confidence.
Acknowledgements
This study was supported by NIMH grant R01 MH085900 (to Drs. Feusner and O’Neill).References
[1] D. A. Handwerker, J. M. Ollinger and M. D'Esposito, "Variation of BOLD hemodynamic responses across subjects and brain regions and their effects on statistical analyses," Neuroimage, vol. 21, no. 4, pp. 1639-51, 2004.
[2] S. D. Muthukumaraswamy, C. J. Evans, R. A. Edden, R. G. Wise and K. D. Singh, "Individual variability in the shape and amplitude of the BOLD-HRF correlates with endogenous GABAergic inhibition," Human Brain Mapping, vol. 33, no. 2, pp. 455-65, 2012.
[3] Z. Cohen, G. Bonvento, P. Lacombe and E. Hamel, "Serotonin in the regulation of brain microcirculation," Progress in Neurobiology, vol. 50, no. 4, pp. 335-62, 1996.
[4] G. G. Brown, L. T. Eyler Zorrilla, B. Georgy, S. S. Kindermann, E. C. Wong and R. B. Buxton, "BOLD and perfusion response to finger-thumb apposition after acetazolamide administration: differential relationship to global perfusion," Journal of Cerebral Blood Flow and Metabolism, vol. 23, no. 7, pp. 829-37, 2003.
[5] Y. Hu, X. Chen, H. Gu and Y. Yang, "Resting-state glutamate and GABA concentrations predict task-induced deactivation in the default mode network," J Neurosci., vol. 33, no. 47, pp. 18566-73, 2013.
[6] M. Cleve, A. Gussew, G. Wagner, K. Bär and J. Reichenbach, "Assessment of intra- and inter-regional interrelations between GABA+, Glx and BOLD during pain perception in the human brain - A combined 1H fMRS and fMRI study," Neuroscience, p. in press, 2017.
[7] G. Wu, W. Liao, S. Stramaglia, J. Ding, H. Chen and D. Marinazzo, "A blind deconvolution approach to recover effective connectivity brain networks from resting state fMRI data," Medical Image Analysis, vol. 17, no. 3, pp. 365-374, 2013.
[8] D. Rangaprakash, M. N. Dretsch, W. Yan, J. S. Katz, T. S. Denney and G. Deshpande, "Hemodynamic variability in soldiers with trauma: Implications for functional MRI connectivity studies," NeuroImage: Clinical, vol. 16, pp. 409-417, 2017.
[9] C. Reynell and J. Harris, "The BOLD signal and neurovascular coupling in autism," Developmental Cognitive Neuroscience, vol. 6, pp. 72-79, 2013.
Figures