2319
Investigating the Functional Diffusion-Signal Response (DfMRI) in Living, CA1 Pyramidal Neurons Undergoing Chemical Activation with Kainate1Neuroscience, University of Florida, Gainesville, FL, United States, 2McKnight Brain Institute, University of Florida, Gainesville, FL, United States, 3Biomedical Engineering, University of Florida, Gainesville, FL, United States, 4Radiology, University of Florida, Gainesville, FL, United States, 5Center for Functionally Integrative Neuroscience, Aarhus University, Aarhus, Denmark, 6National High Magnetic Field Laboratory, Florida State University, Tallahassee, FL, United States
Synopsis
In the current study, we use MR microscopy and superfusion techniques to investigate changes in the diffusion properties of living, hippocampal neurons following activation with kainate. Acute hippocampal slice preparations (n = 6) were imaged at six different b values (b = 0 to 3200 s/mm2) both before and after exposure to kainate (100mM). Significant activation-based changes (p = 0.0043) in diffusion properties were detected in the stratum pyramidale: the tissue lamina comprised primarily of pyramidal neuron cell bodies. No changes were observed in either the strata oriens (apical dendrites) or radiatum (axons).
INTRODUCTION
Diffusion contrast is regularly used to reveal the microstructural details of biological tissues. Its sensitivity to water content and movement make it a likely tool for detecting function by tracking the changes in compartmentation of intra and extra cellular water that take place during neuronal firing1,2. While such contrast is attractive for its potential use in functional MRI studies, questions remain as to the true biological mechanism responsible for the signal changes reported in DfMRI studies. In order to better understand the cellular origins of DfMRI signal contrast, we have conducted functional activation experiments in acute hippocampal slice preparations at resolutions (15.6mm in-plane) high enough to quantify diffusion data from individual lamina.
METHODS
Diffusion-weighted MR data (TR/TE = 2000/12.9, D = 6.5ms, d = 1.3ms, resolution = 15.6mm in-plane, avg = 4, scan time = 8.5min) were acquired (Fig. 2) at six diffusion weightings (b = 0, 150, 340, 900, 1600, and 3200 [b effective = 600, 700, 800, 1300, 2000, 3600 s/mm2]) while using a micro perfusion and oxygenator system interfaced to a modified surface coil (200mm diameter) as described previously3. Acute, rat hippocampal slices (n = 6) were maintained over a time course of 3.3 h. Two identical diffusion imaging series were collected: one before and one after slices were activated with 100mM kainate. Diffusion signal properties before and after kainate exposure were compared independently in the strata oriens, pyramidale and radiatum.RESULTS
The hippocampal layer containing the perikarya of pyramidal neurons (S.P., Fig. 1) exhibited a significant change in diffusion properties between the inactive and active functional states (p = 0.0043, Fig. 3). This result maintained its significance at a 95% confidence interval even when subjected to a Bonferroni correction for multiple comparisons (0.05/3 = 0.017; 0.0043 < 0.017). The diffusion properties in both the strata oriens (S.O.) and radiatum (S.R.) remained constant between rest and activation.
DISCUSSION and CONCLUSIONS
In the current study, we report a significant, activation dependent change in the diffusion properties of neuronal soma occurring within the pyramidal cell layer of the rat hippocampus. An increase in the apparent diffusion coefficient (ADC)—i.e., a drop in diffusion signal—has also been reported in the cell bodies of Aplysia ganglia activated with dopamine2. Interestingly, the drop in ADC—i.e., an increase in diffusion signal—that is considered the hallmark of DfMRI signal contrast was not observed in any of the three tissue types studied. Given the recent evidence that DfMRI contrast is absent from neural tissues undergoing normal, non-pathological activity4, these findings indicate that signal changes associated with DfMRI contrast may be the result of neuronal swelling or gliosis rather than function.
Acknowledgements
Project funded by the NIH (R21 NS094061) and the NSF through the National High Magnetic Field Laboratory.
References
1. Aso T, Urayama S, Poupon C, et al. An intrinsic diffusion response function for analyzing diffusion functional MRI time series. NeuroImage 2009;47(4):1487-95.
2. Abe Y, Nguyen KV, Tsurugizawa T, et al. Modulation of water diffusion by activation-induced neural cell swelling in Aplysia Californica. Sci Rep. 2017;doi:10.1038/s41598-017-05586-5. Accessed October 22, 2017.
3. Flint JJ, Menon K, Hansen B, et al. A Microperfusion and In-Bore Oxygenator System Designed for Magnetic Resonance Microscopy Studies on Living Tissue Explants. Sci Rep. 2015;doi:10.1038/srep18095. Accessed October 25, 2017.
4. Bai R, Stewart CV, Plenz D, et al. Assessing the sensitivity of diffusion MRI to detect neuronal activity directly. PNAS. 2016;113(12):E1728–E1737, doi:10.1073/pnas.1519890113. Accessed October 25, 2017.
Figures
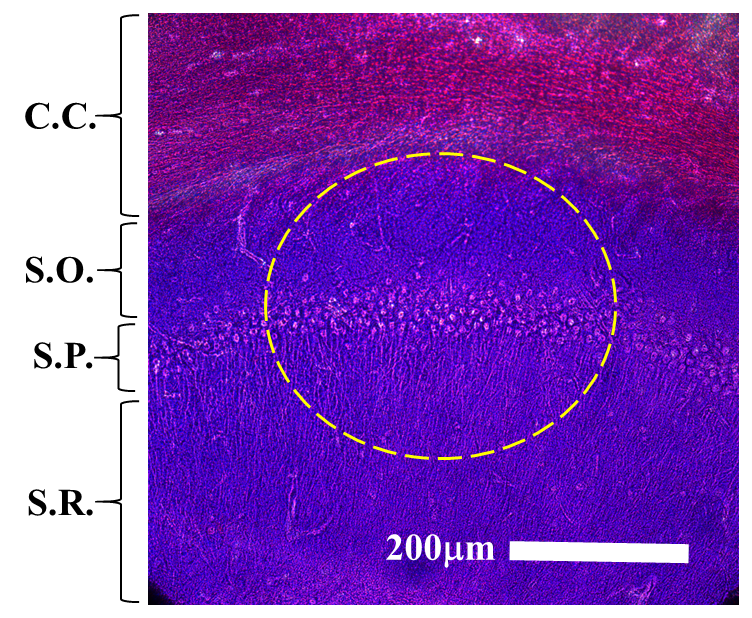
Fig 1. Formaldehyde-fixed, Cresyl violet stained hippocampal histology section detailing the lamellar organization of the CA1 region. Individual tissue layers include the corpus callosum (C.C.), stratum oriens (S.O.), stratum pyramidale (S.P.), and stratum radiatum (S.R.). The approximate area of tissue excited by the 4-turn, 200mm diameter surface coil is highlighted (dashed yellow line).
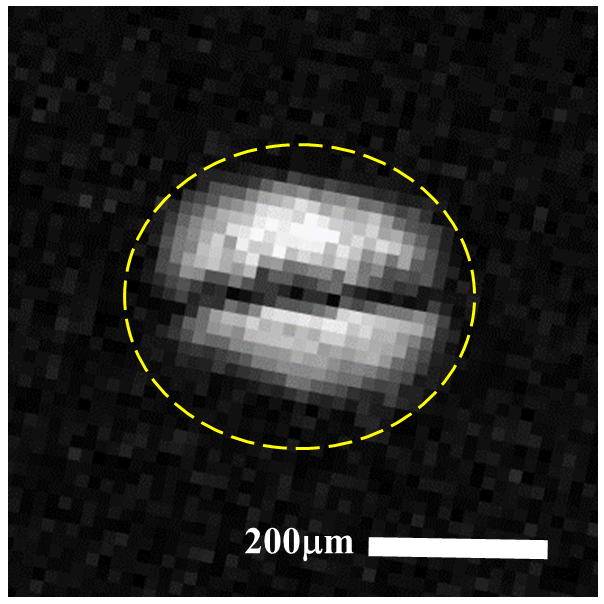
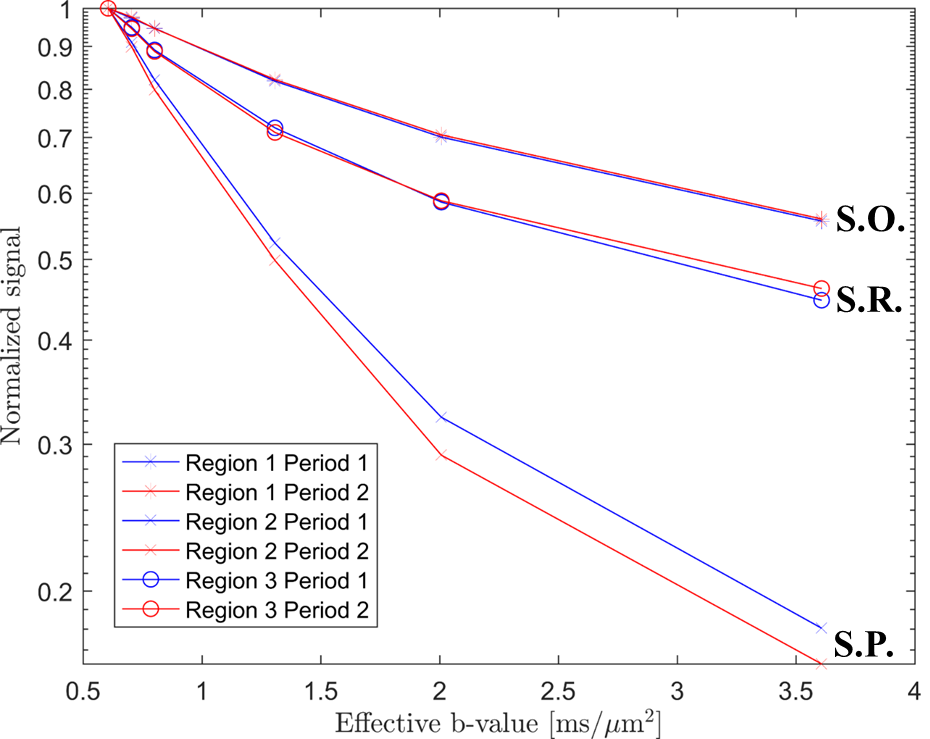
Fig 3. Diffusion signal decay measured in individual hippocampal lamina (strata oriens [S.O.], pyramidale [S.P.] and radiatum [S.R.]) during periods of rest (Period 1, blue) and kainate induced activation (Period 2, red). Divergence of the signal curves upon increased diffusion weighting is indicative of changes in the diffusion properties of the tissue layers between rest and activation. Such a change is observed in the cell soma layer (S.P.) but not in adjacent layers.