2317
Bladder Filling Induced Changes to Cerebral Blood Flow and BOLD Response1Biomedical Engineering, Stony Brook University, Stony Brook, NY, United States, 2Urology, Stony Brook University Hospital, Stony Brook, NY, United States, 3Radiology, Stony Brook University Hospital, Stony Brook, NY, United States
Synopsis
Overactive bladder affects a significant portion of women in the US (~15%). Women with this syndrome experience a frequent pathologic desire to urinate with a profound impact on their quality of life and productivity. It is unclear how cerebral perfusion changes as the bladder fills. In this study eight healthy female participants were imaged with a double-echo EPI sequence for simultaneous ASL and BOLD acquisition. Bladder filling by urethral catheter was used to assess the brain’s response at filling volumes of 0, 50, 100, 200, 350 and 500mL. Increased blood flow was observed at low urgency compared to baseline while decreased blood flow was observed at high urgency compared to low urgency.
Introduction:
Over active bladder (OAB) is characterized by the pathologic desire to urinate that cannot be suppressed1. This disorder affects ~15% of women in the US and most treatment options are ineffective2. Currently, knowledge of the underlying mechanisms of OAB is limited with no clear link to anatomical abnormalities3. In this study, double-echo (DE) simultaneous arterial spin labeling (ASL) and blood oxygen level dependent (BOLD) sequence was used to investigate the brain’s response to bladder filling. By measuring bladder filling induced changes in blood flow and BOLD fMRI signal, a more comprehensive understanding of the brain’s response can be achieved.Methods:
Eight healthy female participants were recruited with IRB approval and informed consent. All studies were performed on a 3T Prisma MRI (Siemens, Erlangen, Germany) with a 64-channel head/neck coil. DE-2D-EPI sequence was developed for simultaneous measurement of ASL and BOLD signal with parameters were: TR/TE1/TE2/Label time/Post label delay = 4000/12/30/1600/1200ms; matrix of 64×64; FOV of 24×24cm2; 26 contiguous 5 mm thick slices. High resolution MPRAGE images were acquired for co-reregistration and normalization to MNI space4. Subjects were instructed to void their bladder prior to imaging. Up to 6 sets of DE-2D-EPI images were acquired with bladder filling volumes of 0, 50, 100, 200, 350 and 500mL. Bladder filling was performed between acquisition of each set of images using a urethral catheter and injection of saline solution at a rate of 50mL/min. Three displayed prompts and a response box were used to document the subject’s urgency to void during the imaging session: first sensation of bladder filling, FIRST desire to void, and STRONG desire to void. If the subject expressed a strong desire to void before 500mL filling, additional bladder filling up to 500mL was administrated until the subject could no longer withhold their urine.
All DE-2D-EPI images were realigned to correct for motion with SPM12. Cerebral blood flow was calculated by simple subtraction of the first echo data (TE of 12 ms) and the single-compartment model5. R2* was calculated as a single exponential fit to the first and second echoes without ASL preparation (control images). Average CBF and R2* values in nine regions of interest (ROIs) were calculated. Left and right ROIs were selected using WFU PickAtlas6; anterior cingulate cortex (ACC), dorsolateral pre-frontal cortex (DLPFC), hippocampus, insula, posterior cingulate cortex (PCC), pons/midbrain, sensorimotor cortex (SMC), supplementary motor area (SMA), and thalamus. Global CBF values were also calculated to normalize regional CBF. Average values for baseline (0mL), low and high urgency states (before and after “strong desire to void” respectively) were calculated and differences were evaluated with a two-tailed, paired t-test.
Results:
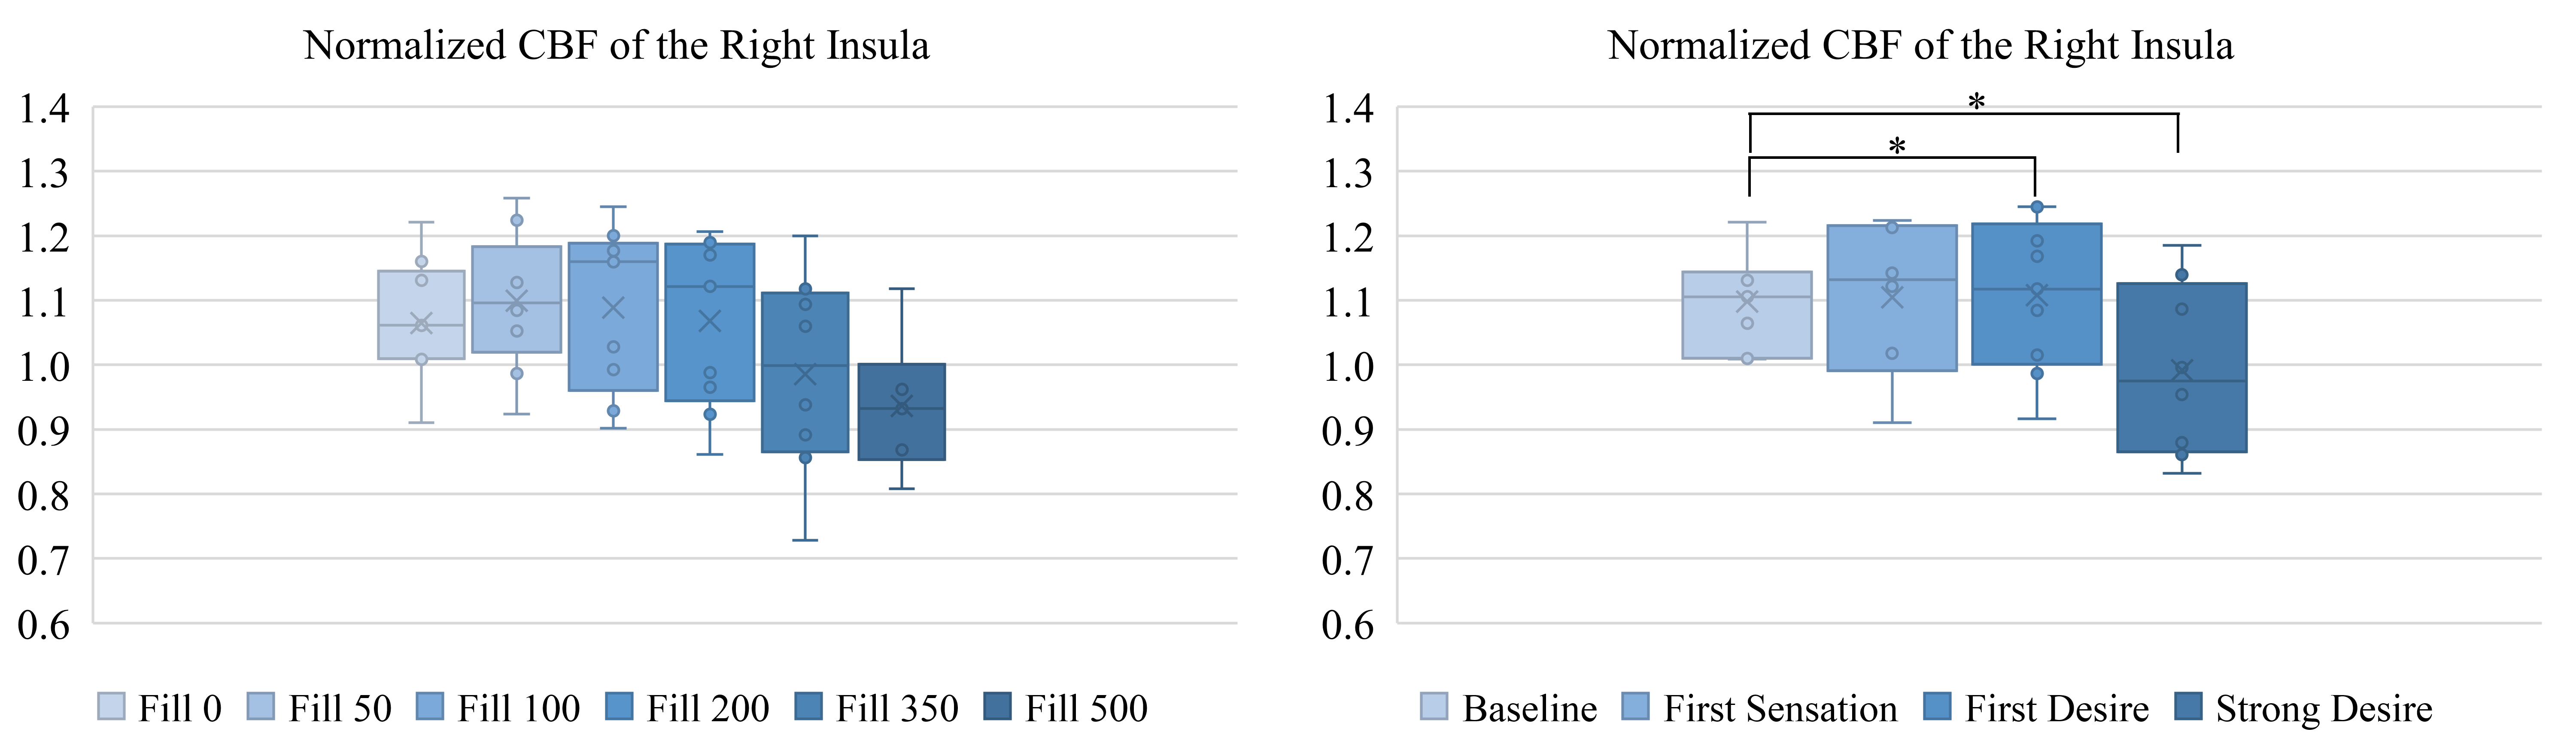
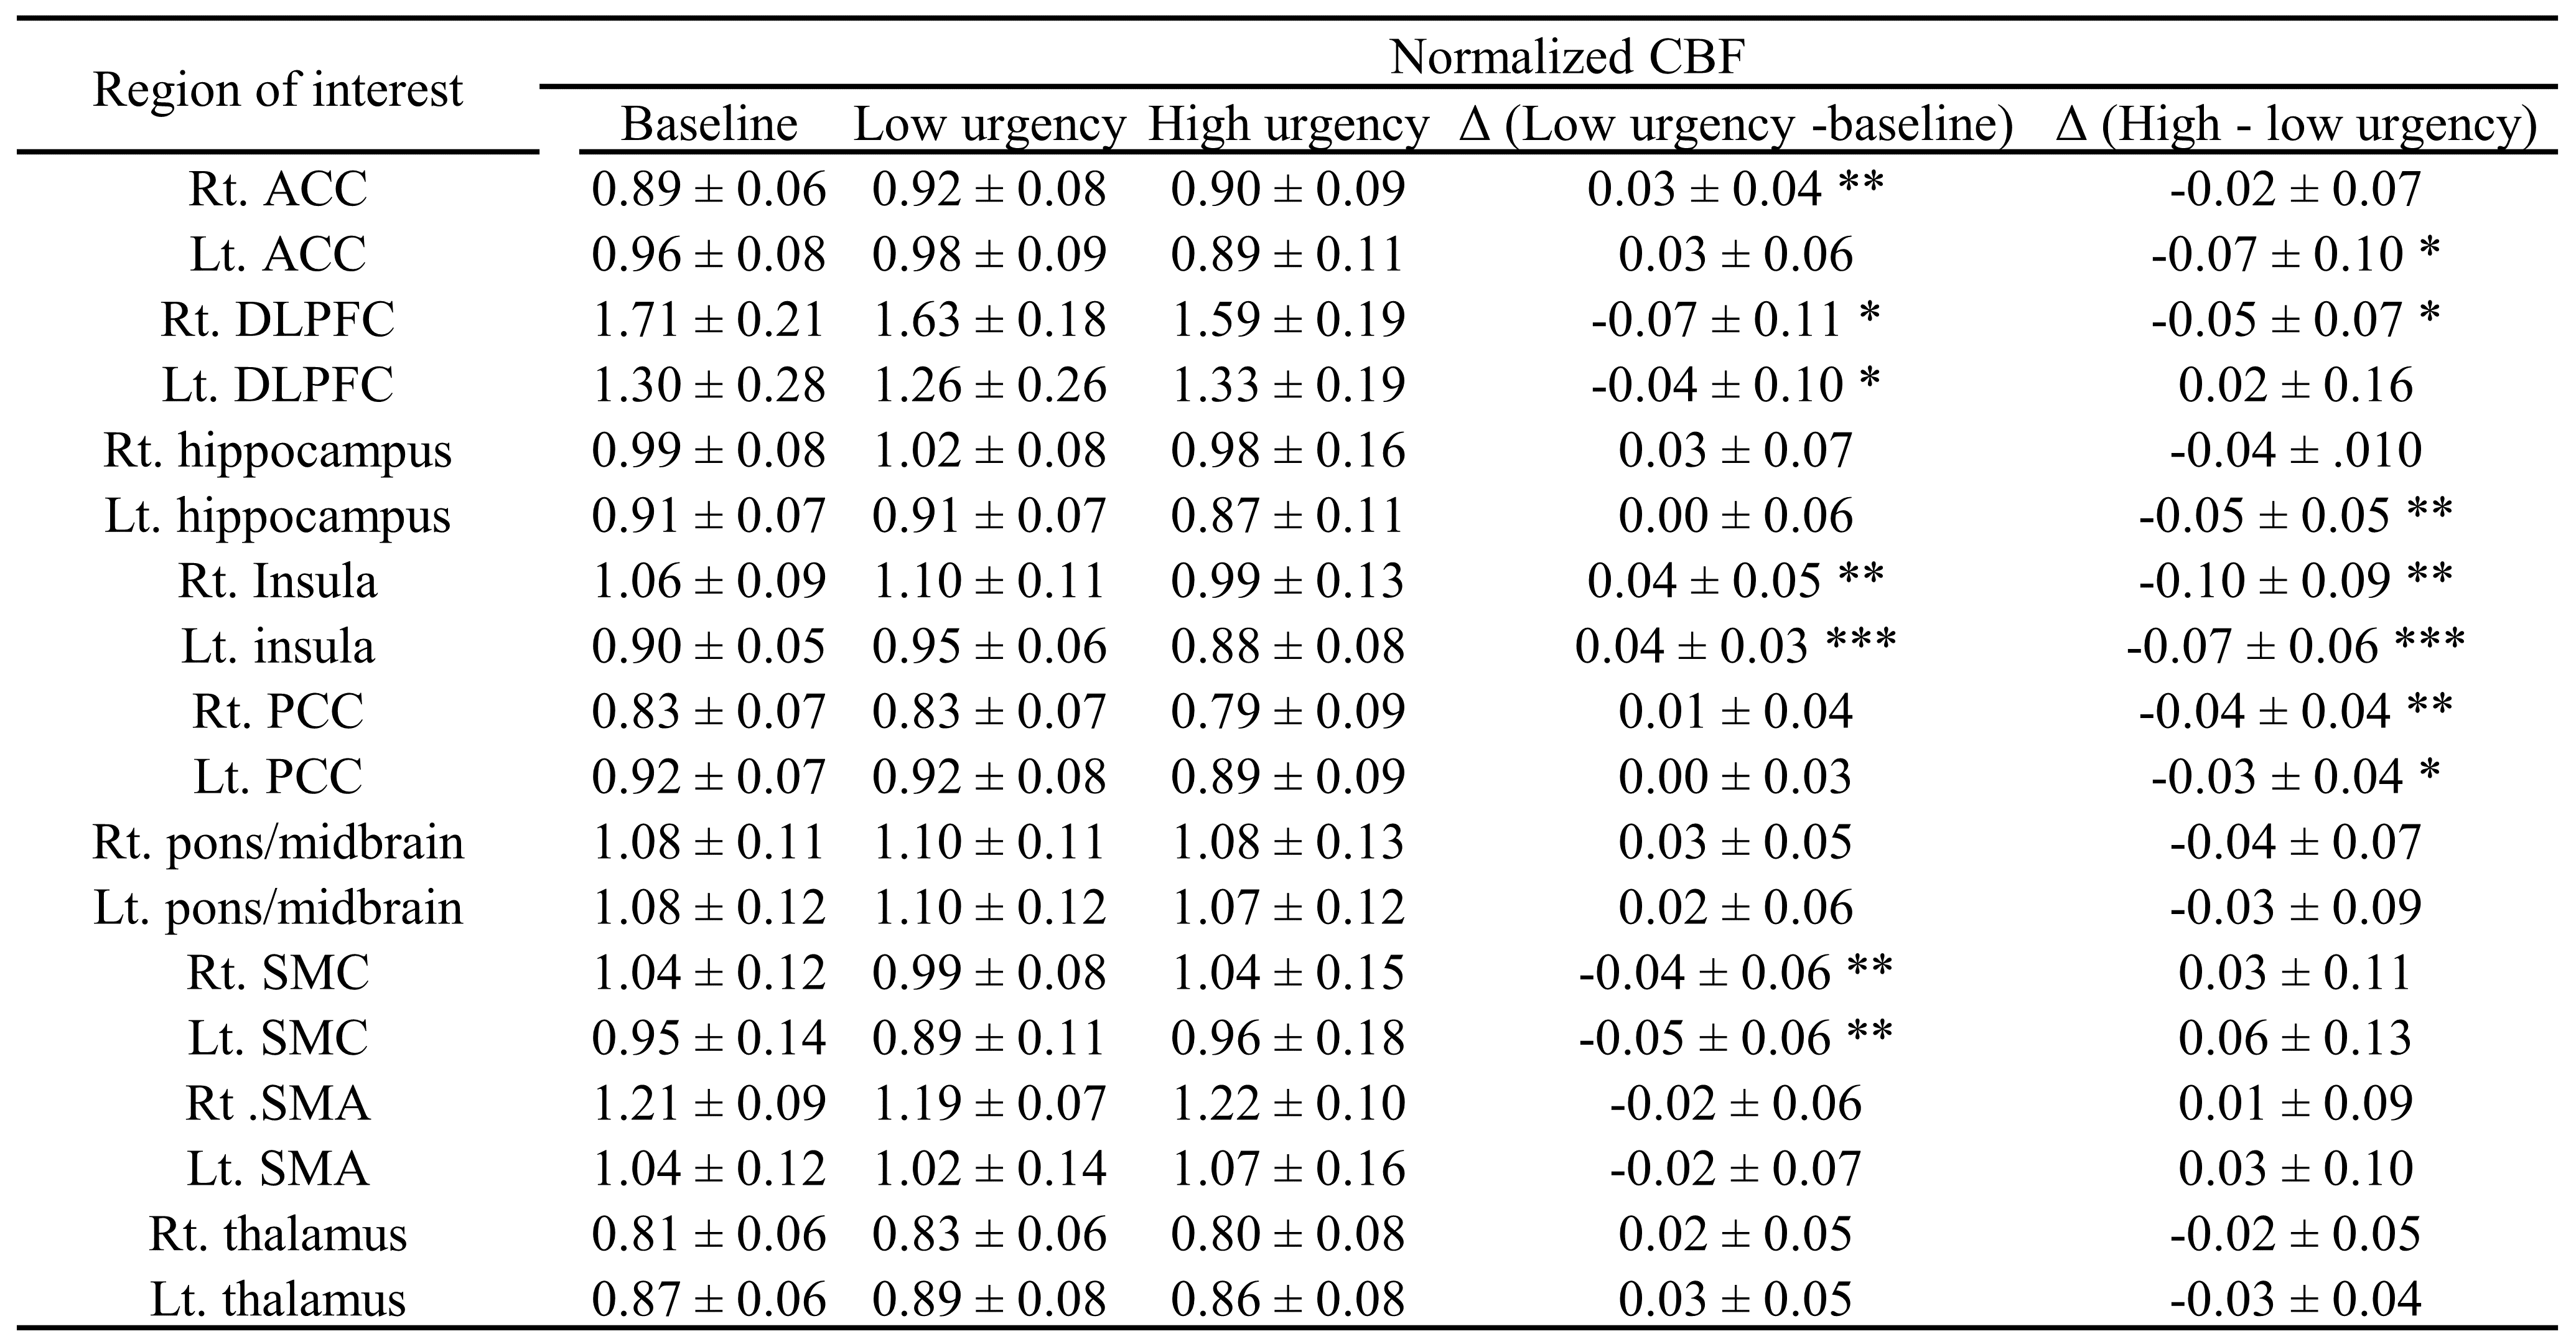
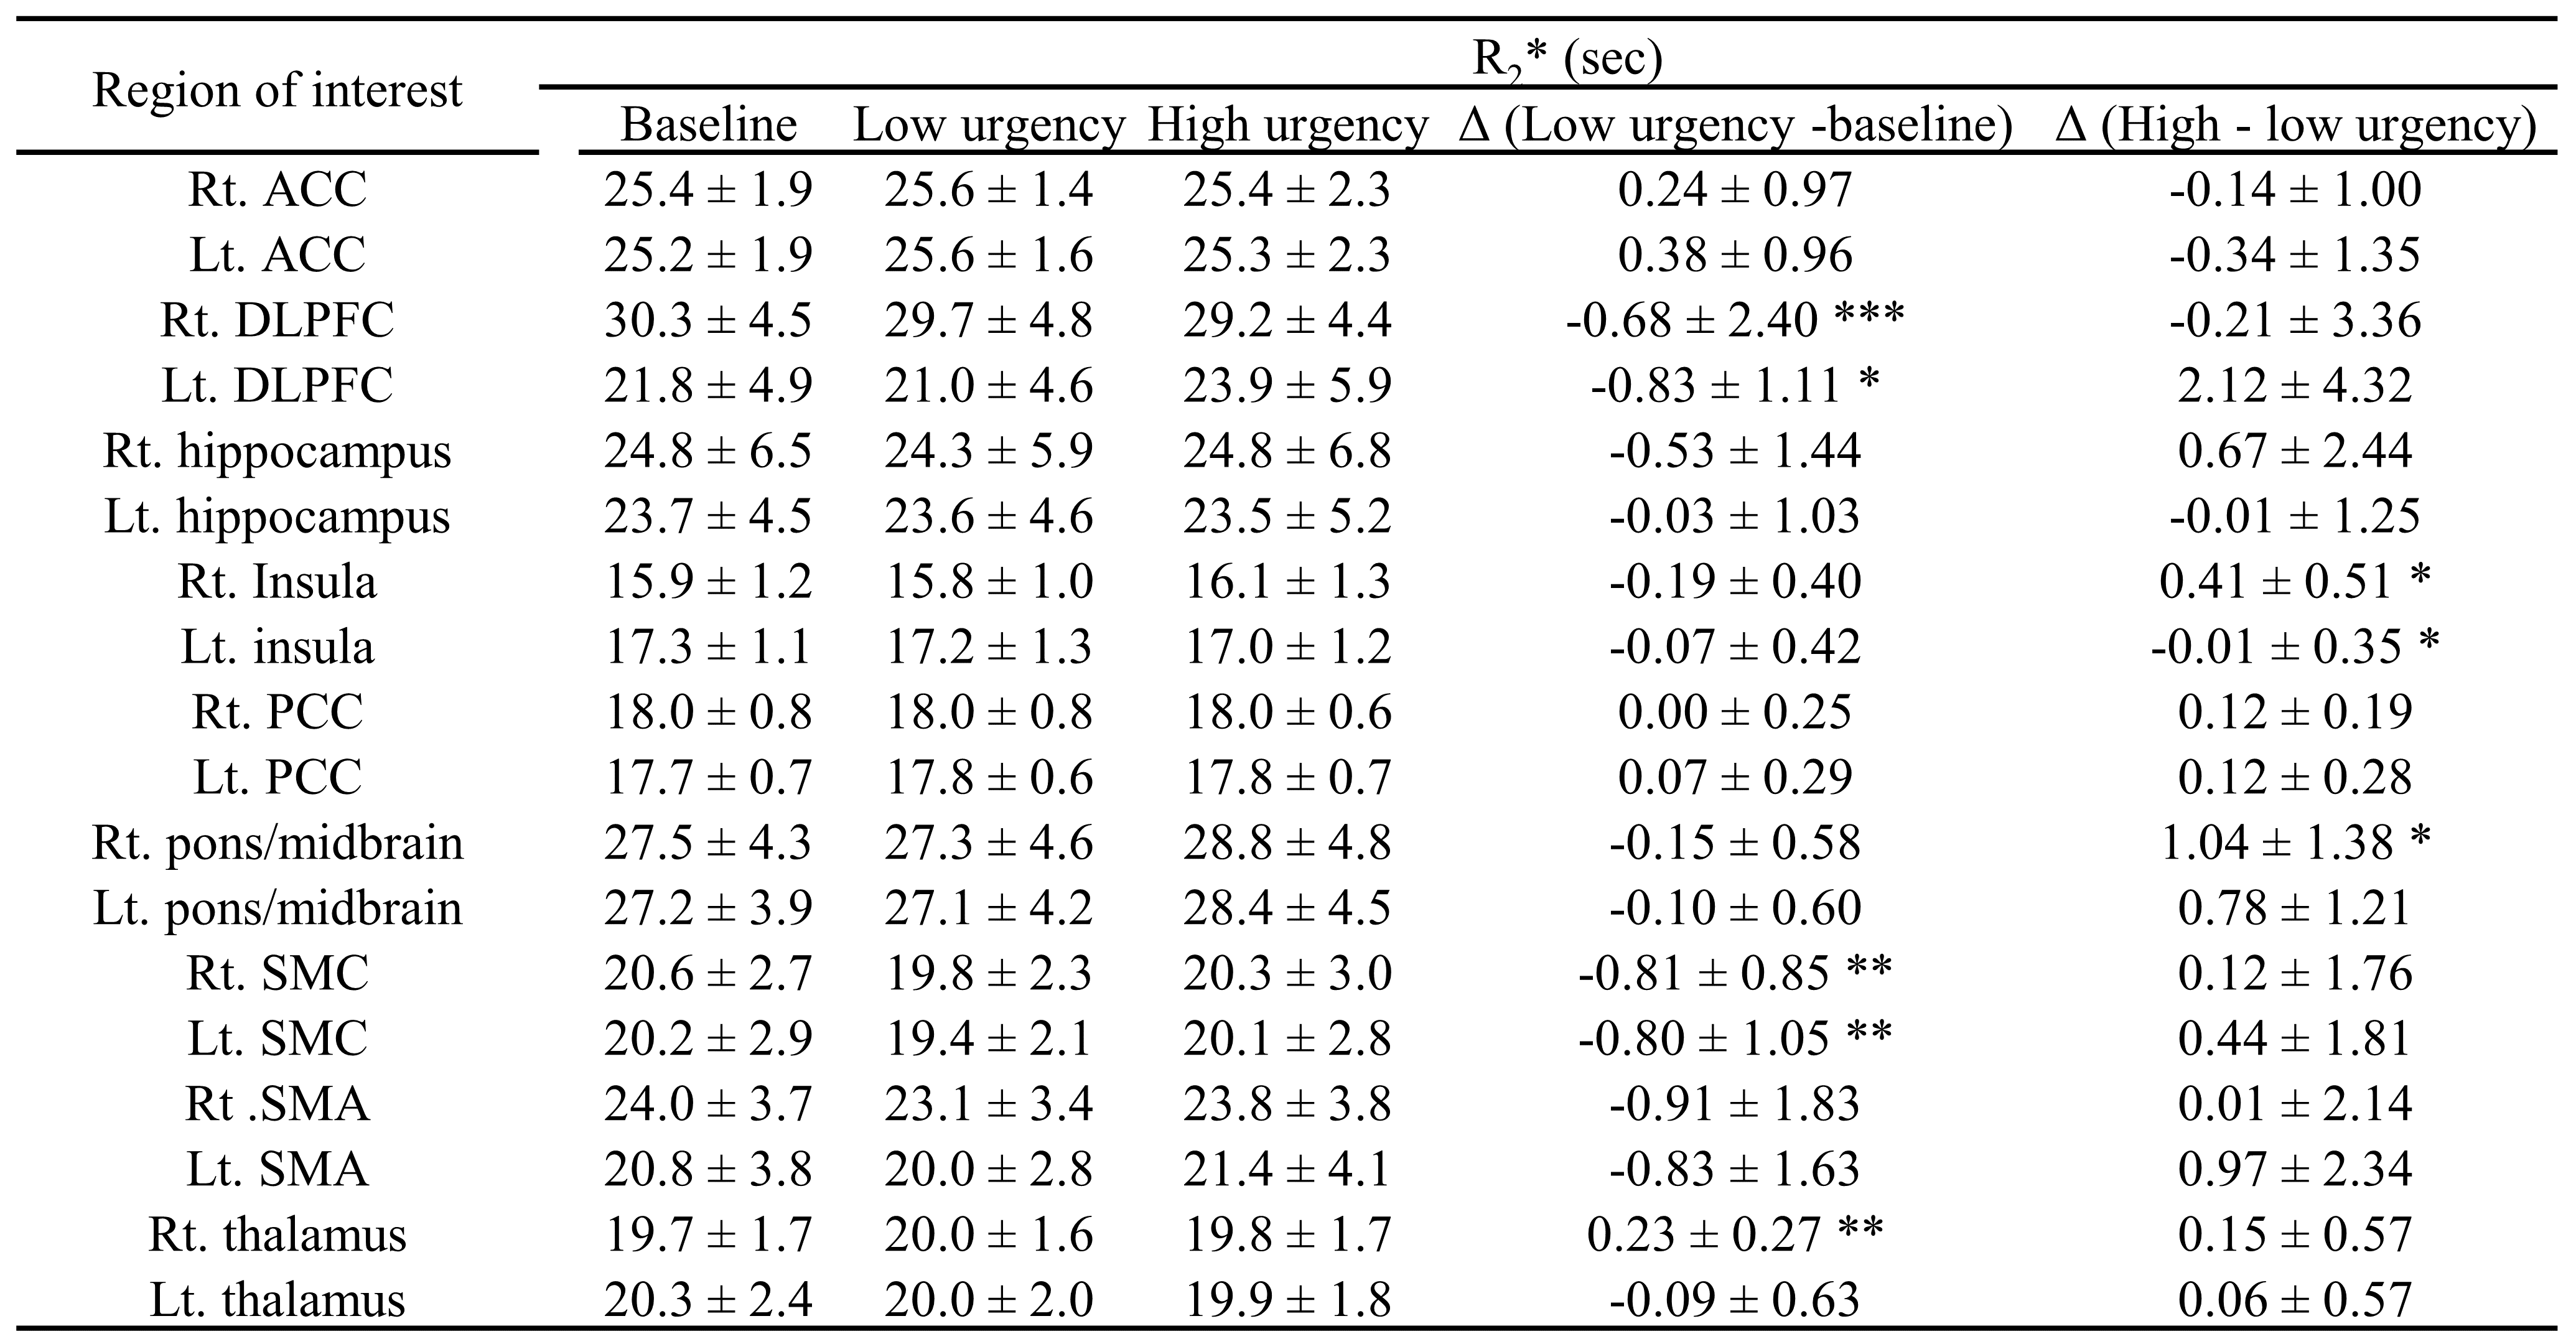
On average, participants experienced first and strong desire to void after 112 and 284mL filling respectively. As demonstrated in Fig. 1, a steady increase followed by steep decrease in CBF was observed as a function of filling volume and urgency. Tables 1 and 2 show normalized CBF and absolute R2* values respectively, during baseline, low and high urgency states for the selected ROIs. The insula exhibited significantly increased perfusion at low urgency when compared to baseline while the SMC exhibited decreased perfusion for the same comparison. Significantly decreased perfusion was observed in the insula and PCC at high urgency when compared to low urgency. The DLPFC and SMC exhibited significantly decreased R2* at low urgency when compared to baseline while the SMC exhibited decreased perfusion for the same comparison. Significantly increased R2* was observed in the right insula and right pons/midbrain at high urgency when compared to low urgency.Discussion:
This study provided a robust investigation of cerebral blood flow and BOLD response associated with bladder filling. Multiple regions associated with the limbic system demonstrated decreased blood flow at high urgency. The insula, in particular, is well documented to play a role in homeostasis as part of the autonomic nervous system7. Previous BOLD fMRI studies, which were designed to look at activation in regions during the first desire to void, have observed an increase in BOLD signal due to bladder filling similar regions as in this study8. These results support the hypothesis that the suppression of a desire at high urgency results in deactivation of the regions that are activated by said desire9.Conclusion:
This study demonstrated differences in cerebral blood flow and BOLD signal of the limbic system at high and low urgency states under bladder filling. This study lays the foundation for investigating the difference responses in patients with OAB, which could provide insight into the neurological mechanisms involved in OAB disorder.Acknowledgements
No acknowledgement found.References
1. Sultan AH, Monga A, Lee J, et al. An International Urogynecological Association (IUGA)/International Continence Society (ICS) joint report on the terminology for female anorectal dysfunction. Neurourology and urodynamics. 2017;36(1):10-34.
2. Reynolds WS, Fowke J, Dmochowski R. The burden of overactive bladder on US public health. Current bladder dysfunction reports. 2016;11(1):8-13.
3. Arya NG, Weissbart SJ, Xu S, Bhavsar R, Rao H. Quantitative Changes in Cerebral Perfusion during Urinary Urgency in Women with Overactive Bladder. BioMed Research International. 2017;2017.
4. Penny WD, Friston KJ, Ashburner JT, Kiebel SJ, Nichols TE. Statistical parametric mapping: the analysis of functional brain images. Academic press; 2011.
5. Buxton RB, Frank LR, Wong EC, Siewert B, Warach S, Edelman RR. A general kinetic model for quantitative perfusion imaging with arterial spin labeling. Magnetic Resonance in Medicine. 1998;40(3):383-396.
6. Maldjian JA, Laurienti PJ, Kraft RA, Burdette JH. An automated method for neuroanatomic and cytoarchitectonic atlas-based interrogation of fMRI data sets. NeuroImage. 2003;19(3):1233-1239.
7. Craig AD. How do you feel? Interoception: the sense of the physiological condition of the body. Nature reviews neuroscience. 2002;3(8):655-666.
8. Arya NG, Weissbart SJ, Xu S, Rao H. Brain activation in response to bladder filling in healthy adults: An activation likelihood estimation meta‐analysis of neuroimaging studies. Neurourology and urodynamics. 2017;36(4):960-965.
9. Lerner A, Bagic A, Hanakawa T, et al. Involvement of Insula and Cingulate Cortices in Control and Suppression of Natural Urges. Cerebral Cortex. 2009;19(1):218-223.
Figures