2316
Force-related BOLD effects during naturalistic and symbolic effort observation1Department of Brain and Behavioral Sciences, University of Pavia, Pavia, Italy, 2Brain Connectivity Center, C. Mondino National Neurological Institute, Pavia, Italy, 3Department of Diagnostic Radiology, Faculty of Applied Medical Science, King Abdulaziz University (KAU), Jeddah, Saudi Arabia, 4Queen Square MS Centre, UCL Institute of Neurology, Faculty of Brain Sciences, University College London (UCL), London, United Kingdom, 5Brain Connectivity Center, University of Pavia, Pavia, Italy, 6Department of Electrical, Computer and Biomedical Engineering, University of Pavia, Pavia, Italy, 7Department of Physics, University of Milan, Milan, Italy, 8University College London (UCL), London, United Kingdom, 9Brain MRI 3T Research Centre, C. Mondino National Neurological Institute, Pavia, Italy
Synopsis
In this pilot study, we used a 3-condition fMRI squeezeball paradigm to study the non-linear BOLD response to varying grip force (GF) during action execution (AE, subjects performed the task), action observation (AO, subjects watched a video of the task) and AO with visual cue (AOvc). fMRI activity patterns in brain circuits controlling AE, AO and AOvc account for different GF applied to an object or perceived from others’ action. AO and AOvc calls different processing depending on the presence or the absence of the visual cue indicating specific regions and BOLD-GF relations for the effort perception.
Introduction
Activation of the action execution-observation network in subjects observing motor tasks is thought to provide a cue for imitation learning, providing the basis for motor training [1, 2]. Crucially, several motor areas activated during the execution of a motor task are activated during observation of the same task when performed by others [3, 4]. The relationship between an applied grip force (GF) and BOLD signals shows characteristic non-linearity in cerebral and cerebellar regions [5]. Using a squeezeball paradigm, we asked whether the non-linear behaviour of the BOLD response to varying GF levels is reproduced when observing, with or without symbolic cues, others performing the task.Methods
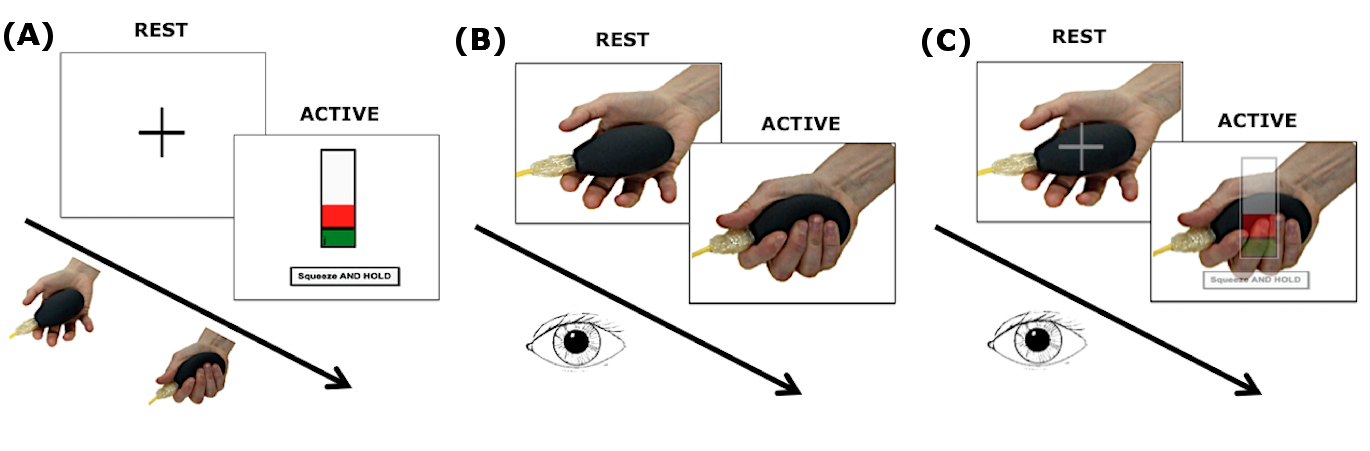
Subjects: 12 subjects (7 females; 26±3.5 years). MRI protocol: 3T MRI (Philips Achieva) with a 32-channel head coil. Sequence parameters: 1)volumetric 3DT1; 2)GE-EPI fMRI: volumes=200, TR=2.5s, TE=35ms, voxel size=3x3x2.7mm3, FOV=192x192mm2, slices=46, flip angle=90°, total scan-time 500s. Paradigm: Three event-related randomised fMRI runs (Figure 1): action execution (AE), observation (AO), observation with visual cue (AOvc). During AE and the video recording the subjects followed visual instructions to squeeze a rubber ball applying forces based on their own maximum voluntary contraction (MVC) (Figure 1(A)). Each squeeze lasted 3s, 5GF targets were interleaved with rest for a total of 75 active and 75 rest trials. Before and after MRI, subjects watched the videos (AO and AOvc) scoring the perceived GF. The AOvc video showed the right hand of a female actor performing the squeezeball task (as in AO) but overlaid with a translucent representation of the visual feedback the actor received during the video recording. Behavioural data (SPSS 21.0) The group mean of perceived GF (pGF) was calculated by considering the different forces (20,30,40,50,60 %MVC of the actor’s hand) and the 4 sessions (AO and AOvc before and after MRI). We used paired sample T-tests to test for differences between AO and AOvc ratings. Repeated measure ANOVA allowed us to investigate learning effects (p<0.001). fMRI data (SPM12) Pre-processing: Slice timing; realignments, re-slicing; co-registrations; normalizations and smoothing of EPI volumes (8mm Gaussian kernel). Polynomial expansions up to the 4th order in a general linear model were applied. The contrast images of polynomial coefficients were entered into a between subject analysis and tested with one sample t-tests. For AO and AOvc analysis the GF levels corresponded to those recorded from the actor’s performance. Significance: p<0.001 (minimum extent=10 voxels).Results
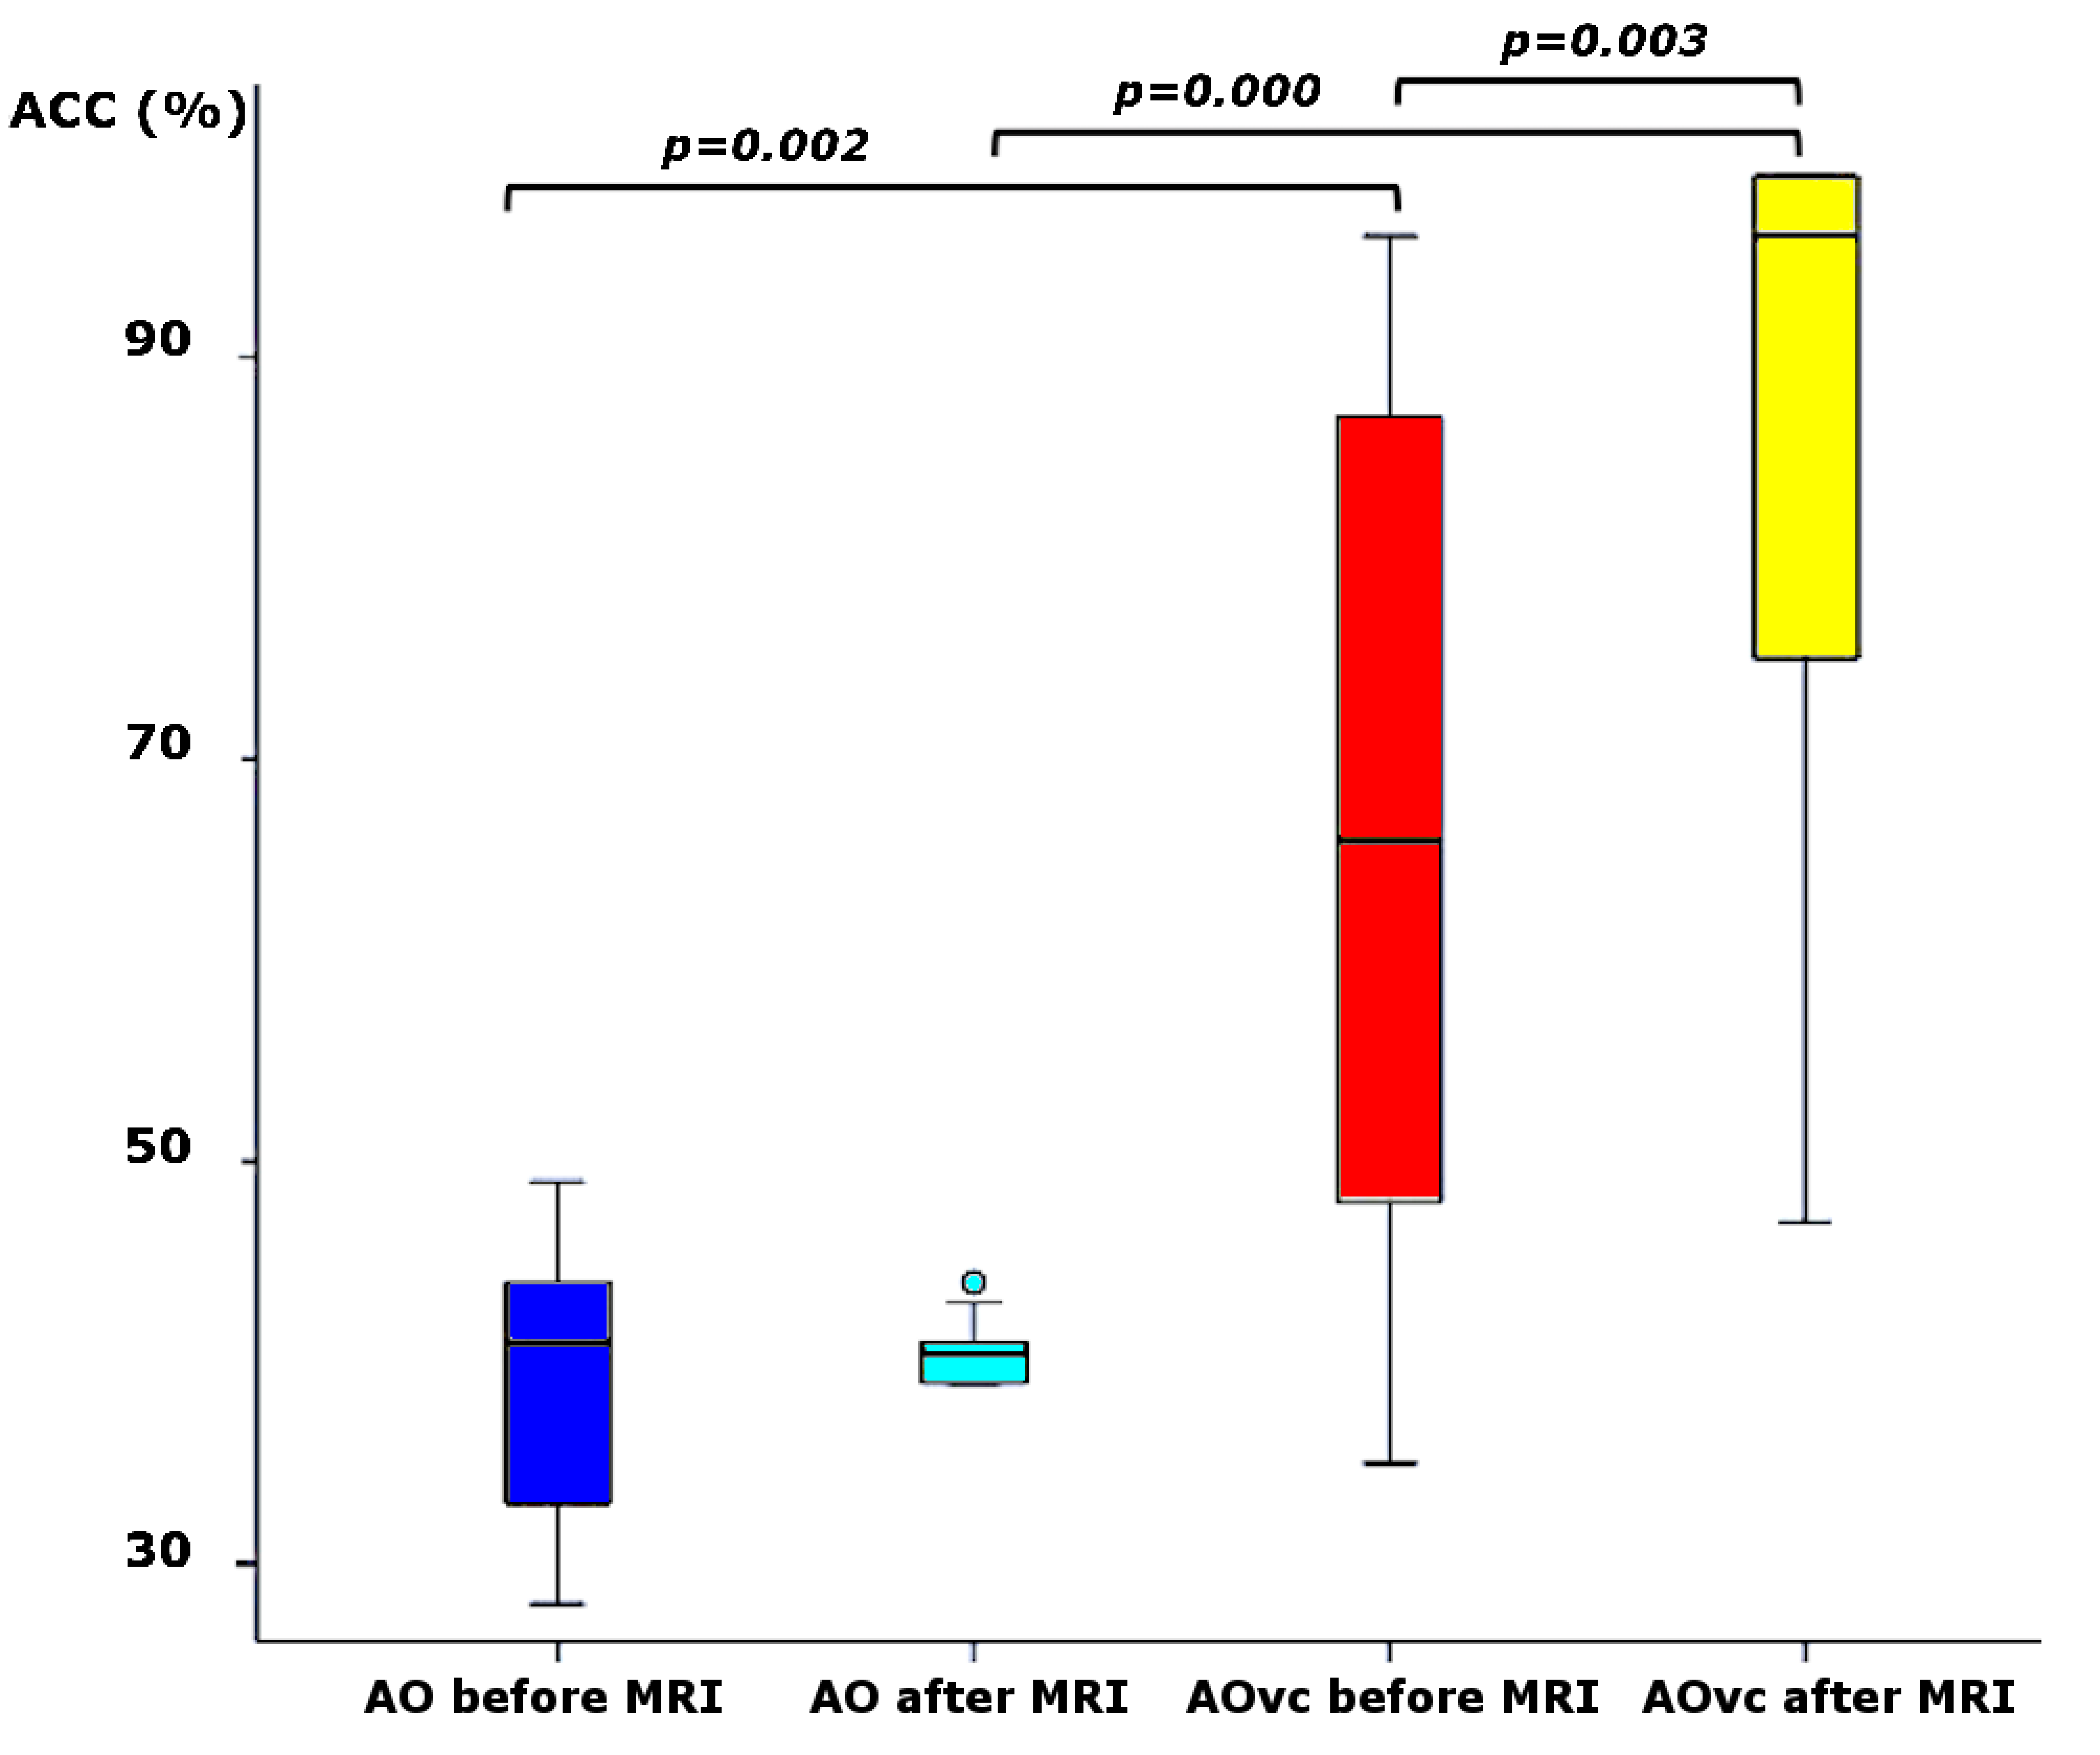
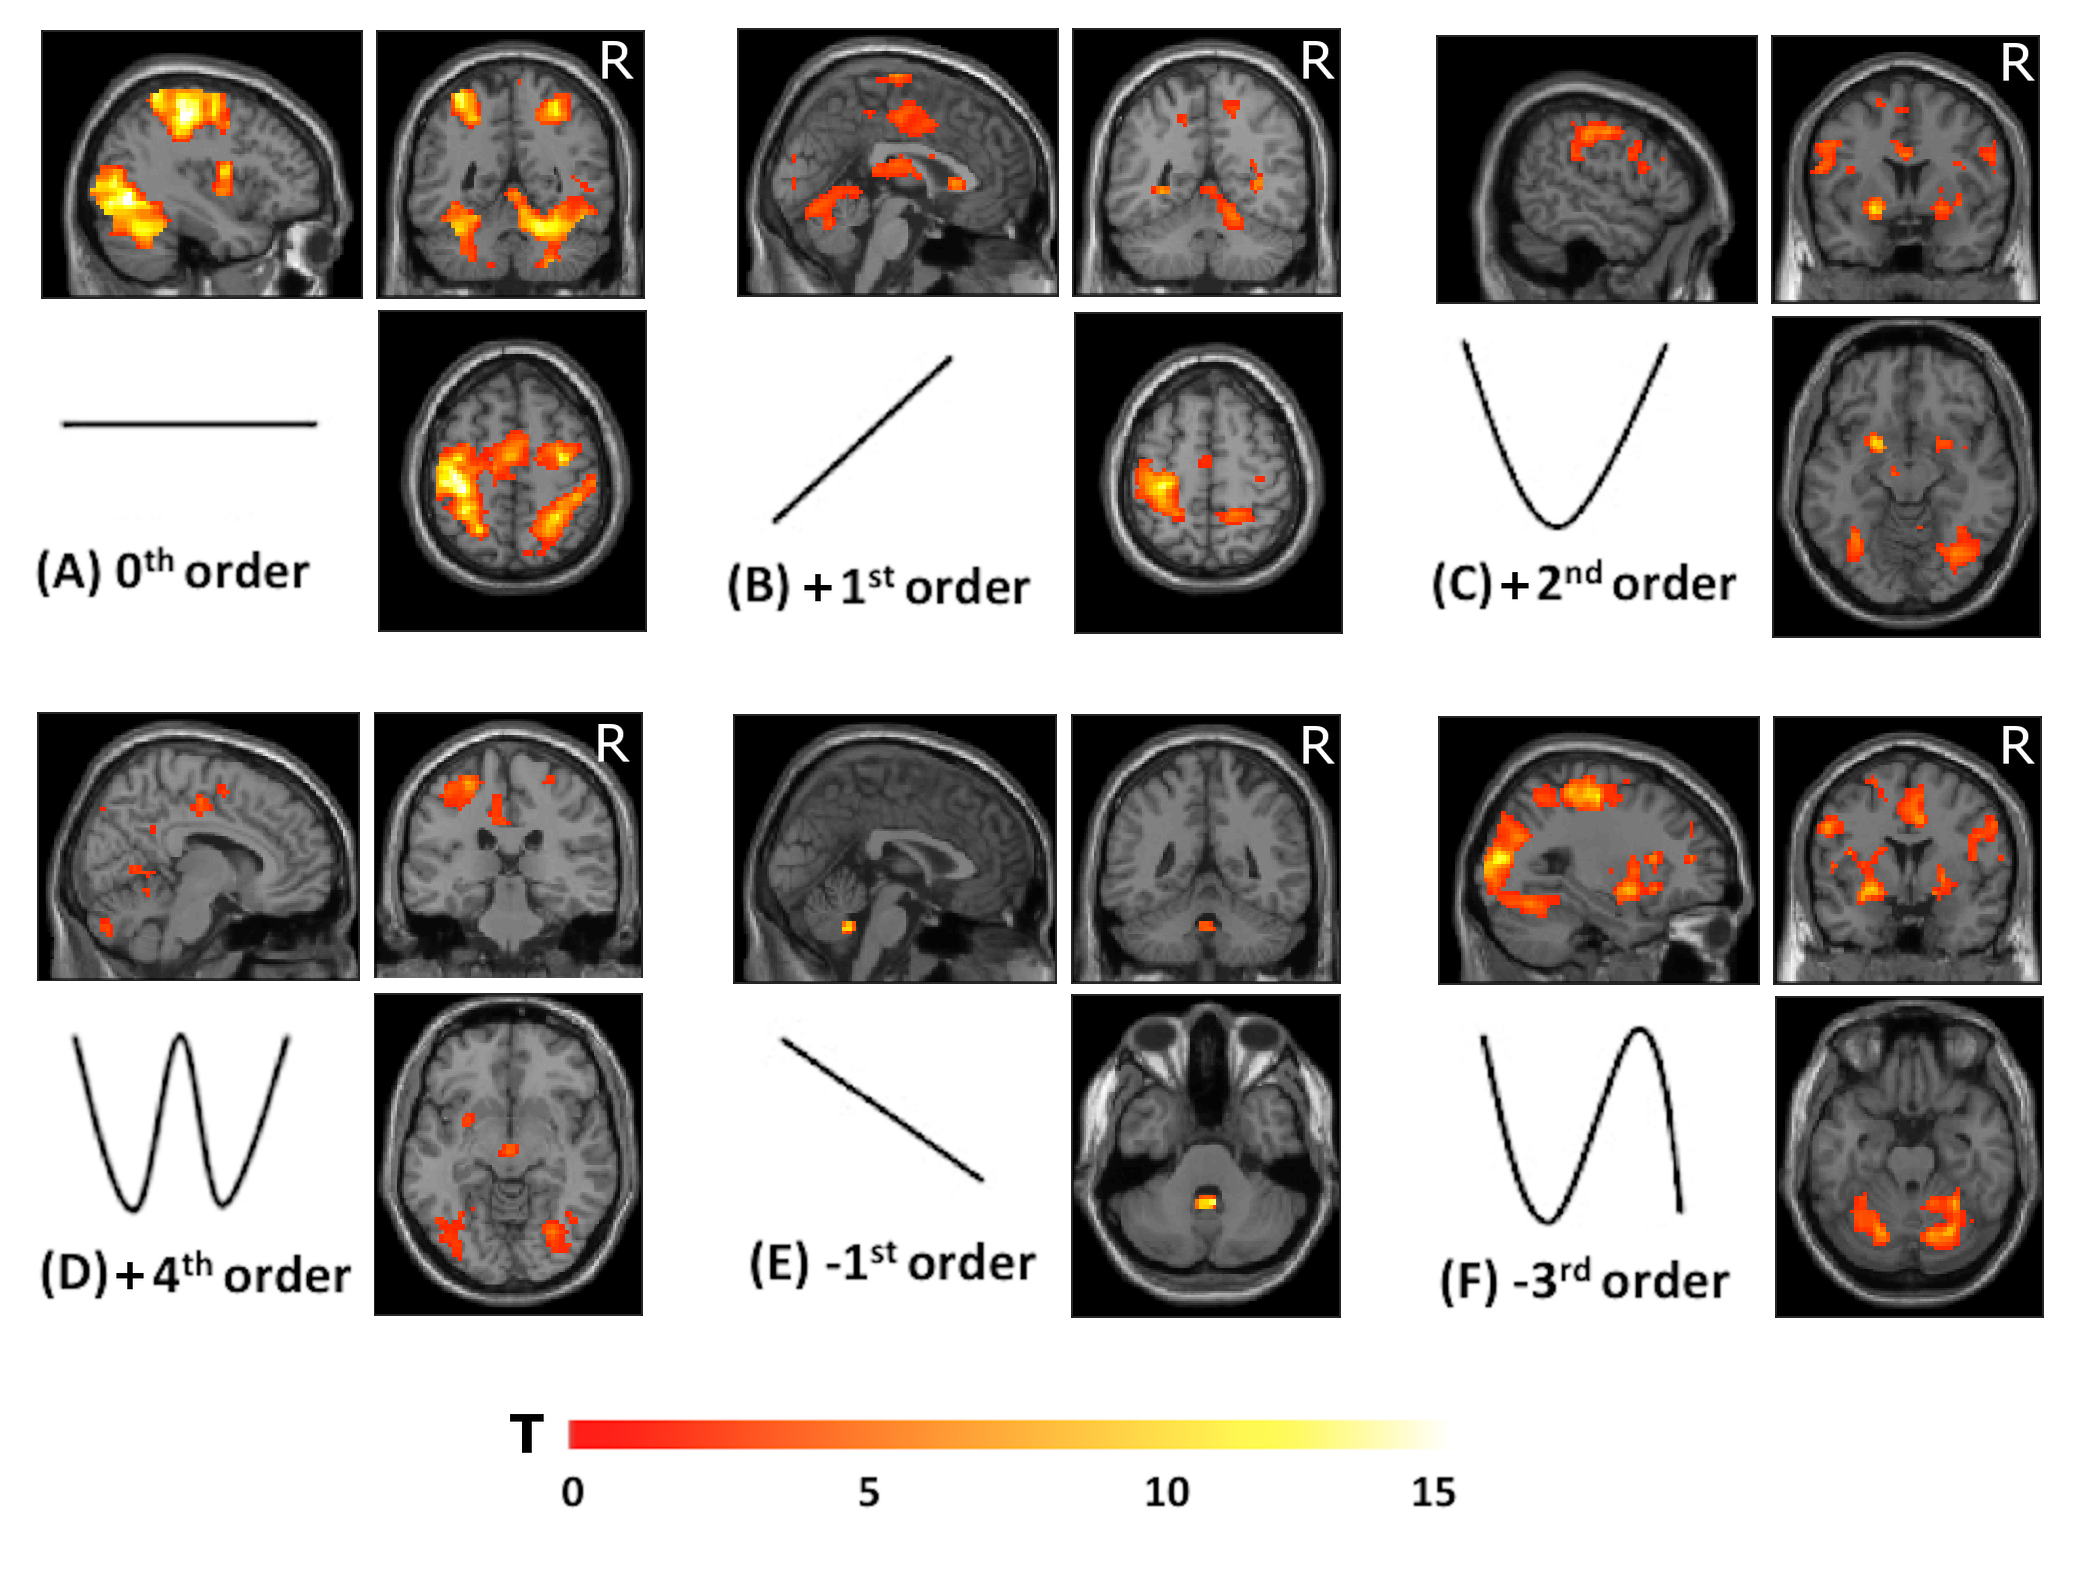
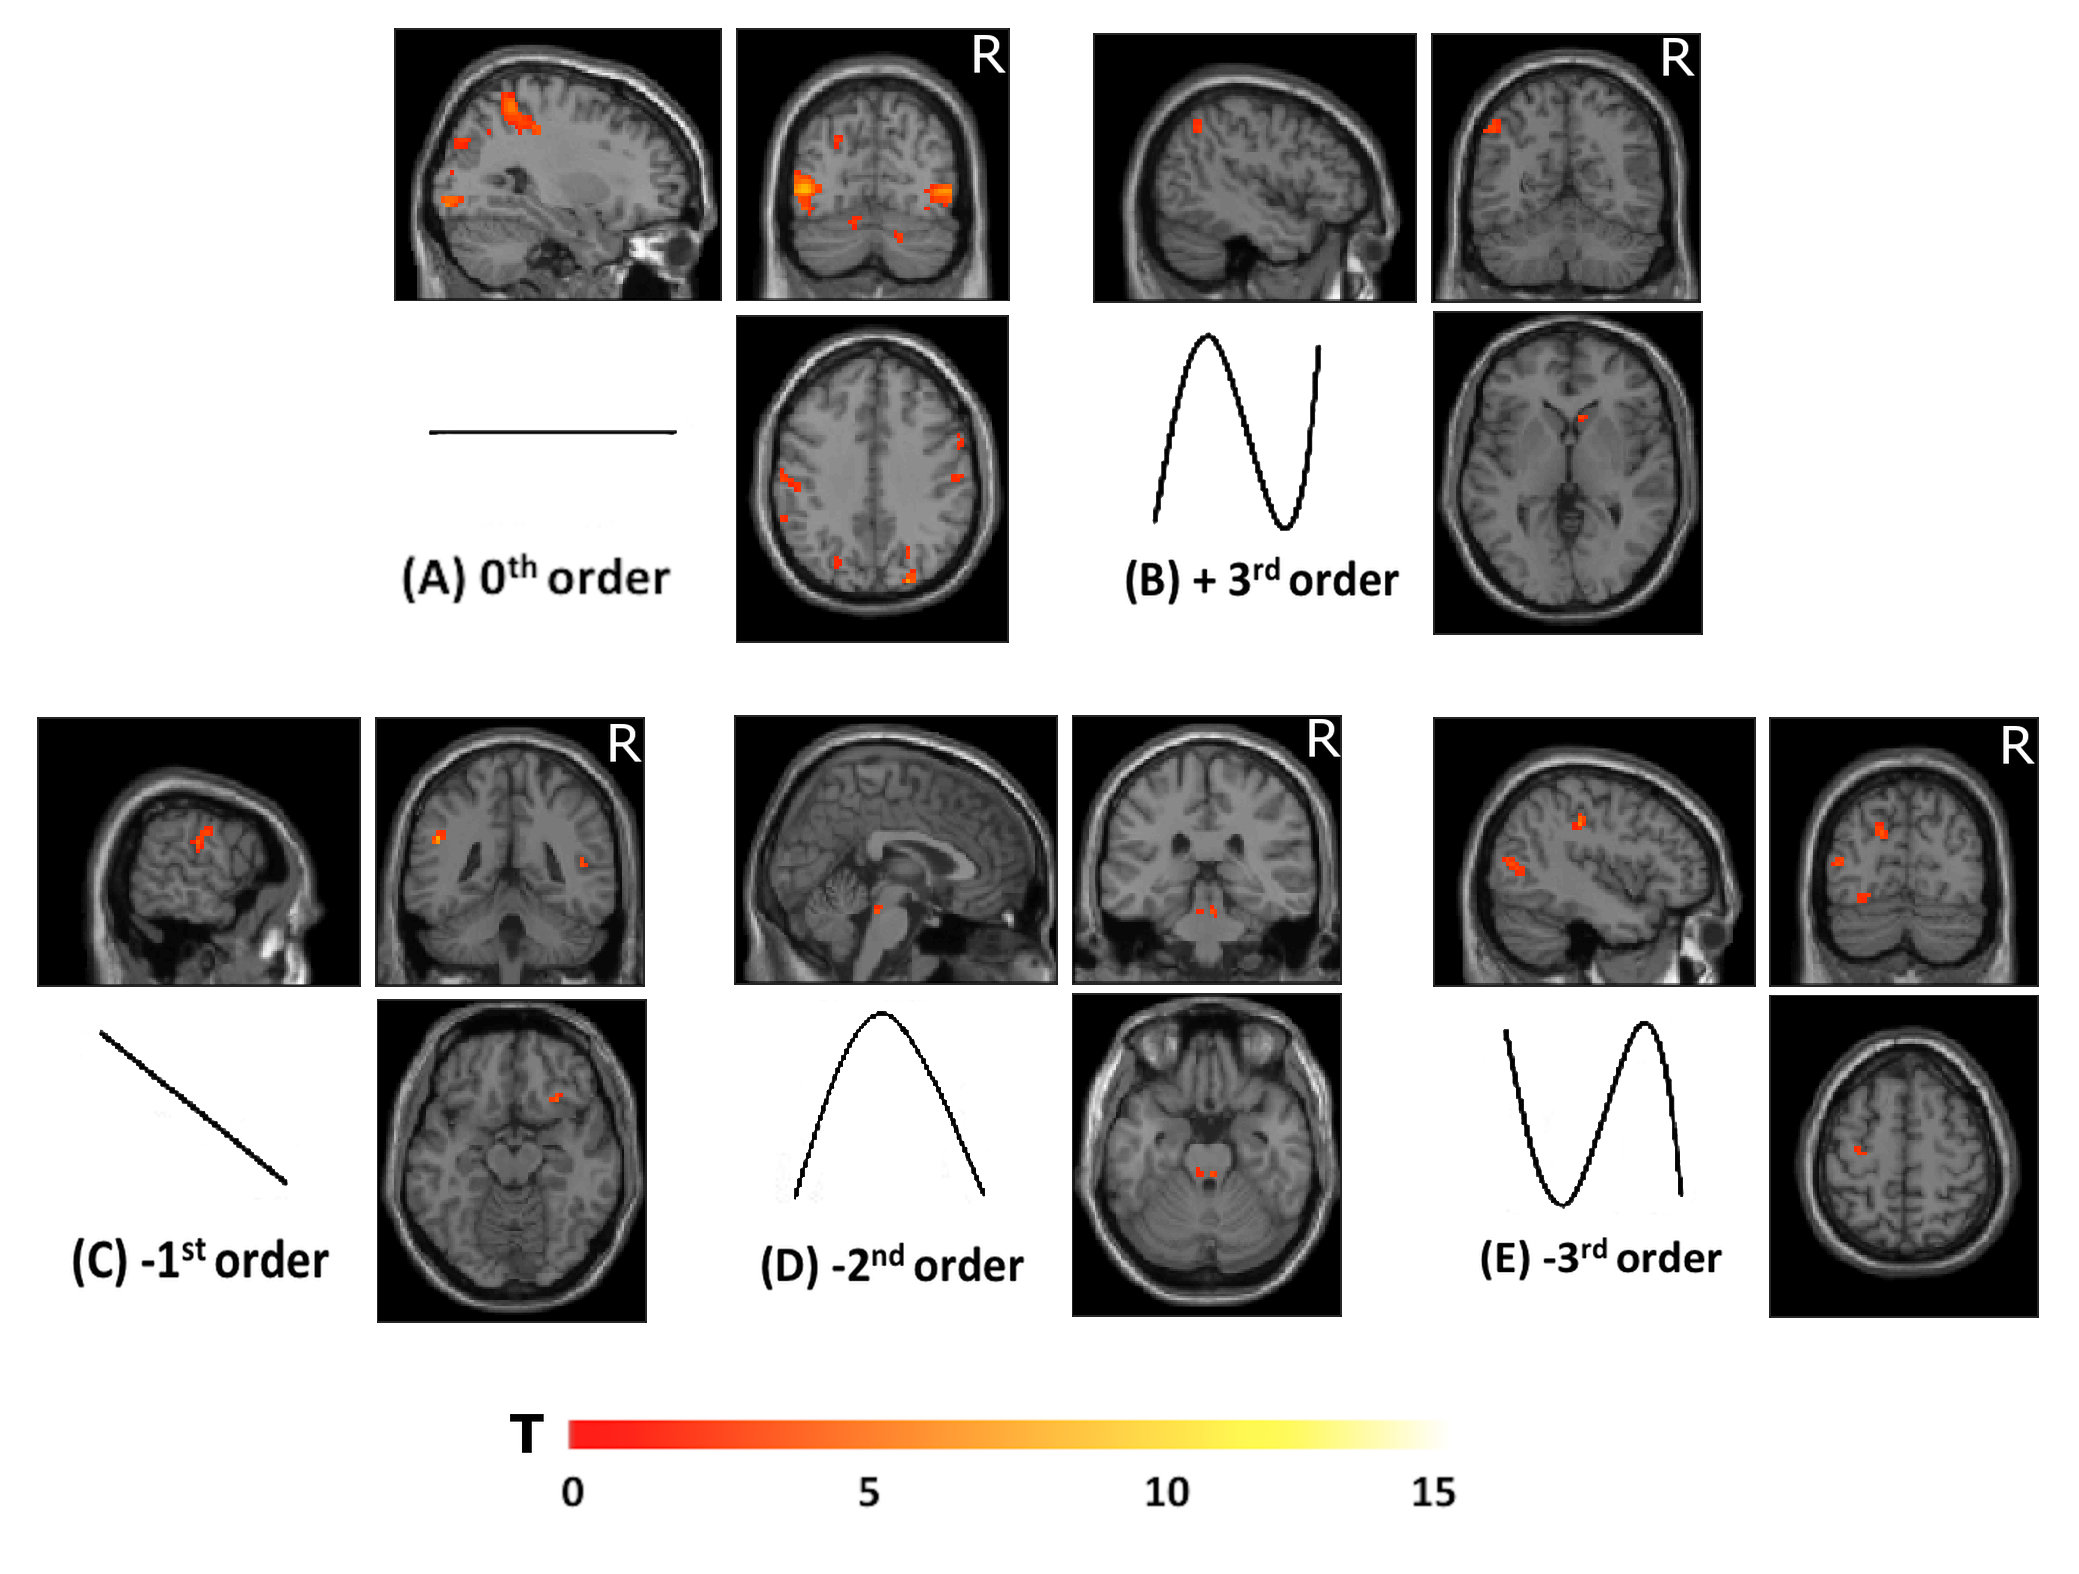
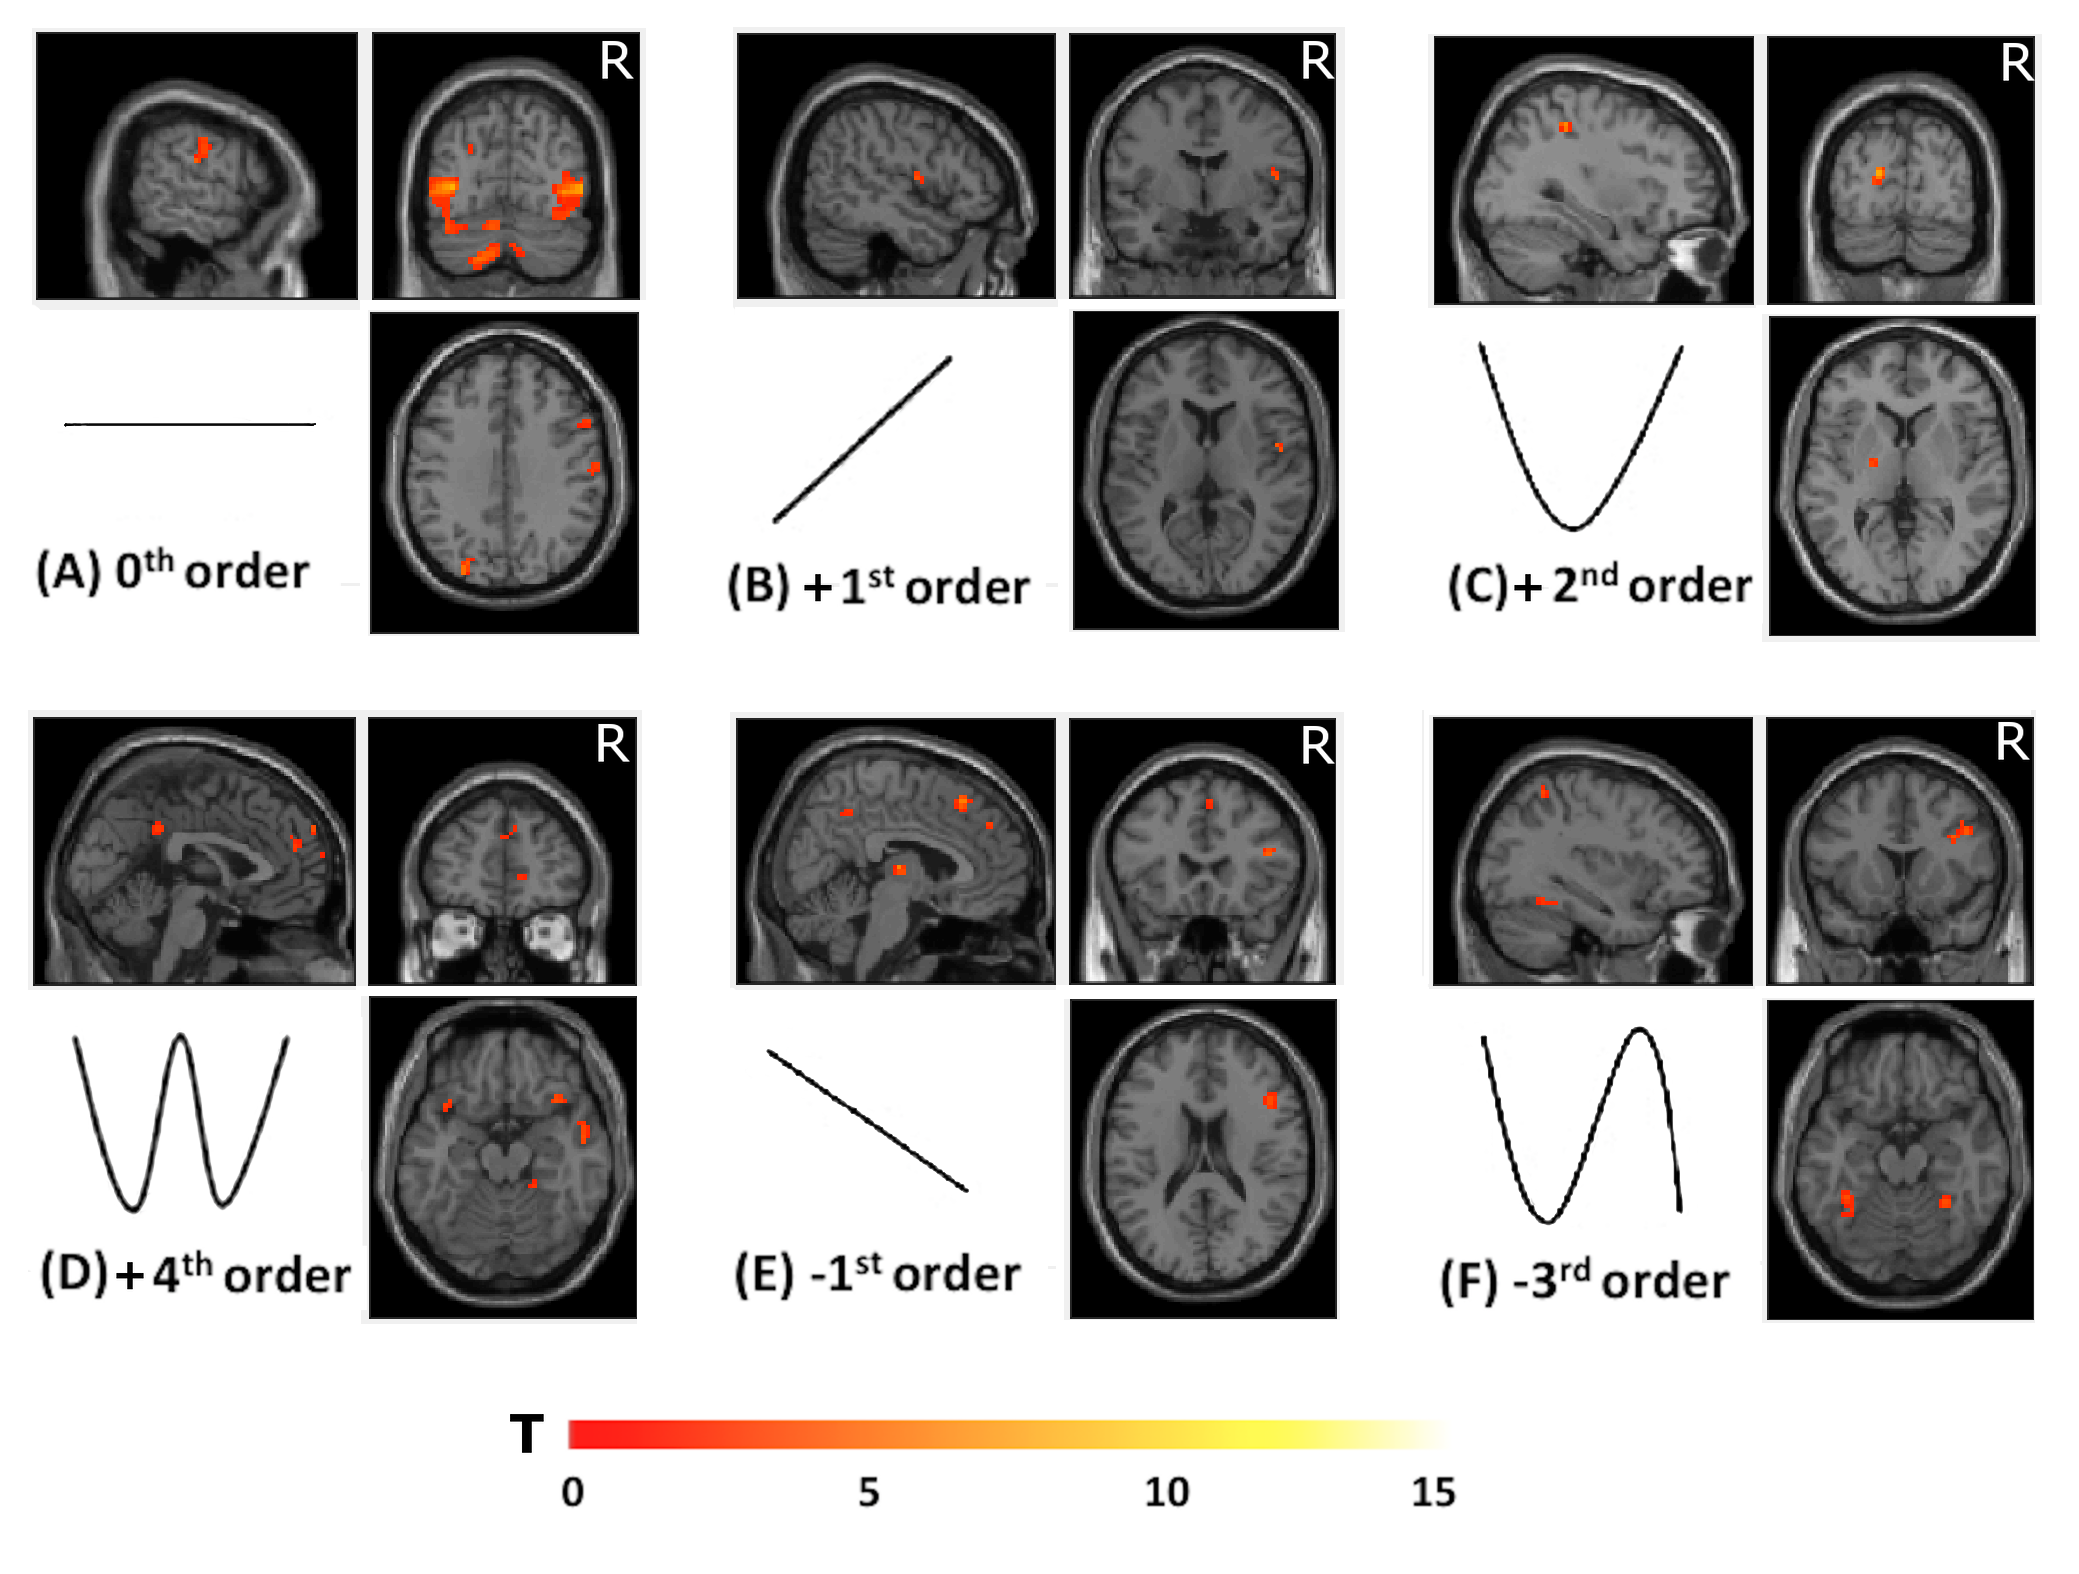
Group accuracy in pGF (Figure 2) resulted significantly higher in AOvc than AO and in AOvc“after” relative to AOvc“before” MRI. At the end of the experiment, subjects reported that the cue drove their responses in AOvc. In AE, activations (Figure 3) were detected in the following orders: 0th in motor, premotor and sensory cerebral and cerebellar areas; +1st in the motor cortex; +2nd in frontal, parietal and temporal lobes; +4th in sensorimotor and cerebellar areas; -1st in cerebellar lobule IX; -3rd in frontal, parietal and occipital lobes as well as cerebellum. In AO, activations (Figure 4) were seen in: 0th in visual cortices, premotor and parietal cortices; +3rd in parietal lobe and caudate; -1st in postcentral and supramarginal gyri, insula, middle temporal and inferior frontal gyri; -2nd in middle frontal gyrus and bilateral brainstem; -3rd in inferior parietal lobule, middle temporal gyrus, precentral, occipital and fusiform cortices. In AOvc, activations (Figure 5) were found in: 0th in occipital and temporal lobes, cerebellum, frontal and postcentral gyri; +1st in somatosensory cortex; +2nd in occipital lobe, sensorimotor cortex and thalamus; +4th in cingulate cortex, insula, frontal and temporal gyri, and cerebellum; -1st in thalamus, precuneus, frontal, temporal and angular gyri; -3rd in frontal, fusiform and occipital gyri and superior parietal lobule.Discussion and conclusion
AE confirmed previous data [5]. AO and AOvc activate different networks, with some overlaps with AE, indicating that the visual cue introduce a further layer of complexity. Prefrontal activations in AOvc suggest a possible underlying top-down processing of the cue. The behavioural data shows that there is a learning effect during AOvc, where the accuracy in force detection resulted higher than in AO. This indicates that the bar has a facilitator effect and that subjects gain a “hand-bar” correspondence insight as the experiments goes on. The presence of non-linear effects in AO, though, confirms that effort can be appreciated from the pure naturalistic experiment (potentially suggested by the tendon contraction) with processing confined to the parietal lobe, caudate [6], frontal gyrus and brainstem. Further experiments are needed to define the contribution of the cue to different orders and regions.Acknowledgements
This work was performed at the NMR Research Unit, Queen Square MS Centre (UCL, UK), which is funded by a programme grant from the UK Multiple Sclerosis Society (892/08) and receives generous support from the Department of Health’s National Institute for Health Research Biomedical Research Centres (BRC, Capital Project Number R&D03/10/RAG0449). CGWK receives support from ISRT, WfL, CHNF and H2020-EU.3.1 (634541). Data analysis was performed at the Center for Health and Technology of the University of Pavia through the support of the Human Brain Project (HBP-604102) to ED. LC was supported by project HBP - Regione Lombardia (Grant agreement 720270) and by Ministero della Salute (RC2015, 2016, 2017). KJF is funded by a Wellcome Trust Principal Research Fellowship (088130/Z/09/Z). Further support comes from the Functional Imaging Laboratory (FIL, Wellcome Trust Centre for Neuroimaging, UCL, UK), and NIHR BRC UCLH/UCL High Impact Initiative. We would also like to acknowledge Sasha Ondobaka, Francesco Rigoli and James Kilner for useful discussions at the work beginning.References
[1] Porro, C.A., et al., 2007. Enhancement of force after action observation: behavioural and neurophysiological studies. Neuropsychologia. 45, 3114-21.
[2] Caligiore, D., et al., 2013. The contribution of brain sub-cortical loops in the expression and acquisition of action understanding abilities. Neurosci Biobehav Rev. 37, 2504-15.
[3] Gatti, R., et al., 2016. The effect of action observation/execution on mirror neuron system recruitment: an fMRI study in healthy individuals. Brain Imaging Behav.
[4] Kilner, J.M., Friston, K.J., Frith, C.D., 2007. Predictive coding: an account of the mirror neuron system. Cogn Process. 8, 159-66.
[5] Alahmadi, A.A., et al., 2016. Complex motor task associated with non-linear BOLD responses in cerebro-cortical areas and cerebellum. Brain Struct Funct. 221, 2443-58.
[6] Kurniawan, I.T., et al., 2010. Choosing to make an effort: the role of striatum in signaling physical effort of a chosen action. Journal of Neurophysiology 104(1):313-21.
Figures