2314
Interactions between cardiac waves and resting-state BOLD signals exhibit high intra-subject consistency and high inter-subject variability1MGH/HST Martinos Center for Biomedical Imaging, Charleston, MA, United States, 2Athinoula A. Martinos Center for Biomedical Imaging, Boston, MA, United States, 3Radiology, Athinoula A. Martinos Center for Biomedical Imaging, Boston, MA, United States
Synopsis
Low-frequency respiratory and systemic cardiovascular fluctuations can affect vascular oxygenation and manifest in the envelope of cardiac waves. Here, we examined the interaction between the envelope of cardiac waves collected by a piezoelectric (PO) sensor (POE) and fMRI signals, and found that POE may provide unique information about BOLD fluctuations that are not explained by changes of heart rate, respiratory volumes or end-tidal CO2 levels. We also observed that the interaction between fMRI, cardiac, and respiratory measures was relatively stable within individuals, but highly variable across individuals.
Introduction
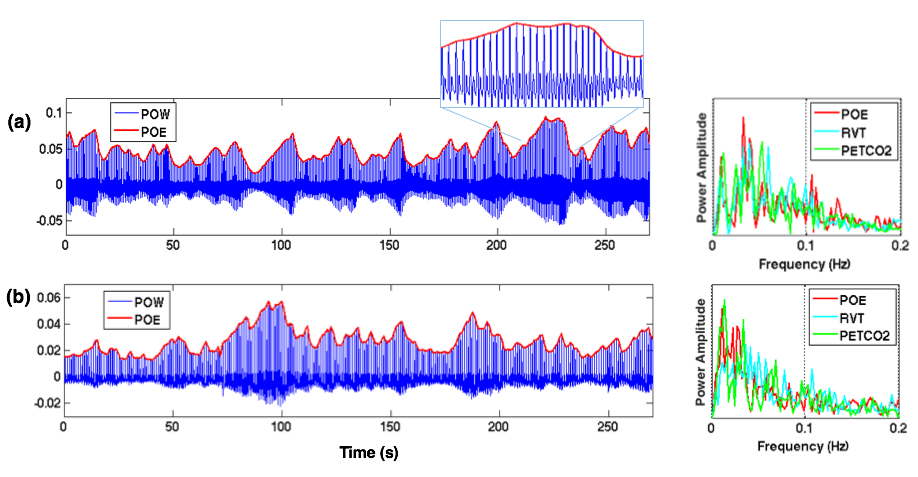
Cardiac activity has been routinely monitored in fMRI experiments using a pulse oximetry or piezoelectric sensor. In addition to revealing cardiac cycle timing, the envelope of cardiac waves (Fig. 1) may also carry information about respiratory and systemic cardiovascular fluctuations (heart rate changes and arterial blood pressure). Hence, one would expect cardiac waves to correlate with other cardiac/respiratory-related metrics of both neural[1] and artefactual origins[2-3], and account for variability in fMRI signals. Yet, few studies to date have looked into the information conveyed by the cardiac wave and its influence on BOLD fluctuations. Here, by examining a multi-subject multi-session resting state (RS) dataset, we show that (1) cardiac waves are tightly coupled with other physiological metrics, but can nevertheless account for additional variance in regions consistent within each subject; and that (2) the patterns of brain-heart-respiration interaction are relatively stable within individuals, but highly variable across subjects.
Methods
Five subjects volunteered for the study, each undergoing 4/6/6/6/7 sessions of 4min 32s long RS scans. FMRI images were collected at 7 T scanner (Siemens, 32 channel coil, single-shot gradient-echo blipped-CAIPI Simultaneous Multi-Slice EPI[4], TR/TE/FA/MB=1.7s/26ms/65°/3, FOV/3 CAIPI shift, 1.1mm iso). We also simultaneously recorded subject breathing with a respiratory belt, cardiac signals with a piezoelectric (PO) sensor placed on the index finger, and expired CO2 with a small, MR-compatible sidestream capnograph placed in the nostril. Physiological data were recorded with PowerLab A/D with (fs =1000 Hz), and synchronized with MR scanner through trigger. ‘Basic preprocessing’ steps included slice-timing correction, nuisance regression (scanner drifts, six motion parameters and periodic physiological noise identified by RETROICOR[5]), and spatial smoothing (FWHM = 4.4mm). 'Physiological covariates (P-CVs)': To yield the envelope of PO waves (POE), we localized cardiac peaks from PO waveforms, interpolated at imaging TRs, then regressed out the time series of motion parameters to diminish fluctuations induced by bulk motion. Heart rate variability (HRV) and respiration volume per unit time (RVT) were computed across 6s long windows centered at each TR[6]. End-tidal CO2 (PETCO2) curves were identified according to [3]. Interactions between POE and the other P-CVs (HRV/RVT/PETCO2) were quantified using cross-correlation. 'Influence of P-CVs on BOLD fluctuations': To assess the extent to which global BOLD fluctuations were synchronized with different P-CVs and their relative delays, cross-correlation values between P-CVs and the time series from 90 cortical regions of interest (ROIs[7], functional masks were renormalized to each subject’s native space) were averaged, yielding one cross-correlation curve for each scan. 'BOLD fluctuations uniquely synchronized with POE': The POE curve was first temporally shifted to account for its delay relative to cortical ROIs (based on the cross-correlation results in 'Influence of P-CVs on BOLD fluctuations'); then, P-CV-BOLD covariates (computed by convolving HRV, RVT, PETCO2 with hemodynamic response functions[2,6,8] and their temporal/dispersive derivatives) were projected out of POE and each brain voxel’s time series; finally, the shifted POE curve, together with its temporal derivative, were regressed against each brain voxel for significance testing.
Results & Discussion
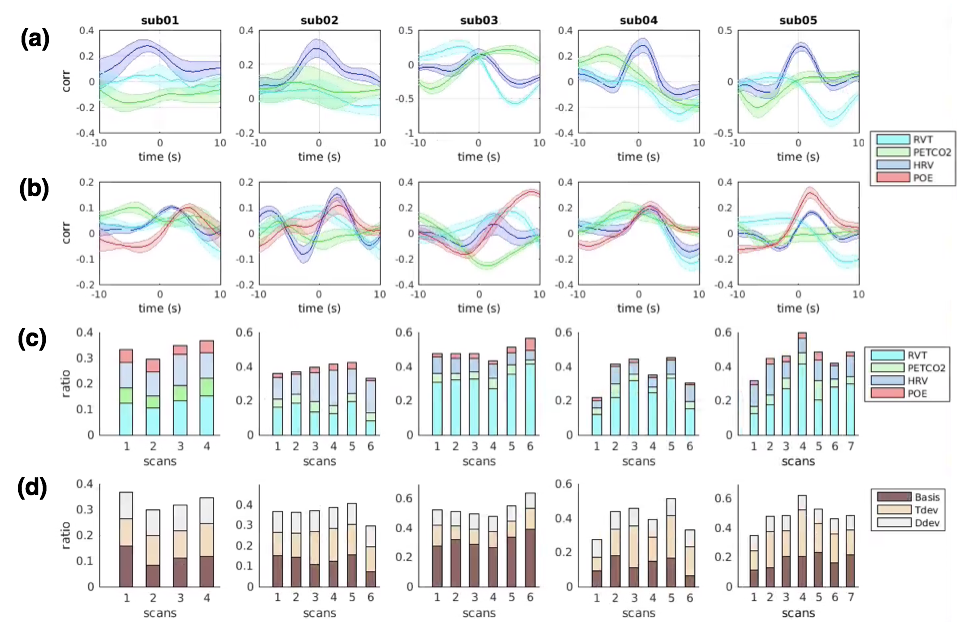
'Low intra-subject, and high inter-subject variability of brain-heart-respiration interaction': As expected, POEs were significantly correlated with other physiological measures (Fig. 2(a)). POE lagged BOLD signals by 1~2 TRs (except for 8.5s in subject 03) and were positively correlated with BOLD fluctuations (Fig. 2(b)). Brain-heart-respiration interactions exhibited less intra- than inter-subject variability (Fig. 2(a-c)). These diverse patterns imply the need to account for inter-subject variability in modeling the P-CVs effects on BOLD signals. As shown in Fig. 2(d), including temporal (‘Tdev’) and dispersive derivatives (‘Ddev’) explained up to 20% additional variance of BOLD signals compared to fixed response functions (‘basis’) alone.
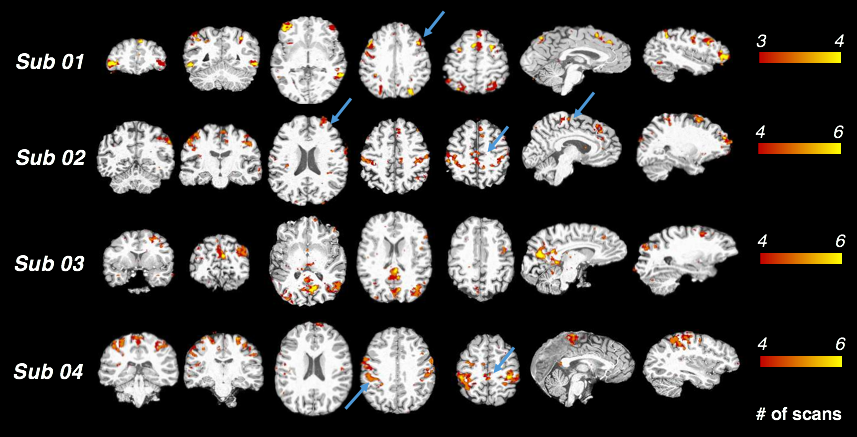
'POEs can account for unique variance in BOLD fluctuations': Regional fluctuations uniquely synchronized with POE (and not with the other physiological variables) were consistent across scans within subjects (Fig. 3). While these correlations were striking within some individual subjects, no prominent clusters survived the group-level t-test (p<0.05, FDR corrected) due to inter-subject variability. Mechanisms underlying such POE correlation and their variability across subjects may reflect either neural or physiological contributions. As regions with strong POE effects overlapped with cortical areas involved in sympathetic regulation, e.g., supramarginal gyrus, dorsal lateral prefrontal cortex and supplementary motor area[9], future studies will employ recordings of sympathetic physiology (e.g., skin conductance) and vigilance biomarkers (e.g., eye trackers) to examine the degree to which POE signals sympathetic nervous system activity, and whether varying degrees of vigilance levels lead to inter-subject variability indirectly through sympathetic system fluctuations.
Conclusions
The patterns of interactions among different physiological metrics, and their relationship with BOLD fluctuations, exhibited low intra-subject and high inter-subject variability. The envelope of cardiac wave may provide unique information of BOLD fluctuations that are not explained by HRV, RVT or PETCO2.Acknowledgements
We acknowledge Dr. Catie Chang for helpful discussions on the interpretation of study findings. This work was supported in part by the NIH NIBIB (grants P41-EB015896 and R01-EB019437), by the BRAIN Initiative (NIH NIMH grants R01-MH111419 and R01-MH111438), and by the MGH/HST Athinoula A. Martinos Center for Biomedical Imaging; and was made possible by the resources provided by NIH Shared Instrumentation Grants S10-RR023401, S10-RR023043, and S10-RR019371.References
[1] Evans KC, Dougherty DD, Schmid AM, Scannell E, McCallister A, Benson H, Dusek JA, Lazar SW. Modulation of spontaneous breathing via limbic/paralimbic-bulbar circuitry: an event-related fMRI study. Neuroimage. 2009; 47:961–971.
[2] Birn RM, Diamond JB, Smith MA, Bandettini PA. Separating respiratory-variation-related fluctuations from neuronal-activity-related fluctuations in fMRI. Neuroimage. 2006; 31:1536–1548.
[3] Wise RG, Ide K, Poulin MJ, Tracey I. Resting fluctuations in arterial carbon dioxide induce significant low frequency variations in BOLD signal. Neuroimage. 2004; 21:1652–1664.
[4] Setsompop K, Gagoski BA, Polimeni JR, Witzel T, Wedeen VJ, Wald LL. Blipped‐controlled aliasing in parallel imaging for simultaneous multislice echo planar imaging with reduced g‐factor penalty. Magnetic Resonance in Medicine. 2012 May 1;67(5):1210-24.
[5] Glover GH, Li TQ, Ress D. Image‐based method for retrospective correction of physiological motion effects in fMRI: RETROICOR. Magnetic resonance in medicine. 2000 Jul 1;44(1):162-7.
[6] Chang C, Cunningham JP, Glover GH. Influence of heart rate on the BOLD signal: the cardiac response function. Neuroimage. 2009 Feb 1;44(3):857-69.
[7] Shirer WR, Ryali S, Rykhlevskaia E, Menon V, Greicius MD. Decoding subject-driven cognitive states with whole-brain connectivity patterns. Cerebral cortex. 2012 Jan 1;22(1):158-65.
[8] Golestani AM, Chang C, Kwinta JB, Khatamian YB, Chen JJ. Mapping the end-tidal CO 2 response function in the resting-state BOLD fMRI signal: spatial specificity, test–retest reliability and effect of fMRI sampling rate. Neuroimage. 2015 Jan 1;104:266-77.
[9] Beissner F, Meissner K, Bär KJ, Napadow V. The autonomic brain: an activation likelihood estimation meta-analysis for central processing of autonomic function. Journal of Neuroscience. 2013 Jun 19;33(25):10503-11.
Figures