2313
Evidence of faster hemodynamic response function at weak sensory stimulus levels supports higher frequency intrinsic functional connectivity1MGH/HST Martinos Center for Biomedical Imaging, Charleston, MA, United States, 2Stanford University, Stanford, CA, United States
Synopsis
There has been emerging evidence that resting state spontaneous neural fluctuations can persist at frequencies not supported by the canonical hemodynamic response function (HRF). As RS may likely comprise varying levels of spontaneous stimuli, it is thus of interest to query whether BOLD fluctuations elicited by small-intensity stimuli occur at faster time scales than the canonical HRF and can account for certain high-frequency (HF) phenomena observed at rest. Here, we employ a vibrotactile stimulus with graded contrasts, and show that HRFs elicited by small intensity stimuli have faster time-to-peak and narrower dispersions than canonical HRFs, thus may promise elevated BOLD responses in higher frequency bands and explain part of the HF phenomena observed in recent RS studies.
Introduction
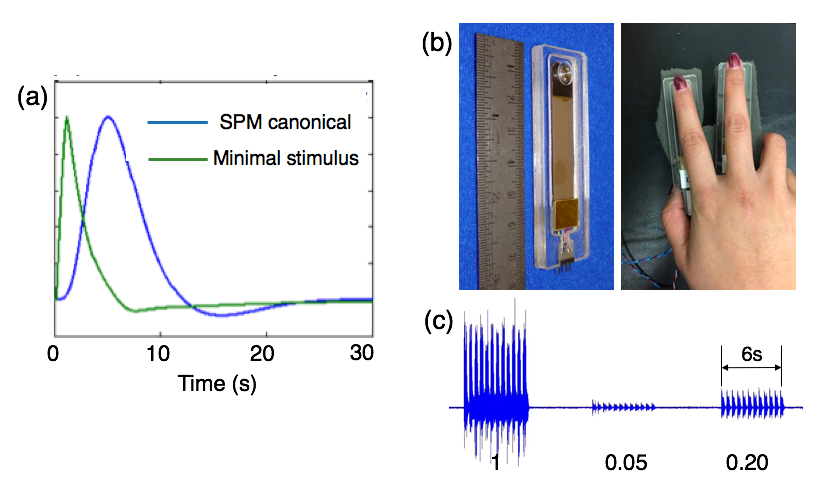
There has been emerging evidence that resting state (RS) spontaneous neural fluctuations can persist at frequencies not supported by the canonical hemodynamic response function (HRF)[1-3]. As RS may likely comprise varying levels of spontaneous stimuli, it is thus of interest to query whether BOLD fluctuations elicited by small-intensity stimuli occur at faster time scales than the canonical HRF and can account for certain high-frequency (HF) phenomena observed at rest. Previously, we have simulated a minimal-stimulus HRF by evaluating the task-based HRF (Buxton’s balloon model)[4,5] in the equilibrium state, resulting in a response function with shorter time-to-peak and narrower dispersion (Fig. 1(a))[2]. Here, we explore whether such qualitative changes of HRFs can be observed in real experiments, via employing a vibrotactile stimulus with graded contrasts.Methods
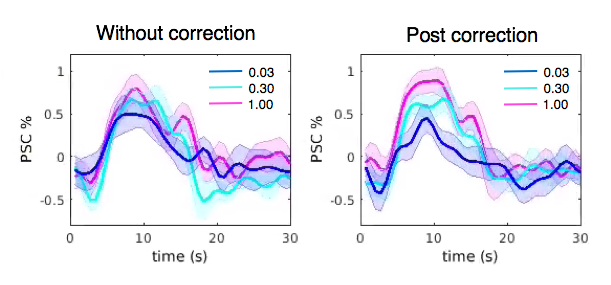
FMRI images were collected at 3T (GE Signa 750, 8 channel coil, spiral in/out sequence, TR/TE = 700/30ms, 10 slices, flip angles = 53o, voxel size 3.44*3.44*4 mm3). Eight subjects (all right handed) participated in the current study, each undergoing four scans of block-design vibrotactile stimulation with contrasts graded at three different levels. Each scan consisted of 17 task blocks (# of blocks = 7/5/5 for low/medium/high contrasts respectively), with 6s stimulus on and 25s off per block. Throughout the scan, the subject’s right hand rested upon a sponge, and two vibrotactile stimulators were taped to the index and middle fingers (Fig. 1 (b)). When the task was on, one of the stimulators was randomly activated every 0.25s and oscillated at 100 Hz. Subjects were instructed to look at a fixed cross on the screen and ignore the vibrotactile stimulation to avoid potential contaminations from spontaneous neural fluctuations (inspired by a pilot study result shown in Fig. 2)).
Preprocessing included slice timing correction, nuisance regression (scan drifts, six motion parameters and physiological fluctuations[6,7])), spatial smoothing (fwhm = 4mm), and normalization to percent signal change (PSC).
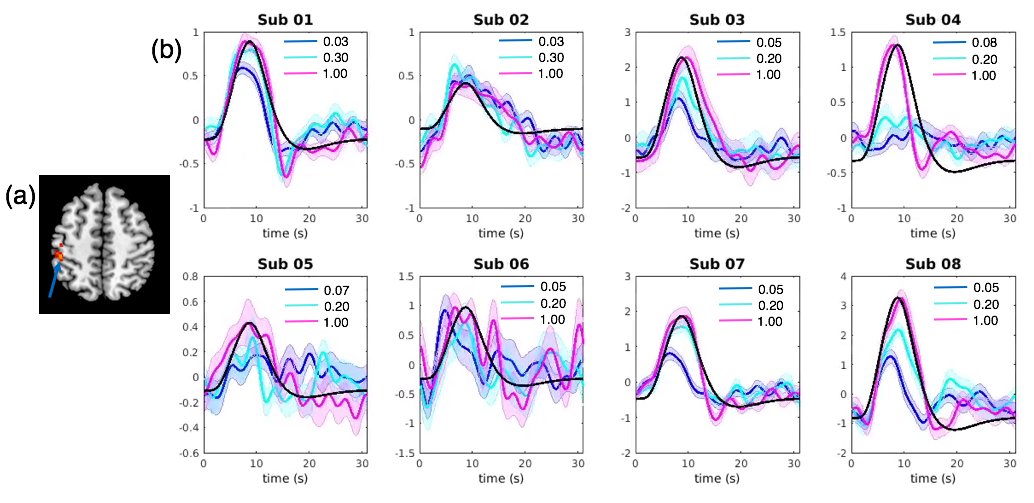
To localize the most task-relevant voxel for each individual while ensuring consistency of region choice among subjects, the following scheme was adopted. First, an activation map was generated for each scan using a general linear model (GLM) that comprised 9 task related covariates – 3 HRF bases (the canonical HRF and its temporal/dispersive derivative) X 3 contrast levels. Second, the fitting coefficient map of the canonical HRF (averaged across contrast levels) was normalized to the MNI space and entered into a mixed-effect group-level analysis, yielding a group-level t-score activation result. Third, a sphere of 10 mm radius was drawn around the local maxima in the left postcentral gyrus (MNI coordinate, [-46 -33 52], t = 4.73, p < 0.05, FDR corrected, Fig. 3(a)), and renormalized to each subject’s native space. Finally, for each subject, the voxel (within the renormalized mask) having the maximum t-scores (averaged across scans) was chosen.
After extracting the task-related voxel for each individual, the associated time course was low-pass filtered below 0.3 Hz and linearly interpolated to 0.2 s resolution. Time series from 4 scans were combined, and the averaged BOLD response of a single block was calculated for different contrast levels respectively.
Results
Fig. 3 (b) shows the block-wise BOLD fluctuations at different contrast levels for all eight subjects. Both the shapes and delays of triggered hemodynamic responses were highly variable among the subjects. However, in those subjects whose peak PSCs follow the imposed contrast levels (sub01,03,07,08), faster time-to-peak and narrower dispersions were consistently observed in the hemodynamics triggered by the lower contrast stimulus compared to higher contrasts and the canonical responses), mirroring the qualitative changes predicted by simulations.Conclusions
In the present study, we show that HRFs elicited by small intensity stimuli have faster time-to-peak and narrower dispersions than canonical HRFs, thus may promise elevated BOLD responses in higher frequency bands and explain part of the HF phenomena observed in recent RS studies.Acknowledgements
This work is supported by NIH grant P41EB15891.References
[1] Gohel, S. R., & Biswal, B. B. (2015). Functional integration between brain regions at rest occurs in multiple-frequency bands. Brain connectivity, 5(1), 23-34.
[2] Chen, J. E., & Glover, G. H. (2015). BOLD fractional contribution to resting-state functional connectivity above 0.1 Hz. NeuroImage, 107, 207-218.
[3] Lee, H. L., Zahneisen, B., Hugger, T., LeVan, P., & Hennig, J. (2013). Tracking dynamic resting-state networks at higher frequencies using MR-encephalography. Neuroimage, 65, 216-222.
[4] Buxton, R. B., Wong, E. C., & Frank, L. R. (1998). Dynamics of blood flow and oxygenation changes during brain activation: the balloon model. Magnetic resonance in medicine, 39(6), 855-864.
[5] Mildner, T., Norris, D. G., Schwarzbauer, C., & Wiggins, C. J. (2001). A qualitative test of the balloon model for BOLD‐based MR signal changes at 3T. Magnetic resonance in medicine, 46(5), 891-899.
[6] Glover GH, Li TQ, Ress D. Image‐based method for retrospective correction of physiological motion effects in fMRI: RETROICOR. Magnetic resonance in medicine. 2000 Jul 1;44(1):162-7.
[7] Chang C, Cunningham JP, Glover GH. Influence of heart rate on the BOLD signal: the cardiac response function. Neuroimage. 2009 Feb 1;44(3):857-69.
Figures