2310
Vascular effect on cerebral blood flow in BOLD fMRI under fed-caffeinated effect1Weldon School of Biomedical Engineering, Purdue University, West Lafayette, IN, United States, 2McLean Imaging Center, McLean Hospital, Belmont, MA, United States, 3Department of Psychiatry, Harvard Medical School, Boston, MA, United States
Synopsis
In this study, we explored the vascular effect of a fed-caffeinated condition versus a fasted-uncaffeinated condition in resting-state fMRI dataset from the Myconnectome project. We extracted the low frequency oscillation signal from the superior sagittal sinus (SSS) as a vascular seed to evaluate the propagation of these signals through the brain in these two conditions.
Introduction
Nutrient and food intake, such as drinking coffee and having meal, can modulate human's metabolic rate, blood flow and brain network activity. For example, Griffeth et. al indicate that reduction of resting state cerebral blood flow due to caffeine was related to increase in blood oxygenation level dependent (BOLD) signal. 1 Also, C.W. Wong et al showed significant reduction of resting-state BOLD functional connectivity and amplitude of global signal after caffeine was absorbed. 2 Previous studies have illustrated that cerebral blood flow throughout the brain can be traced by calculating time lags between global signal and BOLD signals from all the voxels within the resting state brain. 3 In this work, we employed this method to understand vascular effects under fasted-uncaffeinated and fed-caffeinated conditions by comparing the correlation parameters between a vascular seed signal (SSS), the global mean signal, and signals from all the voxels within the resting brain.Methods
The Myconnectome project (http://myconnectome.org/wp/) provided a publicly available single subject dataset, which included 90 resting-state MRI scans collected across two years. Most of fMRI scans used a multi-band echo planar imaging sequence mentioned in Poldrack et al. 4 Resting-state fMRI scans were preprocessed using FSL (FMRIB Expert Analysis Tool, v5.98, http://www.fmrib.ox.ac.uk/fsl, Oxford University, UK), which included: 1) motion correction; 2) brain extraction; 3) registration to the T1-weighted image; 4) band-pass filtering (0.01-0.08Hz). 5 The fMRI signal from the SSS was employed as vascular signal. A SSS mask was identified by using T1 and T2-weighted anatomic images. 6 We then extracted fMRI signal using this SSS mask. Cross correlation analysis was performed between SSS signal and global signal to calculate the maximum cross correlation coefficients (MCCCs) and the corresponding time delays. Moreover, we applied an analytical method called "Rapidtide" (https://github.com/bbfrederick/rapidtide) to access the MCCCs and delay times between the BOLD signals of each voxel and the vascular seed. 7 Last, we assessed BOLD signal amplitude (the standard deviation) in fed-caffeinated condition and fasted-uncaffeinated conditions.Results
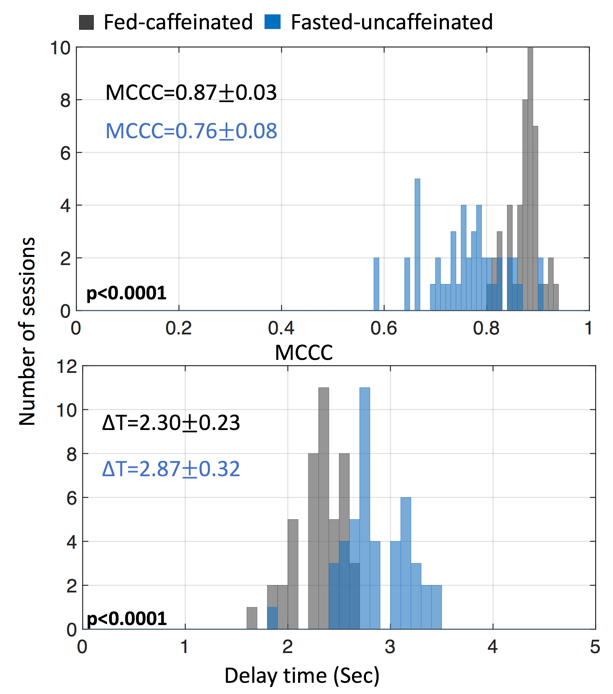
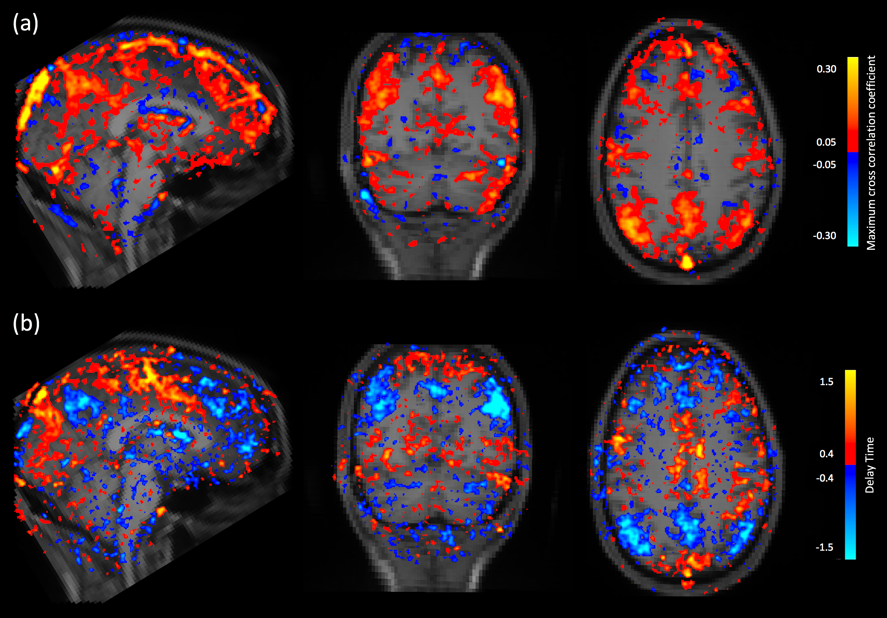
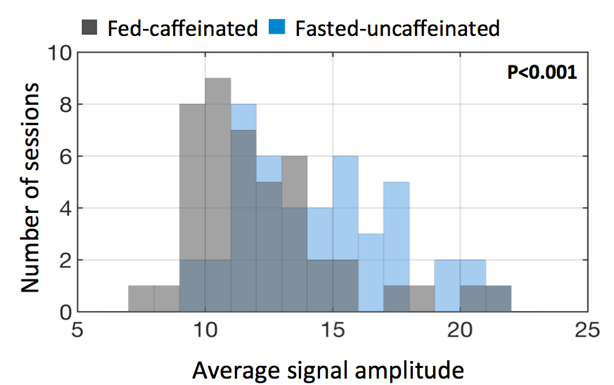
From the cross correlation result of SSS and global signal, the MCCCs are significantly smaller in fasted-uncaffeinated condition (0.760.08) than fed-caffeinated condition (0.870.03)(p<0.0001). The lag time is significantly shortened in fed-caffeinated condition (2.300.23) than in fasted-uncaffeinated condition (2.870.32)(p<0.0001) (Fig 1). This indicates the conditions do have vascular effect (e.g. blood flow) on the brain. Figure 2a shows the subtraction of average MCCCs of fed-caffeinated condition and fasted-uncaffeinated one. It shows the brain regions where the cross correlation with the vascular seed “strengthened” (in red) versus the brain regions where the cross correlation with the vascular seed “weakened” (in blue) (mean difference: t= -2.1201, p<0.05; standard deviation difference: t=-2.1587, p <0.05). Figure 2b shows the subtraction of average delays of fed-caffeinated condition minus fasted-uncaffeinated one. It identified the brain regions where blood flow “speeds up” (shorter delays between the region and SSS) and the regions where blood flow “slows down” (longer delays between the region and SSS) under the fed-caffeinated condition. Interestingly, we found the default mode network had higher correlation with SSS signal under fed-caffeinated (Fig. 2(a)), while its blood flow to SSS slowed down (Fig. 2(b)). Lastly, Figure 3 shows that average signal amplitude in fed-caffeinated condition were significantly smaller than fasted-uncaffeinated condition (t= -3.6297, p<0.001), which could also be due to vascular effects. Similar results were found by other groups. 2, 8Conclusion
In this project, we studied vascular effects from fasted-uncaffeinated and fed-caffeinated conditions on the brain by using SSS signal as vascular seed in resting state fMRI data. We found voxel wise cross correlations with the vascular seed were different under different conditions. These results will deepen our understanding of the effects of the food and caffeine intake to the brain.Acknowledgements
This work was supported by the National Institutes of Health, Grants K25 DA031769(YT).References
1. Griffeth, V.E. and R.B. Buxton, A theoretical framework for estimating cerebral oxygen metabolism changes using the calibrated-BOLD method: modeling the effects of blood volume distribution, hematocrit, oxygen extraction fraction, and tissue signal properties on the BOLD signal. Neuroimage, 2011. 58(1): p. 198-212.
2. Wong, C.W., et al., Anti-correlated networks, global signal regression, and the effects of caffeine in resting-state functional MRI. Neuroimage, 2012. 63(1): p. 356-364.
3. Tong, Y. and B.D. Frederick, Tracking cerebral blood flow in BOLD fMRI using recursively generated regressors. Hum Brain Mapp, 2014.
4. Poldrack, R.A., et al., Long-term neural and physiological phenotyping of a single human. Nature communications, 2015. 6: p. 8885.
5. Jenkinson, M., et al., Fsl. Neuroimage, 2012. 62(2): p. 782-90.
6. Glasser, M.F. and D.C. Van Essen, Mapping human cortical areas in vivo based on myelin content as revealed by T1-and T2-weighted MRI. Journal of Neuroscience, 2011. 31(32): p. 11597-11616.
7. Frederick, B., Rapidtide. 2016.
8. He, H. and T.T. Liu, A geometric view of global signal confounds in resting-state functional MRI. Neuroimage, 2012. 59(3): p. 2339-2348.
Figures