2308
Robust arterial functional MRI (fMRI) data and its application1Agricultural and Biological Engineering, Purdue University, West Lafayette, IN, United States, 2Weldon School of Biomedical Engineering, Purdue University, West Lafayette, IN, United States
Synopsis
Previous research conducted on Myconnectome project (90 resting scan sessions of one subjects) found that systemic low frequency oscillations (sLFOs) extracted from resting-state fMRI data of big arteries to be: 1) negatively correlated with; 2) temporally leading, the fMRI data from the veins. To generalize the finding, the resting state scans from 20 randomly selected subjects of Human Connectome Project (HCP) were analyzed. The findings were validated among around 80% of the data, which also showed that cerebral circulation time between females and males are significantly different.
Introduction
Blood oxygen level-dependent (BOLD) signal is the main contrast used in functional MRI (fMRI), which reflects neuronal activation indirectly through T2* effect. Little attention has been focused on the BOLD signal in big arteries due to the facts that there is: 1) little T2* effect; 2) no neuronal activation in the arteries. Our previous study showed that the low frequency oscillations of BOLD signals found in internal carotid arteries (ICA) will also be found seconds later in the BOLD signals of global mean (~3s) and superior sagittal sinus (SSS; ~6s), with negative phase.1 However, in that research, all 90 resting state scans (Myconnectome project 2) were from one single subject. It is hard to tell if the phenomenon applies for general populations. Therefore, in this study, we randomly selected 20 subjects from Human Connectome Project Data (HCP) 3 to do similar analysis. We tried to: 1) validate that the sLFO in ICA is negative correlated with and temporally leading the sLFO in SSS; 2) explore the gender difference in cerebral circulation time (delay between sLFOs from ICA and SSS).Methods
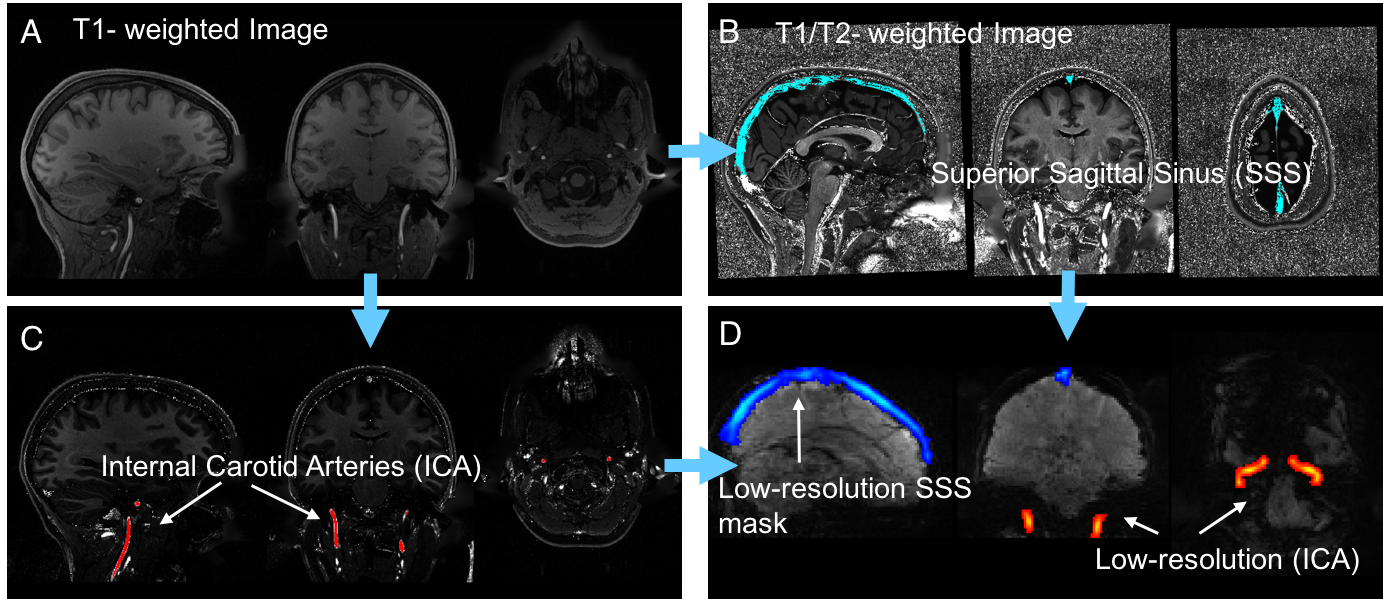
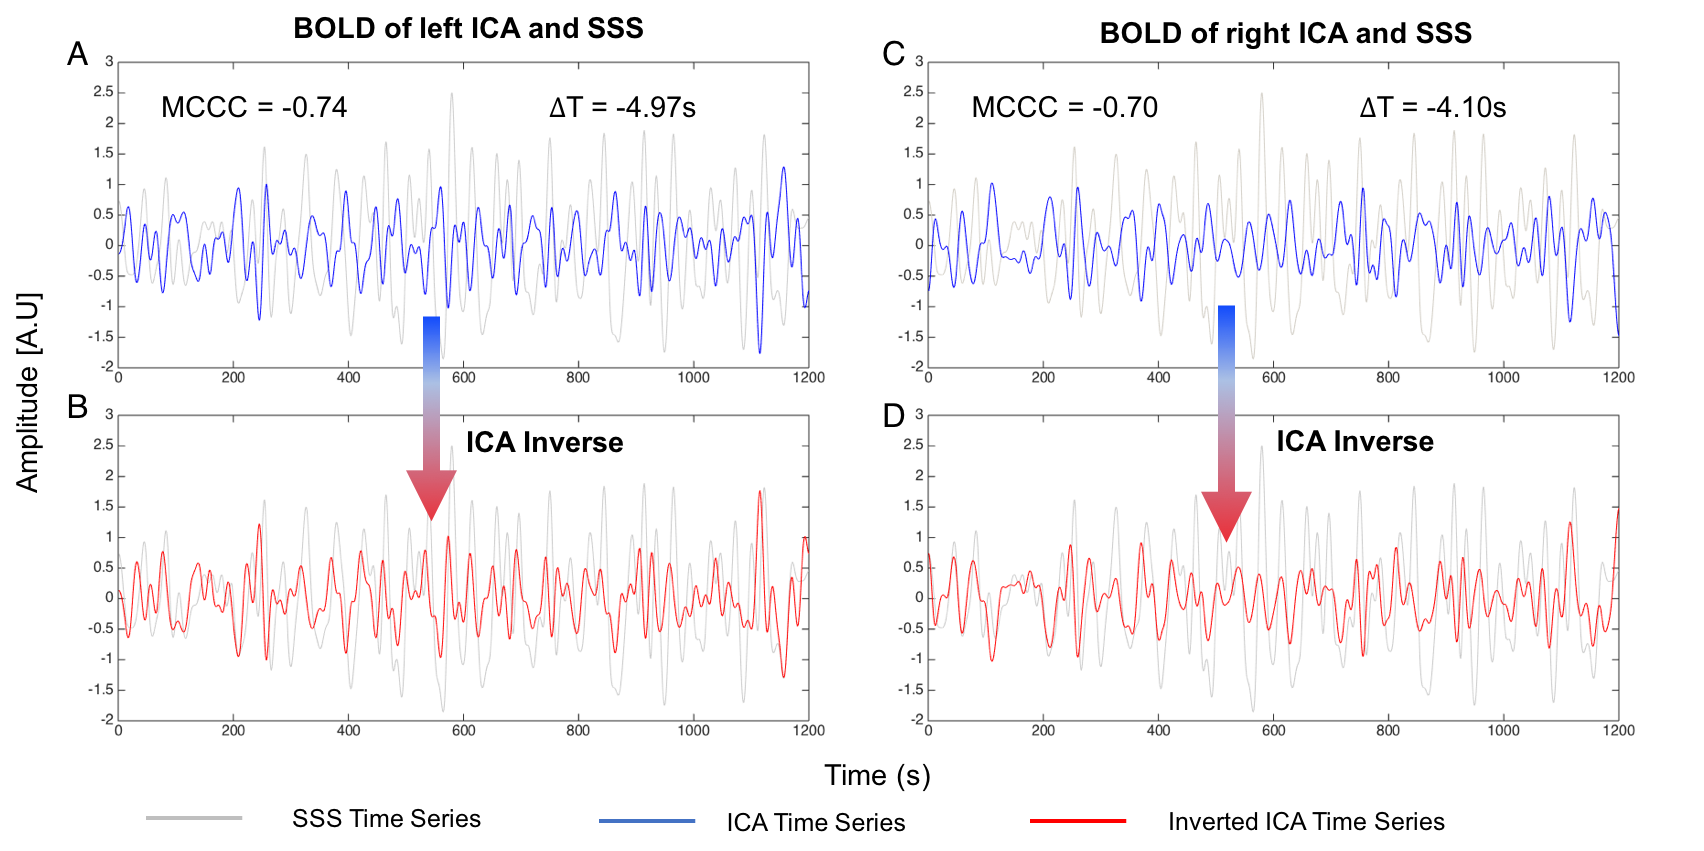
In this project, 20 subjects (F:12; M:8) from WU-Minn HCP Data 3 were randomly selected and their resting state data were analyzed. Each subject has 4 repeated resting state scans. After preprocessing the data (motion correction, registration, etc), we performed three steps for analysis. 1) Due to the low contrast in fMRI data, the ICA and SSS vessels can only be identified in T1- and T2- weighted images, as masks (using Matlab, the Mathworks, USA). 2) These masks were applied (using the registration matrix from step 1) onto low-resolution resting state fMRI data to extract corresponding time series from ICAs and SSS. Figure 1 shows the results of step 1 and step 2. 3) We calculated the cross-correlation between time series of ICA and SSS using MATLAB (“xcorr” built-in function). In this step, we oversampled time series first and then using low pass filter, ranging from 0.01Hz to 0.08Hz to select the LFOs from the original time series. Then, the max cross correlation coefficients (MCCCs) and corresponding delay times between ICA and SSS time series were obtained. Figure 2 shows the example times series from ICA and SSS. To avoid spurious correlation, we set negative MCCC threshold (<-0.3) 1. Student T-test was applied for those data satisfied the threshold (“qualified data”) to test the gender difference in cerebral circulation time.Results
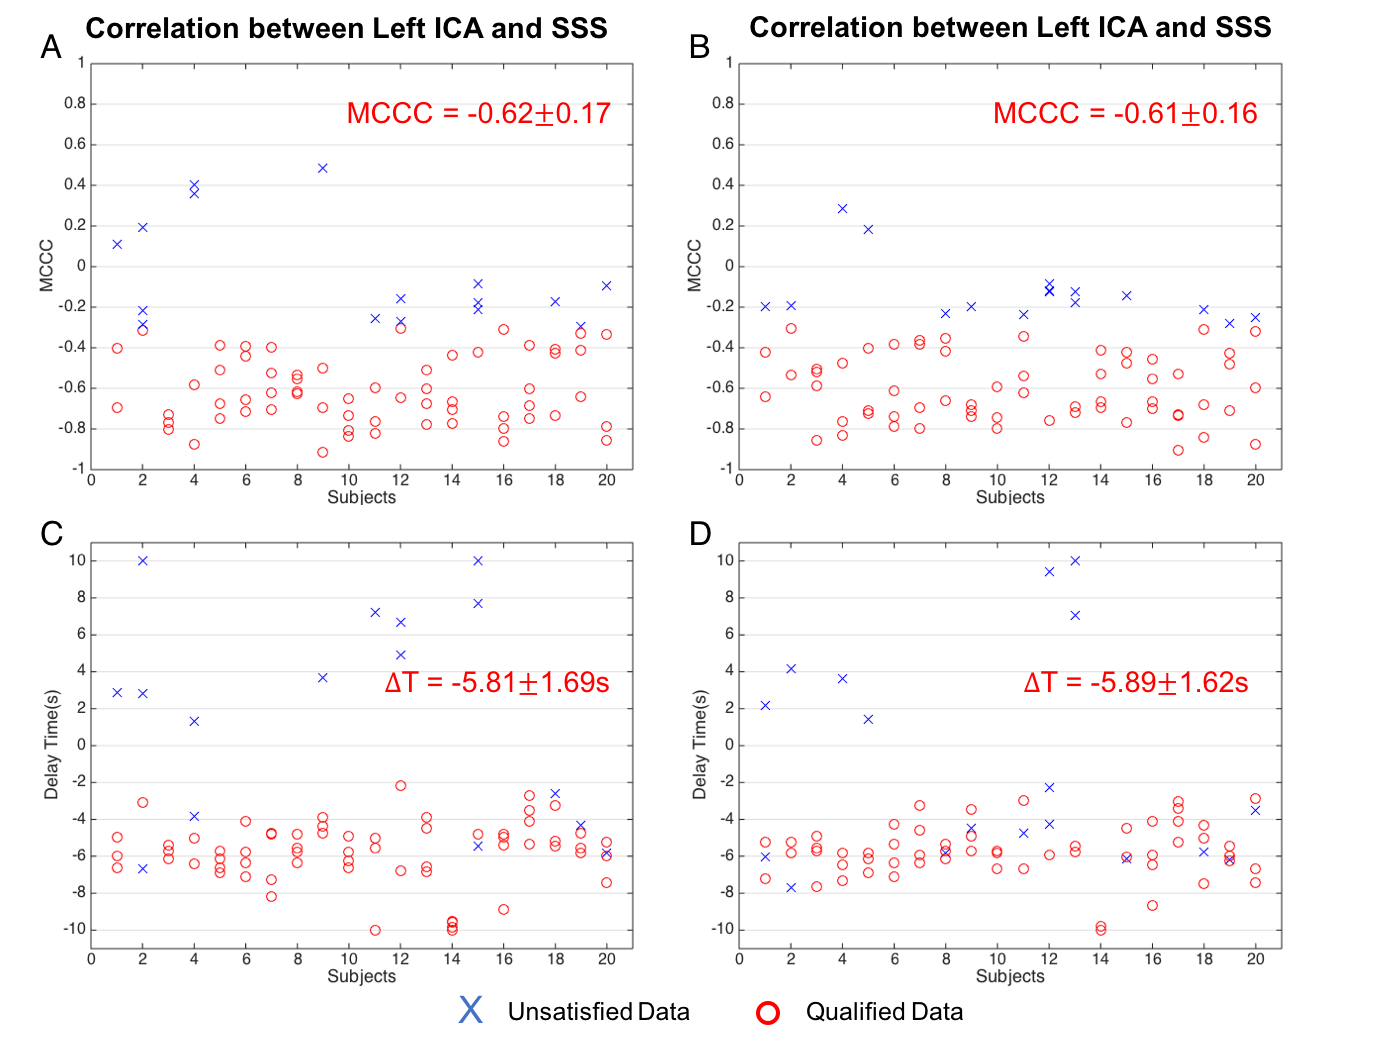
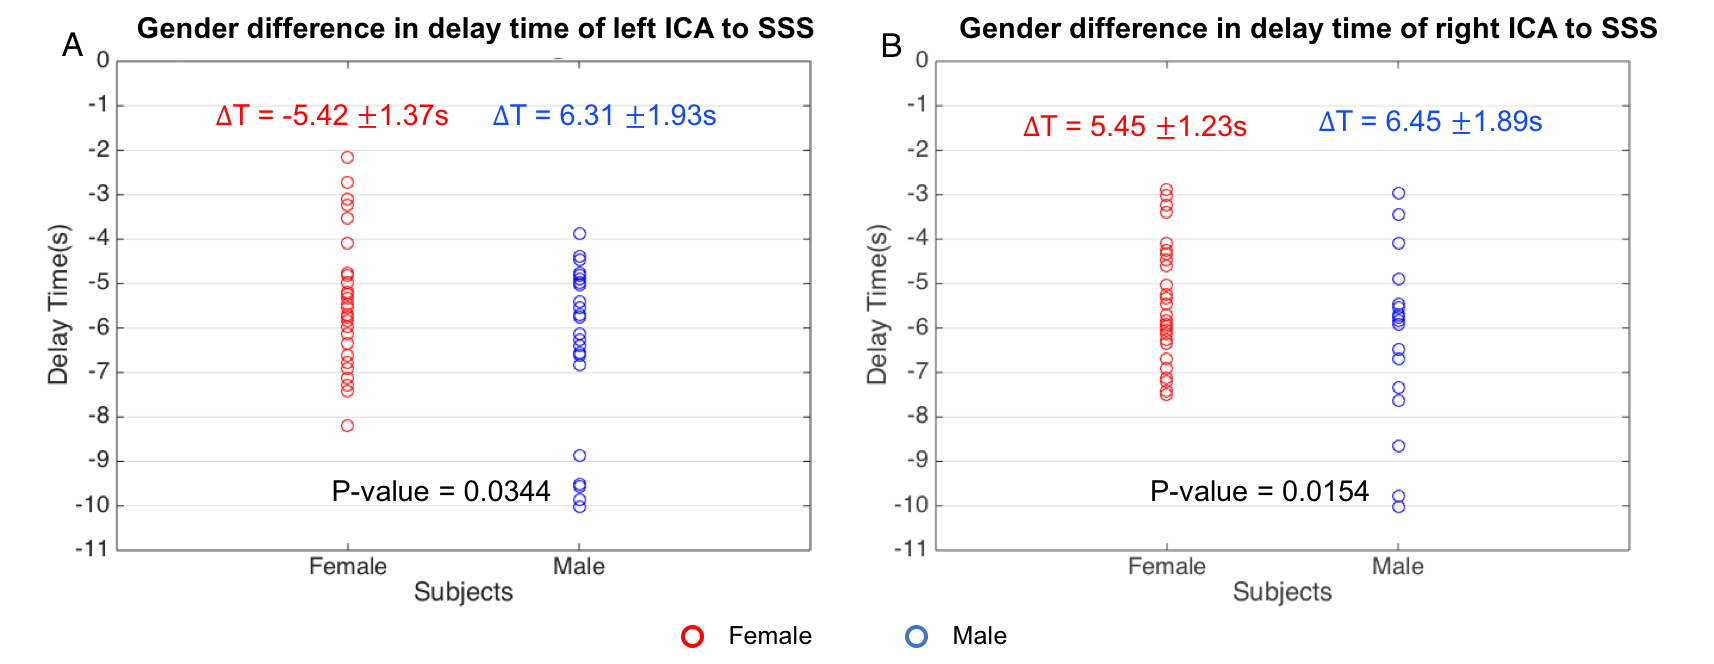
Figure 3 shows the MCCCs (Fig 3 (A-B)) and delay times (Fig 3 (C-D)) calculated from 80 resting state data (4 scans X 20 subjects). The results from left-ICA and SSS are shown in Fig 3A and 3C, while the results of right ICA and SSS are shown in Fig 3B and 3D. The qualified data (>77% of all the data) were marked by red dots. It shows the significant negative correlations between the BOLD signals of ICAs and SSS. More importantly, the sLFOs in left and right ICAs were found to lead those of SSS by 5.81±1.69 seconds, and 5.89 ± 1.62 seconds, respectively. Cerebral circulation time (defined as blood travel time from ICA to SSS) of similar magnitude (~5s) were found previously using ultrasound4. Figure 4 shows the significant difference in delay times from ICAs to SSS between women and men (Women: ~5.4s v.s. Men: ~6.4s ) with P-value < 0.05, which was in line with the research of Vavilala, et al5.Conclusion
First, we have validated that our findings about arterial fMRI signals in 20 subjects’ resting state data from HCP. Using this novel method, we are able to detect a significant gender difference on cerebral circulation time among healthy subjects. For the future work, we will further develop perfusion methodology using fMRI data from big vessels and apply this on special groups, such as elder people.Acknowledgements
This work was supported by the National Institutes of Health, Grants K25 DA031769(YT).References
1. Tong Y, Frederick BD. The global mean cerebral BOLD signal is present in incoming arterial blood. Proceedings of the 18th Annual Meeting of the OHBM. Vancouver, Canada2017.
2. Poldrack RA, Laumann TO, Koyejo O, Gregory B, Hover A, Chen MY, Gorgolewski KJ, Luci J, Joo SJ, Boyd RL, Hunicke-Smith S, Simpson ZB, Caven T, Sochat V, Shine JM, Gordon E, Snyder AZ, Adeyemo B, Petersen SE, Glahn DC, Reese Mckay D, Curran JE, Goring HH, Carless MA, Blangero J, Dougherty R, Leemans A, Handwerker DA, Frick L, Marcotte EM, Mumford JA. Long-term neural and physiological phenotyping of a single human. Nat Commun. 2015;6:8885. doi: 10.1038/ncomms9885. PubMed PMID: 26648521; PMCID: PMC4682164.
3. Van Essen DC, Smith SM, Barch DM, Behrens TE, Yacoub E, Ugurbil K, Consortium WU-MH. The WU-Minn Human Connectome Project: an overview. Neuroimage. 2013;80:62-79. Epub 2013/05/21. doi: 10.1016/j.neuroimage.2013.05.041. PubMed PMID: 23684880; PMCID: PMC3724347.
4. Schreiber SJ, Franke U, Doepp F, Staccioli E, Uludag K, Valdueza JM. Dopplersonographic measurement of global cerebral circulation time using echo contrast-enhanced ultrasound in normal individuals and patients with arteriovenous malformations. Ultrasound Med Biol 2002; 28(4): 453-8. 5. Vavilala MS, Kincaid MS, Muangman SL, Suz P, Rozet I, Lam AM. Gender differences in cerebral blood flow velocity and autoregulation between the anterior and posterior circulations in healthy children. Pediatric research. 2005 Sep 1;58(3):574-8.
Figures