2305
Cortical propagation of slow oscillation-associated traveling waves resolved by fast line scanning in brain-state-informed BOLD fMRI1Institute of Microanatomy and Neurobiology, University Medical Center of the Johannes Gutenberg University Mainz, Mainz, Germany
Synopsis
Cortical activity patterns – both spontaneous and stimulus-evoked – are significantly impacted by the respective functional brain state. Here, we explored activity patterns in two brain states: persistent state, maintained by sedation, and slow wave state, dominated by slow-oscillation-associated waves, maintained by rather deep anesthesia. Upon visual stimulation, we found localized activation of the visual cortex only in persistent state, whereas in slow wave state, large areas of the cortex are recruited. By applying fast line scanning methods, we could for the first time resolve a propagation of slow waves by fMRI, presumably evoked by visual stimulation.
INTRODUCTION
Slow-oscillation-associated slow wave state represents a brain state occurring naturally in sleep, indispensable for memory consolidation and long-range coherence, characterized by a typical pan-cortical activation pattern1, 2, in sharp contrast to the awake-like persistent state. The individual slow wave events occur spontaneously, but can be evoked by sensory stimulation in the respective sensory cortical area, and represent a traveling wave of activity, as resolved by optical recordings1. Here, we ask, whether fast line scanning-methods are suitable to resolve slow wave propagation, benefiting from their high spatial3 or temporal4 resolution.METHODS
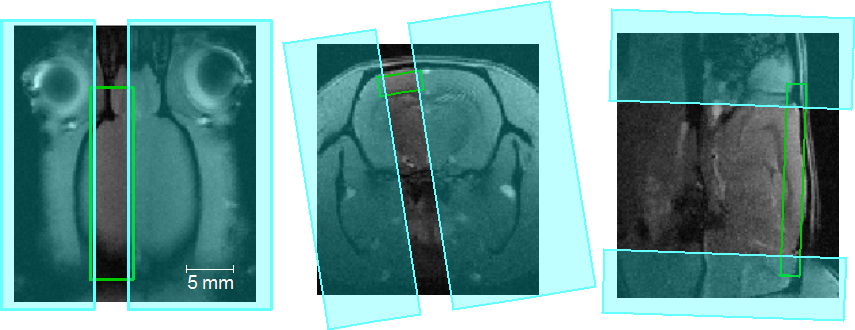
All MR-imaging was performed at a 9.4 T Bruker BioSpec-System (Bruker, Germany). The line scanning-pulse sequence used in our experiment was a FLASH (fast low angle shot)-sequence with switched off gradient and FFT (fast Fourier transform) in phase-encoding-direction. Field of view was restricted by saturation-slabs in this direction. TR/TE/FA were 50 ms/18 ms/13°, spatial resolution was 0.6 mm in readout-direction, and slice thickness was 2 mm. The line was placed in anterio-posterior axis along the cortex as shown in Fig. 1. For the imaging experiments, 5 female Lewis-rats were anesthetized by 1.5% isoflurane to maintain slow wave state, as demonstrated by characteristic spontaneous activity patterns, and sedated by medetomidine (i.p. bolus injection of 0.04 mg/kg and constant perfusion of 0.08 mg/kg/h) to maintain persistent state. To determine the respective brain state, we first acquired resting state activity during 15 minutes and performed an ICA (independent component analysis) on the data using the GIFT analysis tool (MIALAB). Visual stimulation was performed by 50 ms pulses at a frequency of 3 Hz for 1.5 s every 19 s. Data was evaluated by an in-house Matlab-software (The MathWorks Inc., Germany). The time course was low pass-filtered and divided into time frames of 19 s (7 s baseline prior to stimulation and 12 s post stimulation). Data from each time frame was normalized to its baseline. To ensure a BOLD-response was elicit by stimulation, only trials with a averaged signal-rise exceeding 2* SD of baseline were selected and averaged. Each voxel of the averaged data was analyzed to determine stimulus locked BOLD-activity.RESULTS
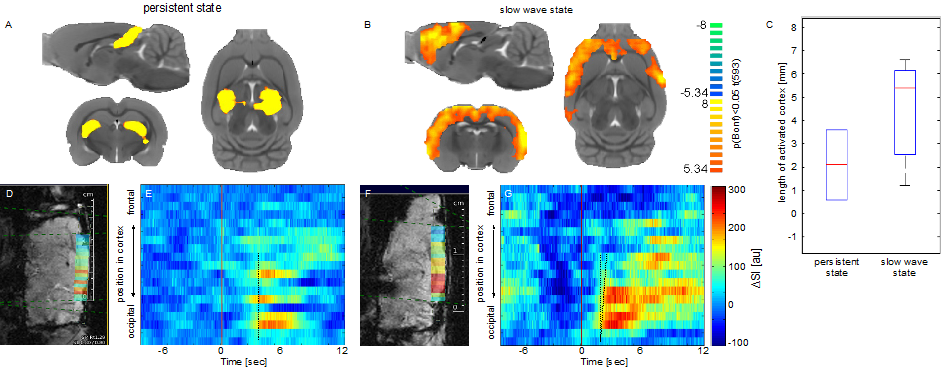
Under persistent state ICA reveals canonical resting state networks such as default mode or somatosensory networks. In contrast, in slow wave state, at least one ICA component shows a cortex wide spread of activation. Similarly, during visual stimulation in persistent state, changes in BOLD activity were restricted to visual areas such as V1, superior colliculus and thalamus (figure 2A). Notably, during visual stimulation in slow wave state BOLD activation was observed cortex wide (figure 2B).
Line scanning confirmed ICA results, a significantly larger portion of the cortex was activated during slow wave state: The activated region in persistent-state was in average 2.1 mm (0.6 mm – 3.6 mm) whilst in slow wave state was 5.4 mm (2.6 mm – 6.2 mm) (figure 2C) What is more, only in persistent state, the increase in the BOLD signal was restricted to the visual cortex (figure 2D-G). Notably, only in slow-wave state the onsets of evoked BOLD responses were occurring first in the visual cortex, and exhibit an increasing delay in the posterior-anterior axis, suggesting activity propagation from its origin in primary visual cortex (figure 2D-G).
DISCUSSION
As previously shown in recordings of spontaneous activity by conventional multislice 2d-fMRI, only in slow wave-state synchronous activation of the entire cortex occurs1. Here, we demonstrate, that the two different brain states significantly shape response patterns upon sensory stimulation, again, in slow wave state, large areas of the cortex are recruited. Most importantly, we can indeed resolve a propagation of slow waves upon visual stimulation, originating from the visual cortex. Indeed, line scanning methods can bridge the apparent gap between the high temporal resolution of optical and electrophysiological methods and brain-wide fMRI methods, given that the nature of the neurophysiological event is known and the brain state defined.CONCLUSION
Here, we show, that using fast line scanning, we can employ BOLD fMRI to resolve the cortical propagation of neurophysiologically defined slow wave events. As particularly the propagation of slow waves is significantly disturbed in Alzheimer’s disease5, these brain-state-informed measures have the potential to serve as an early biomarker of normal cortical function.Acknowledgements
No acknowledgement found.References
- Schwalm M, Schmid F, Wachsmuth L, Backhaus H, Kronfeld A, Aedo Jury F, Prouvot PH, Fois C, Albers F, van Alst T, Faber C, Stroh A. Cortex-wide BOLD fMRI activity reflects locally-recorded slow oscillation-associated calcium waves. Elife. 2017 Sep 15;6. pii: e27602.
- Stroh A, Adelsberger H, Groh A, Rühlmann C, Fischer S, Schierloh A, Deisseroth K, Konnerth A. Making waves: initiation and propagation of corticothalamic Ca2+ waves in vivo. Neuron. 2013 Mar 20;77(6):1136-50.
- Yu X, Qian C, Chen DY, Dodd SJ, Koretsky AP. Deciphering laminar-specific neural inputs with line-scanning fMRI. Nat Methods. 2014 Jan;11(1):55-8.
- Albers F, Schmid F, Wachsmuth L, Faber C. Line scanning fMRI reveals earlier onset of optogenetically evoked BOLD response in rat somatosensory cortex as compared to sensory stimulation. Neuroimage. 2016 Dec 21. pii: S1053-8119(16)30786-8.
- Busche MA, Kekuš M, Adelsberger H, Noda T, Förstl H, Nelken I, Konnerth A. Rescue of long-range circuit dysfunction in Alzheimer's disease models. Nat Neurosci. 2015 Nov;18(11):1623-30.
Figures