2298
Cerebrovascular function in the middle cerebral artery measured using the cardiac-induced inflow effect on fast echo-planar imaging.1School of Physics and Astronomy, Cardiff University Brain Research Imgaging Centre (CUBRIC), Cardiff University, Cardiff, United Kingdom, 2Siemens Healthcare GmbH, Erlangen, Germany, 3Siemens Healthcare Ltd, Camberly, United Kingdom
Synopsis
We demonstrate that cardiac-induced pulsatile flow-related signal enhancement in fast EPI provides a dynamic assessment of cerebrovascular function in the brain’s large feeding arteries. We show that cardiac pulsatile waveforms, derived from magnitude data taken at the site of the middle cerebral artery, are attenuated at longer TRs, suggesting they are related to pulsatile flow rather than volume changes. The same waveforms are modulated by a global flow-increasing hypercapnic challenge, showing that this endogenous signal contrast can be useful for exploring dynamic cerebrovascular function. We propose that a multi-shot segmented EPI approach will further increase this signal contrast.
Purpose
Important parameters of cerebrovascular health such as vessel wall compliance, impedance and reflection, can be obtained by studying pulsatile changes in blood volume and flow velocity stemming from the cardiac induced pressure wave. Bianciardi et al recently optimised a fast non-gated EPI sequence to be sensitive to cardiac induced cerebral blood volume (CBV) changes [1]. We have taken a similar approach to create a contrast that is predominantly weighted towards cerebral blood flow velocity (CBFV) changes, using a fast EPI readout with a very short TR, a 90° flip angle and a relatively thick slice. The purpose of this study is to provide a proof of principle for exploiting flow related enhancement of the magnitude signal in fast EPI. We conclude that multi-shot segmented EPI approaches are very desirable for this application.Methods
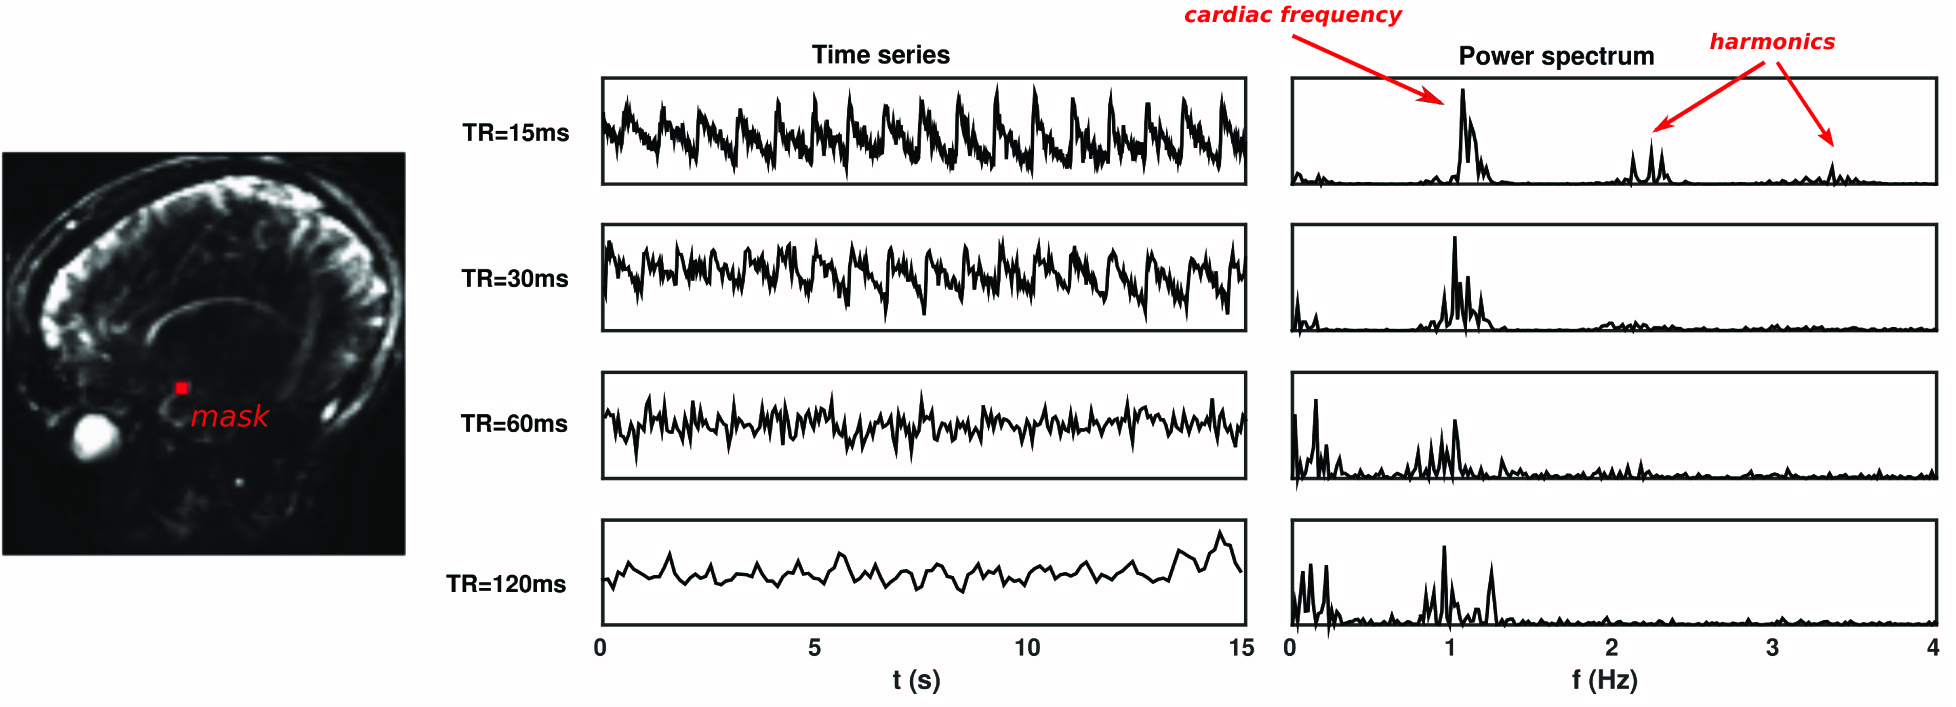
Image acquisition: A Siemens 3T MAGNETOM Prisma clinical scanner equipped with a 32-channel receiver head coil (Siemens Healthcare GmbH, Erlangen) was used to acquire data in 5 healthy adults. A phase contrast scan was used to localise subsequent EPI scans, which were positioned over a segment of the right middle cerebral artery (MCA) that best approximated a perpendicular transection (Fig.1A). Twelve combinations (4 different TR conditions (TR), 3 different hypercapnia conditions (HC)) of ~60s scans were acquired using a gradient-echo EPI sequence with the following parameters: TR=15/30/60/120ms, dynamics=4096,2048,1024,512, TE=6.8ms, flip angle=90°, FOV=192mm (2mm2 in-plane resolution), GRAPPA=5, bandwidth=2500 Hz/Px. The 3 HC conditions were achieved by manually targeting PETCO2 to 3 discrete levels relative to baseline i.e. no hypercapnia (+0), a +4 mmHg block (+4), and a +8 mm Hg block (+8). A pulse oximeter and a belt were used to record the pulse and respiratory waveforms respectively.
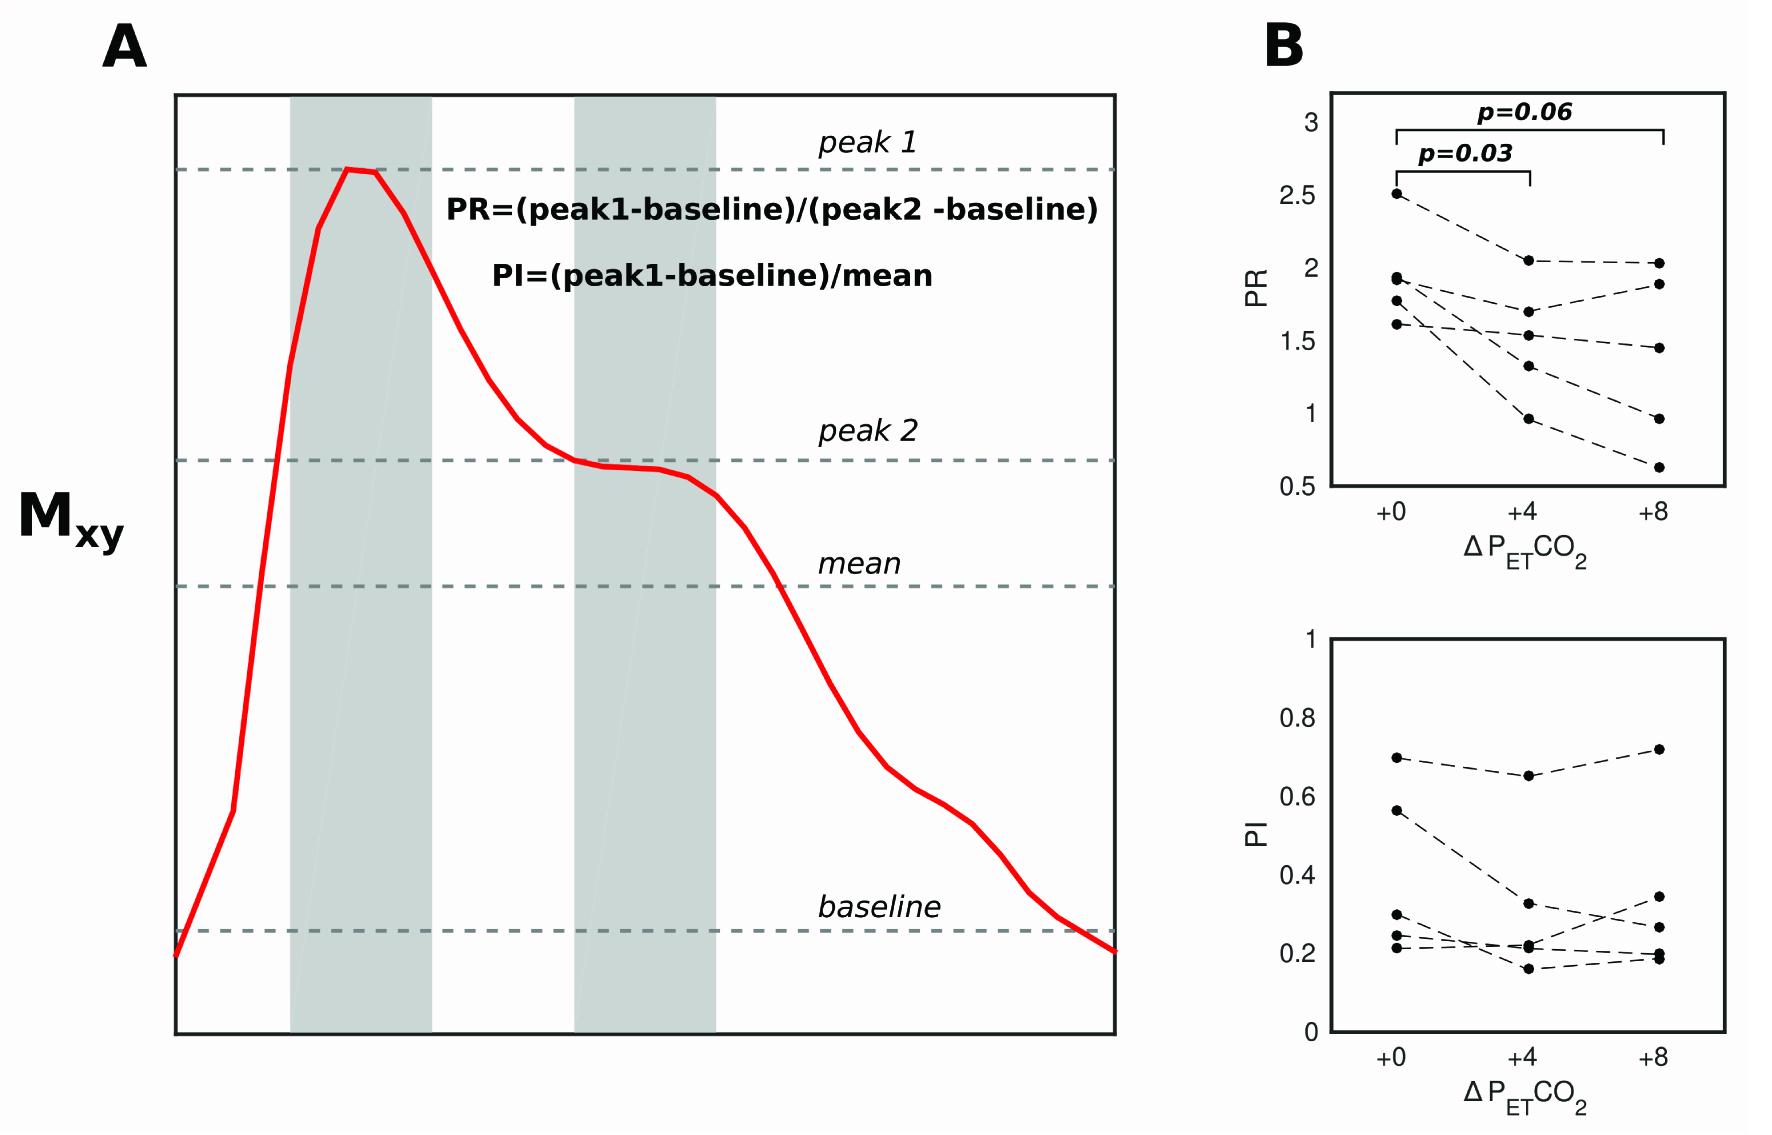
Data analysis: After motion correction and removal of linear trends and respiratory noise, data were retrospectively gated using pulse oximeter traces to create a single cardiac waveform. A mask of 9 voxels centered on the voxel of peak mean intensity in the MCA region was created, and the mean cardiac waveform calculated. To facilitate a quantitative analysis of cardiac waveforms, a Pulsatility Index (PI) and Peak Ratio (PR) measure were defined and calculated for each condition (Fig.4).
Results
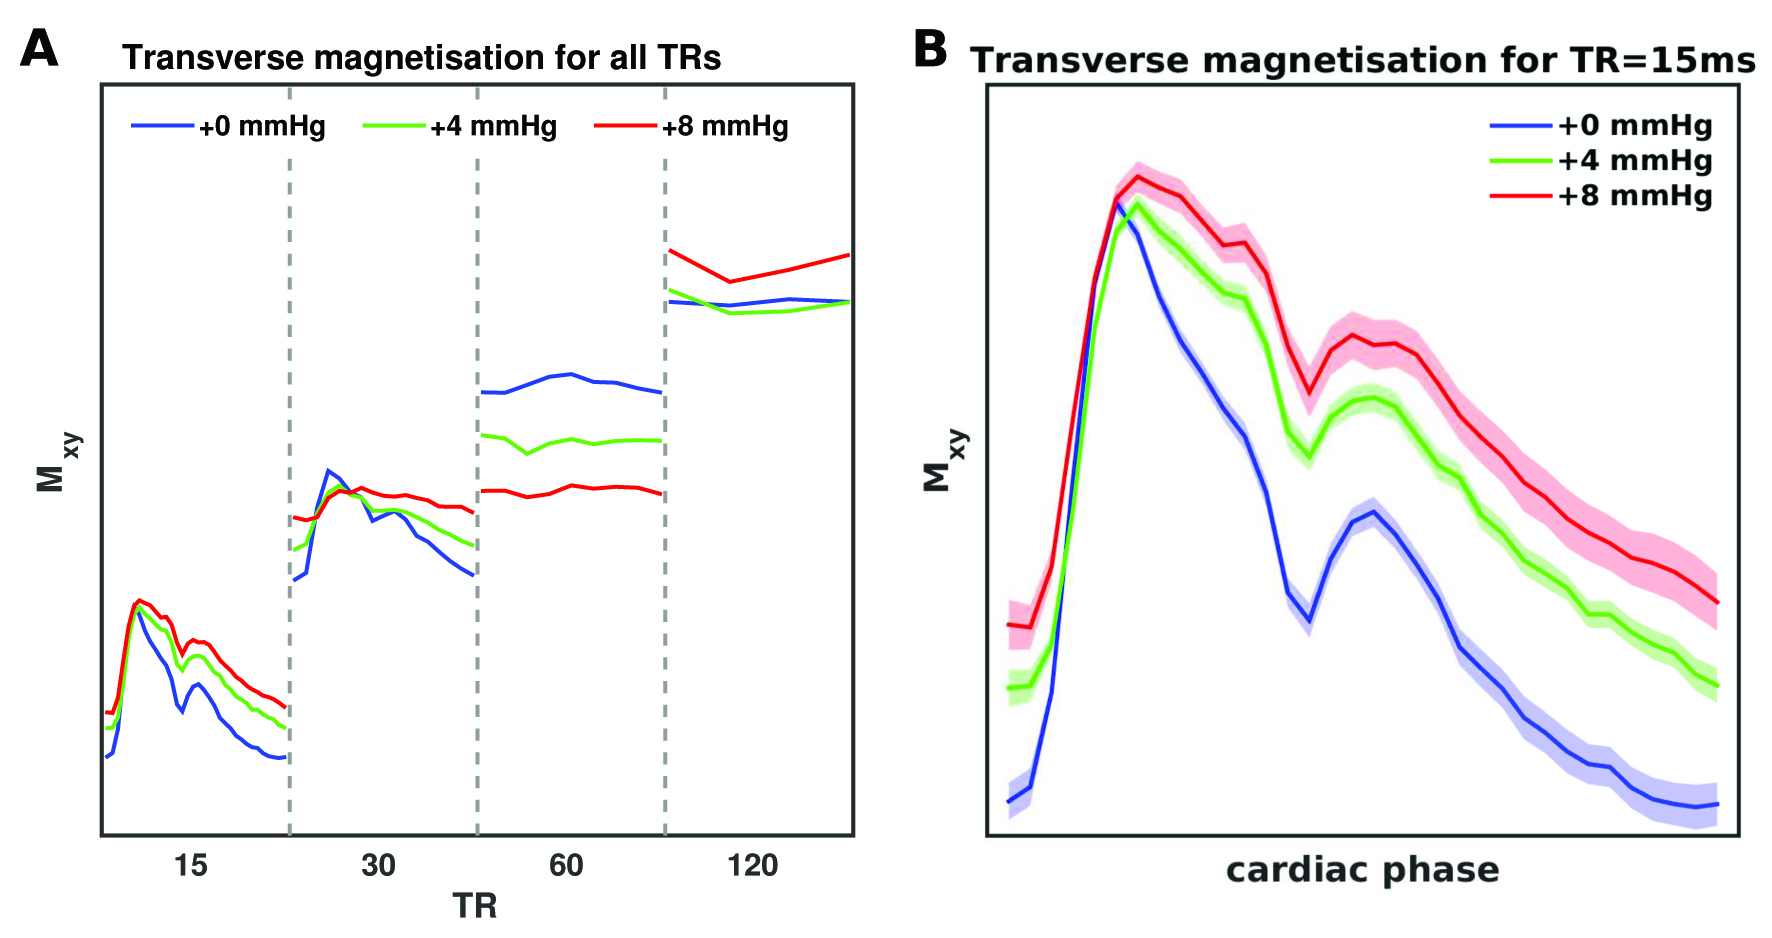
Fig.2 displays the MCA time series and corresponding power spectrum for each TR; the power at the cardiac fundamental and harmonic frequencies reduces as a function of TR. Fig.3 demonstrates that the strongest cardiac waveform is in the TR15 scan, with TR30 showing less defined peaks. TR60 and TR120 lack discernable cardiac waveforms. Since the sequence is increasingly sensitive to inflow at the shortest TRs, these results suggest that the measured cardiac waveforms are directly related to CBFV pulsatility.
Two clearly resolved peaks are present in the TR15 waveform; the second possibly representing the reflected wave, which is observed in TCD measures of CBFV in MCA[2]. For TR15, a clear separation is observed between waveforms for the different PETCO2 levels (Fig. 3B). There is no significant modulation of PI by hypercapnia, but the PR is attenuated at +4 mm Hg compared to +0 (p=0.03), and the same trend is observed at +8 mmHg (p =0.06) (compared to +0).
Discussion
Recently, accelerated EPI has been used to explore cerebrovascular compliance [1, 3]. In this pilot study we use fast EPI and demonstrate strong cardiac pulsatility of the magnitude signal in region of the MCA, which is attenuated with increasing TR, suggesting a signal contrast that is primarily flow dependent. Properties of the pulsatile waveform, such as the ratio between the primary and secondary peak, appear to be modulated by hypercapnia, which causes global vasodilation of downstream vessels and potentially dilation of the MCA itself[4]. This suggests that this magnitude based contrast mechanism is sensitive to vascular changes that occur within subjects, and thus may be useful for characterising dynamic cerebrovascular properties with high sensitivity.
However, confidence in these data is undermined by its coarse spatial resolution, which means CBV and partial volume effects may confound the results. With single-shot EPI, higher spatial resolution necessarily requires a longer TR, which as demonstrated here attenuates the inflow effect. We propose that a multi-shot segmented EPI approach would be desirable as additional lines of k-space could be acquired without sacrificing the saturation effect. Shorter time between RF pulses would allow thinner slices to be acquired without losing sensitivity to flow velocities[1]. The high sampling rate afforded by a magnitude based EPI approach allows analysis of the cardiac waveform on a beat-to-beat basis, which could be informative for understanding dynamic changes in vascular compliance and downstream resistance.
Acknowledgements
This work was supported by the Wellcome Trust [WT200804]References
1. Bianciardi, M., et al., The pulsatility volume index: an indicator of cerebrovascular compliance based on fast magnetic resonance imaging of cardiac and respiratory pulsatility. Philos Trans A Math Phys Eng Sci, 2016. 374(2067).
2. Robertson, J.W., et al., Variability of middle cerebral artery blood flow with hypercapnia in women. Ultrasound Med Biol, 2008. 34(5): p. 730-40.
3. Viessmann, O., H.E. Moller, and P. Jezzard, Cardiac cycle-induced EPI time series fluctuations in the brain: Their temporal shifts, inflow effects and T2 * fluctuations. Neuroimage, 2017. 162: p. 93-105.
4. Verbree, J., et al., Assessment of middle cerebral artery diameter during hypocapnia and hypercapnia in humans using ultra-high-field MRI. J Appl Physiol (1985), 2014. 117(10): p. 1084-9.
Figures