2297
Age-associated changes in skeletal muscle morphology assessed by intramuscular adipose and connective tissue1Radiology, Johns Hopkins University, Baltimore, MD, United States, 2Johns Hopkins University, Baltimore, MD, United States, 3Toshiba Medical Research Institute USA Inc, Mayfield Village, OH, United States, 4Toshiba Medical Systems Corporation, Tochigi, Japan
Synopsis
In human skeletal muscles, the aging process causes a decrease of contractile function likely associated with an increase in intramuscular adipose and connective tissues. The accumulation of non-contractile tissues and loss of muscle tissue may contribute to sarcopenia and frailty observed at older age but their quantification is challenging1. The purpose of this study was to establish MR imaging-based methods to quantify the relative amounts of fat and connective tissue in healthy human subjects, and investigate their association with age.
Introduction
The loss of muscle mass is considered to be a major determinant of strength loss in aging. However, studies examining the association between the loss of muscle quality with aging is lacking1. Dixon MRI can accurately assess muscle fat percent. Recently, ultra-short echo time (UTE) has been proposed as a viable technique to assess fibrosis or the presence increased connective tissue2. In this study, we aim to explore if healthy aging without is associated with loss of muscle quality.Methods
We assessed changes in skeletal muscle morphology in 15 healthy volunteers (11 men and 4 women) between the ages of 21 and 80. Questionnaires and medical records were checked to ensure there was no prior history of associated disease conditions such as peripheral artery disease, sarcopenia, or frailty. Patients were scanned on a Toshiba 3T Galan system with a 64-channel phased array coil and a body coil to assess calf musculature. Dual-echo 3D Dixon techniques were employed to assess fat distribution and percent fat quantification with imaging parameters – TR/TE = 5.1/(1.1, 2.8) ms, flip angle = 12 deg, slice thicknes = 5 mm, FOV = 42x34 cm, Matrix 224x224. Users defined regions-of interest for each of the three muscle regions – the tibialis anterior, the soleus and the gastrocnemius, and excluded areas of extensive connective tissue and nerves from the fat fraction map (fat*100/(fat+water)). An average of the fat% from the 3 ROIs was used to calculate mean muscle fat% (FPm), and the standard deviation of the fat% among all the ROIs was also calculated (FPsd). Linear regression analysis was used to assess the association of age, gender and body mass index (BMI) on FPm and FPsd. In a subset of 4 participants, we also assessed image quality using 3D UTE imaging of the calf muscle with parameters – FOV: 256 mm, TR = 3.1 ms, FA = 30 deg, BW = 488,1 kHz, 32,000 trajectories filling ~15% of k-space. Images were acquired at 2 TE’s – 0.096 and 2 ms, and the subtraction (I0.096 – I2.00) was used for assessing intramuscular connective tissue.Results
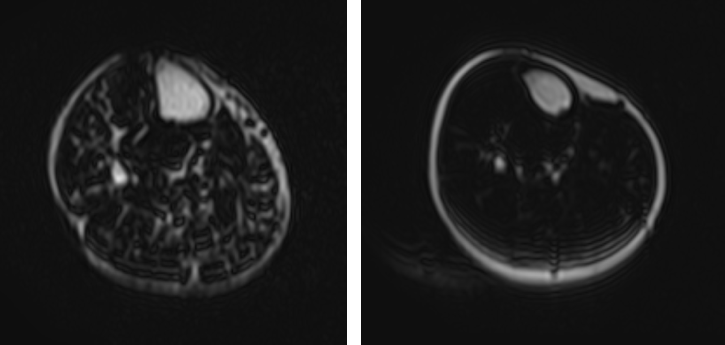
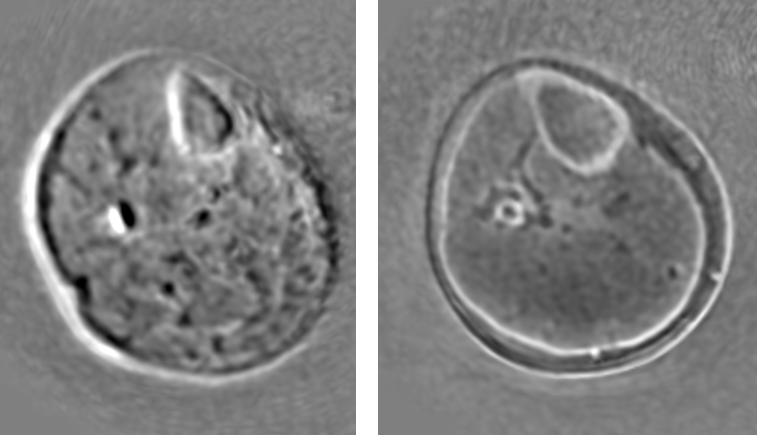
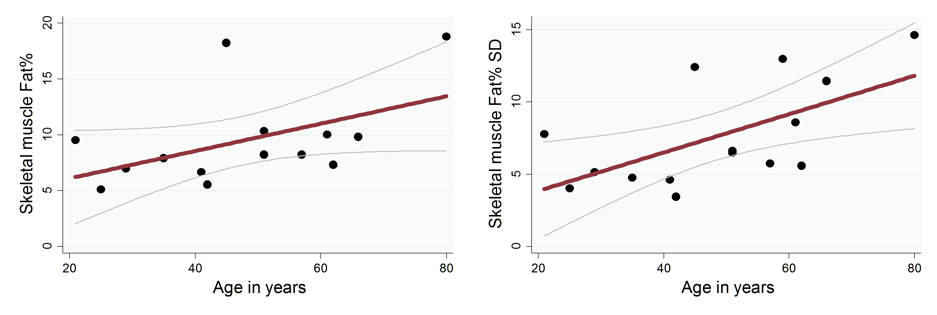
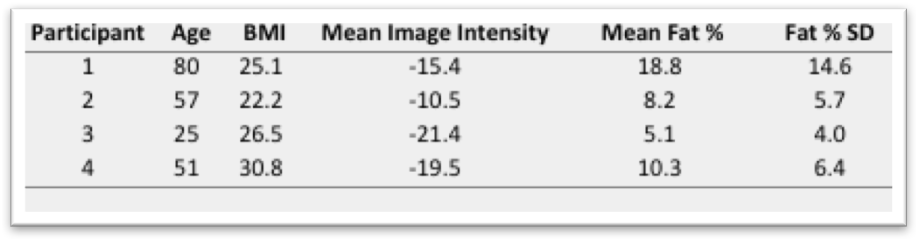
Figure 1 shows fat-fraction maps in a healthy young and older volunteer. As can be seen, there is increased fatty infiltration in the older adult as opposed to the younger adult. Higher FPm (r = 0.50, p = 0.07) and FPsd (r= 0.61, p = 0.02) were associated with older age (Figure 3). Similarly, higher BMI was associated with higher FPm (r = 0.61, p = 0.02) and FPsd (r = 0.47, p = 0.08) (Figure 4). Calf muscle FPm and FPsd were not associated with gender. Figure 2 shows the subtracted UTE maps for 2 volunteers. Since, T2* values of collagen are very low, the subtraction map with higher intensities indicate greater collagen (and other short T2*) components. Table (Figure 5) shows that values were highest for the 80-year old participant and lowest for the 25-year old.Discussion
Age and BMI were associated with worsening muscle quality as assessed by mean calf muscle fat fraction as well as standard deviation of the fat distribution across different muscles. In a smaller subset, using UTE, we showed lower muscle quality in older individuals, likely due to both increased fatty infiltration as well as increased fibrosis of skeletal muscle. UTE allows us to isolate very low T2* components such as collagen, but there is subsequent overlap with fat content3,4. In this analysis, we have not isolated intramuscular connective tissue from intramuscular adipose tissue, and future methods will aim to do the same.Conclusion
MRI based skeletal muscle morphology as measured by fat fraction and fibrosis assessment have the potential to be useful in the study of aging and frailty.Acknowledgements
This research was funded by Toshiba Medical Research Institute, USA.References
1. Steven HB, Michael A, Gonzalez MC, et al. Assessing skeletal muscle mass: historical overview and state of the art. J of Cachexia, Sarcopenia, and Muscle. March 2014, Vol. 5, No. 1, 9–18.
2. Siu AG, Ramadeen A, Hu X, et al. Characterization of the ultrashort-TE (UTE) MR collagen signal. NMR Biomed., 28, 1236–1244.
3. Csapo R, Malis V, Sinha U, et al. Age-associated differences in triceps surae muscle composition and strength – an MRI-based cross-sectional comparison of contractile, adipose and connective tissue. BMC Musculoskeletal Disorders, 2014, 15:209.
4. Araujo CE, Azzabou E, Vignaud N, et al. Quantitative ultrashort TE imaging of the short-T2 components in skeletal muscle using an extended echo-subtraction method. Magn. Reson. Med., 2017, 78: 997–1008.
Figures