2296
Use of Entwined Magnitude and Phase-sensitive Inversion REcovery (EMPIRE) Pulse Sequences to Study the Brain and Knee1Radiology, Univ of Cal, San Diego, LaJolla, CA, United States
Synopsis
The combination (addition/subtraction) of magnitude and phase-sensitive IR images (termed EMPIRE technique) when appropriate TIs were used was found to provide increased tissue contrast over specific ranges of tissue T1. This behavior was explored numerically and summarized in signal intensity vs. T1 plots. Clinically relevant applications were demonstrated in brain and knee cartilage using FSE and UTE data collections. In addition to increased contrast, this approach allowed detection of short T2 tissue signals while suppressing unwanted signal from longer T1 tissue fluids.
INTRODUCTION
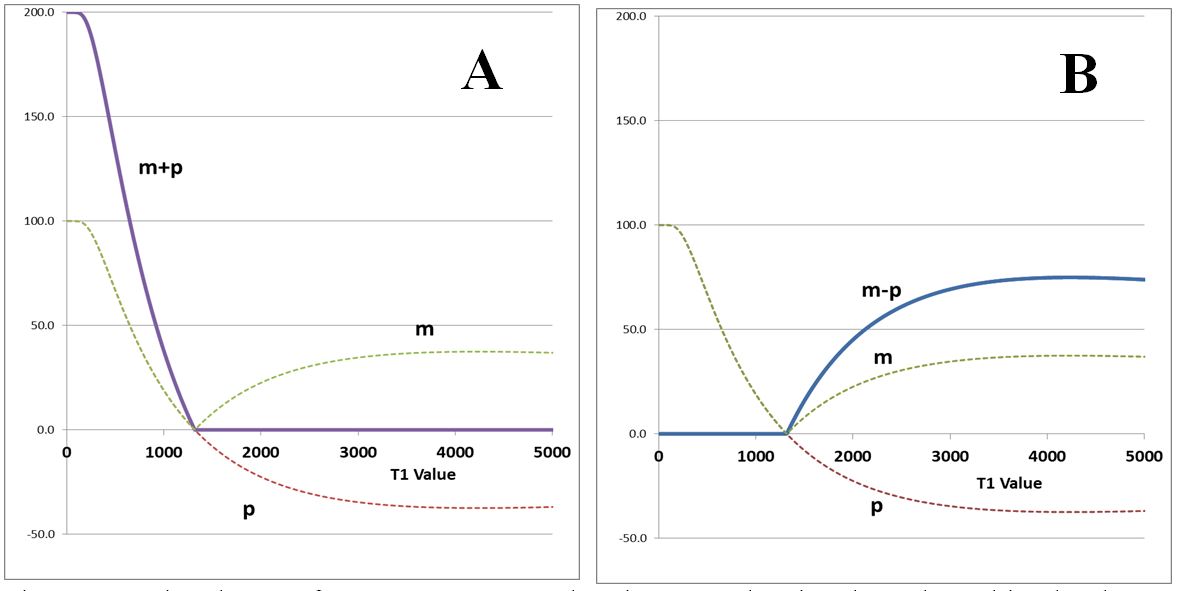
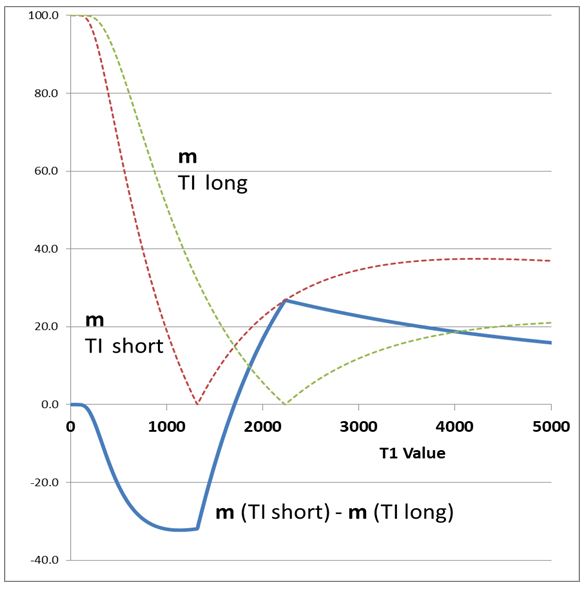
The detected magnetization obtained with IR sequences can have both positive and negative values and can be reconstructed as either phase-sensitive (p) or magnitude (m) images where all values are forced to be positive1. We have examined the utility of combining (add/subtract) these p and m images, obtained with the same or different TIs, using spin echo (FSE) and ultrashort TE (UTE) data collections. (UTE detection is of particular interest because it can detect short T2 magnetization whose longitudinal magnetization has not been inverted by the preceding inversion pulse.) The objectives of our method (EMPIRE) were (i) to examine the signal intensities obtained from various tissues as a result of their T1 values; (ii) to suppress unwanted signals from certain tissue or fluids; (iii) to develop high T1 contrast images using the additive T1 contrast developed by different forms of the sequence; (iv) to provide T1 dependent options that further enhance lesion contrast resulting from changes in mobile proton density (ρm) and T2. For an IR spin echo pulse sequence with a very long TR the simplified Bloch equation is: S = ρm (1-2e-TI / T1) e-TE/T2. The observed signal, S, for a particular sequence having a specific TE and TI depends on ρm, T1 and T2. We show signal intensity of m and p reconstructions and combinations of m and p when plotted against T1 in Figs. 1A and 1B. This approach can be used to selectively show blood plus CSF, or blood and CSF alone. On a sum image certain ranges of T1 produce a slope that can be twice that found in the individual m or p image. (The noise is also increased, however.) It is also possible to use a combination of short and long TIs with magnitude reconstructions to obtain the curve seen in Fig. 2. The subtracted curve has a steep slope for tissues with T1s between those corresponding to the selected TI values. The slope of this curve is greater than either the m or p curve and provides high T1 weighting over a specific T1 range. With a UTE acquisition it is possible to detect signal from short T2 components not detected with FSE; signal from longer T2 components can be reduced by using a short TI prepped UTE acquisition and adding the m + p images.
METHODS
IR images were obtained on a 3T system (GE, Milwaukee) using FSE and UTE data collections with both m and p reconstructions. An additional very long TI acquisition was obtained (all positive signals); this was used to correct individual pixel phases on the TI acquisitions, allowing determination of the actual sign of the longitudinal magnetization. Brain and knee images were obtained in three normal male volunteers (ages 28, 32, 73 yrs).RESULTS
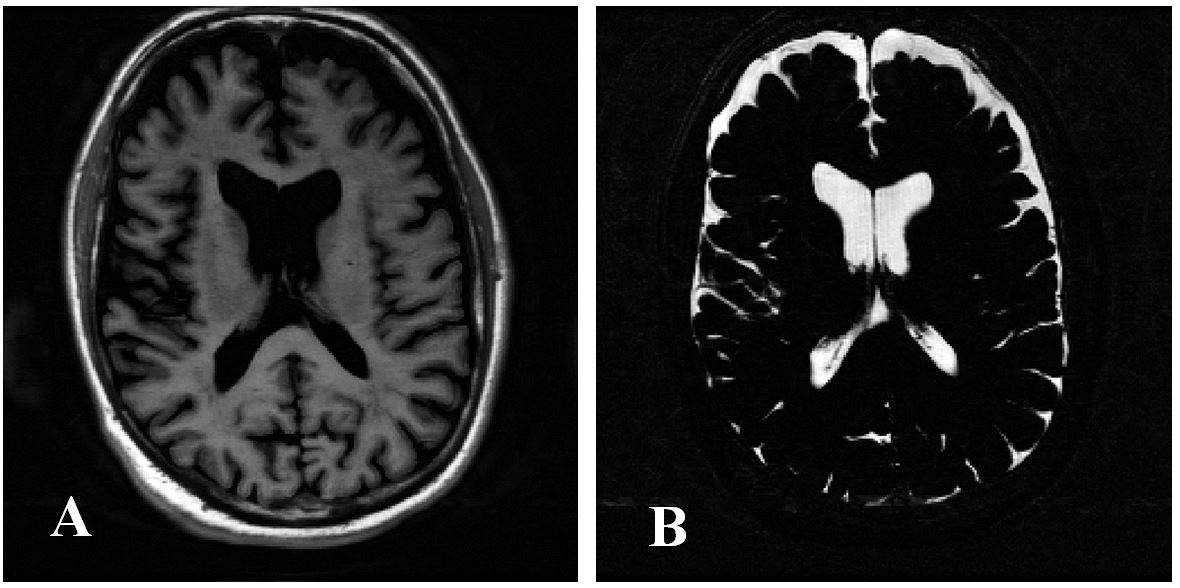
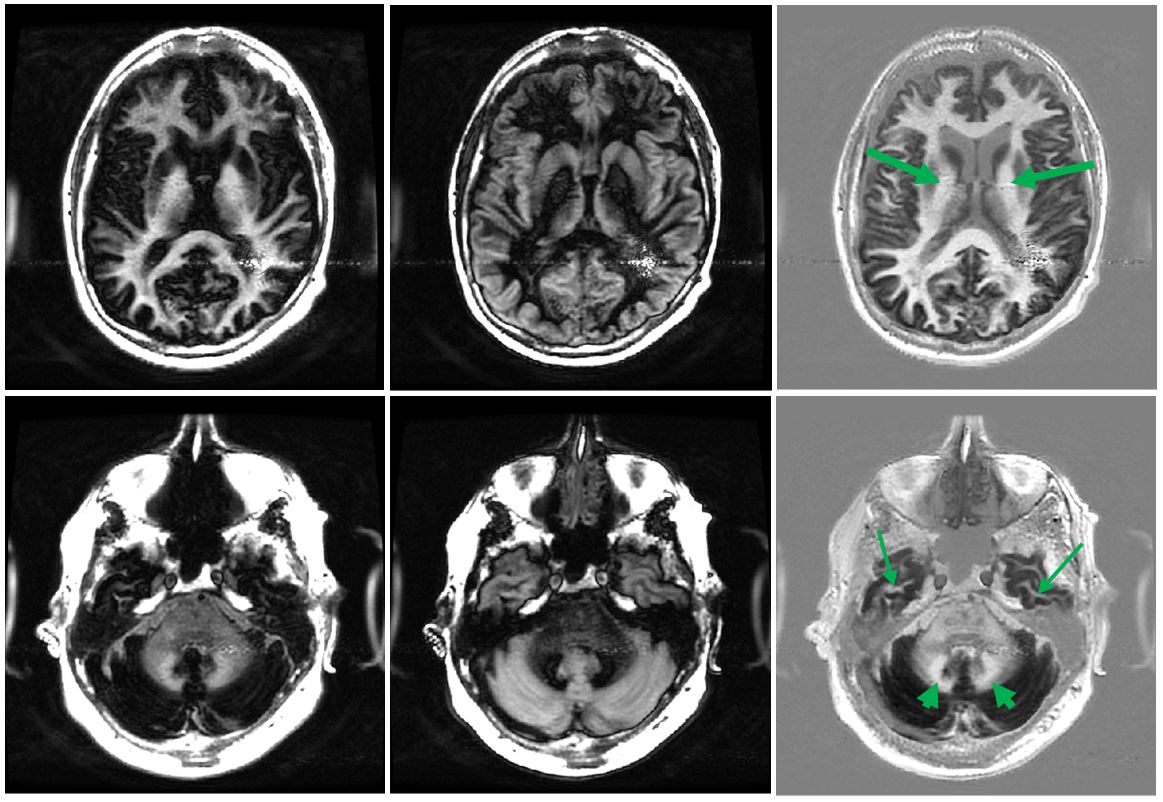
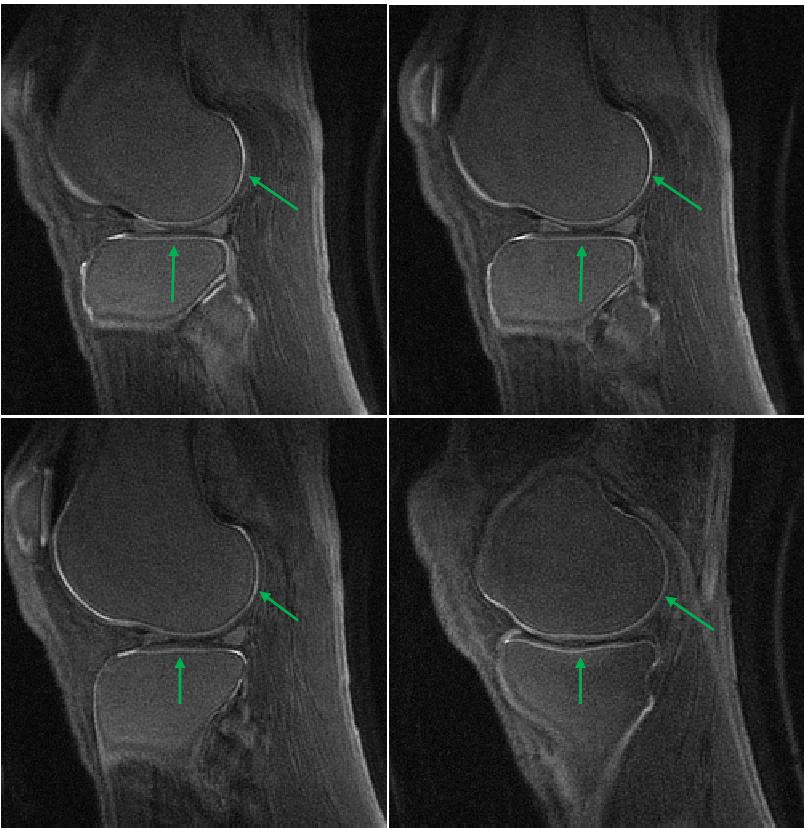
Clinically relevant applications were demonstrated. (i) Phase and magnitude images (with the same TI) from a volunteer brain were added or subtracted to produce images that showed either brain or fluid only, respectively (Fig. 3). (ii) Very high contrast images were obtained (Fig. 4) in the brain using the subtraction of a longer TI and shorter TI magnitude images. Gray/white structural details are clearly seen. (iii) A UTE IR prepped acquisition (with fat sat) was used to produce (m + p) images highlighting short T2 tissue in the deeper cartilage layers.DISCUSSION
A FSE single TI (m + p) technique can also be used to selectively image white matter in the brain without requiring two inversion pulses to null both grey matter and CSF as in the case with the conventional double inversion recovery (DIR) sequence2. In the (m – p) form it also allows selective imaging of fluids (e.g. CSF) using differences in T1, rather than T2 as is commonly done with CSF mapping and urography. The potential to increase the already heavy T1 weighting of the IR sequence over a chosen range of T1 values may prove to be valuable in detecting subtle disease. The EMPIRE technique with UTE detection allows short T2 components to be visualized (also providing long T2 suppression) without the need for a later echo subtraction which suffers from susceptibility effects. The technique differs from DIR in that it involves addition or subtraction of acquisitions with different TIs rather than multiplication of them. The same applies to the MP-2RAGE sequence where two acquisitions are multiplied together. The T1 weighing on subtracted images can be made to augment ρm and T2 contrast changes for lesions further enhancing their detectability.Acknowledgements
The authors acknowledge grant support from NIH (1R01 AR062581-01A1, 1 R01 AR068987-01 and 1R01 NS092650).References
1. Bydder GM, Young IR. J Comput Assist Tomogr 1985;9:659-675
2. Redpath TW, Smith FW. Br J Radiol 1994;67:1258-1263
Figures