2295
The Hematocrit Dependence of Blood T2 Relaxometry Parameters in the Weak Field Approximation1Athinoula A. Martinos Center for Biomedical Imaging, Department of Radiology, Harvard Medical School, Massachusetts General Hospital, Charlestown, MA, United States, 2Department of Biomedical Engineering, McGill University, Montreal, QC, Canada, 3Division of Health Science and Technology, Massachusetts Institute of Technology, Cambridge, MA, United States, 4Department of Radiology and Hotchkiss Brain Institute, University of Calgary, Calgary, AB, Canada
Synopsis
The weak field approximation (WFA) is a theory that relates T2 relaxation from tissue to the underlying tissue properties and is commonly applied to the analysis of relaxation from red blood cells (RBCs) in blood. This study examines the hematocrit-dependence of the different parameters of the WFA using simulated populations of RBCs and published experimental relaxometry results from two studies. Both the simulations and the experimental results show an unexpected result that the characteristic perturber size estimate is not constant with hematocrit but is negatively correlated with it. This has important implications for the implementation and interpretation of the WFA theory on blood relaxometry data.
Introduction
The weak field approximation (WFA) relates T2 relaxation from tissues in the motional narrowing regime to the underlying tissue properties1 and is commonly applied to study relaxation from red blood cells (RBCs) in blood.1–4 A critical assumption of the WFA is that the magnetic perturber positions are uncorrelated, allowing for the unrealistic possibility of physically overlapping perturbers. In blood, where the volume fraction of RBCs (hematocrit) is ~40%, this assumption is violated, yet the model still performs statistically well.1–4 The aim of this study, therefore, was to determine the dependence of the WFA’s parameters on the hematocrit of blood. This was examined using simulated populations of spherical perturbers and analyzing experimental T2 relaxometry results from blood samples with wide ranges of hematocrit and blood oxygenation (SO2).Theory
The WFA was derived by assuming that the field offsets generated by the system of perturbers have a radial correlation, G(r), that follows the relationship$$G(r)=G_0\text{exp}[-(r/r_c)^2],$$ where G0 is the mean square field inhomogeneity of the system and rc is a characteristic length of the field perturbations. G0 is related to the susceptibility offset between the perturbers and the external medium (Δχ), hematocrit (Hct), and B0 by1,5$$G_0=\frac{4}{45}\text{Hct}(\Delta\chi\,B_0)^2$$For RBCs in plasma, $$$\Delta\chi=4\pi0.27\cdot(1-\text{SO}_2)\,\text{ppm}$$$.6 Kiselev and Novikov7 proposed that Hct be replaced with $$$\text{Hct}(1-\text{Hct})$$$ to account for the effect of non-overlapping perturbers as the hematocrit is increased. rc depends only on the specific geometry of the perturbers. Therefore, G0 is predicted to have a linear or quadratic dependence on hematocrit and rc is predicted to be independent of hematocrit.
In a Carr-Purcell-Meiboom-Gill (CPMG) experiment, the measured relaxation rates' dependence on the WFA parameters is$$ R_2=R_{2,0}+\gamma^2\,G_0\,\frac{r_c^2}{2D}\,F\left(\tau_{180}\frac{2D}{r_c^2}\right)$$ where τ180 is the refocusing interval, R2,0 is the relaxation rate in the limit τ180$$$\rightarrow0$$$, D is the diffusion coefficient, and F(x) is defined in ref 2. R2,0’s relationship to hematocrit and SO2 is well documented and not explored here.8
Methods
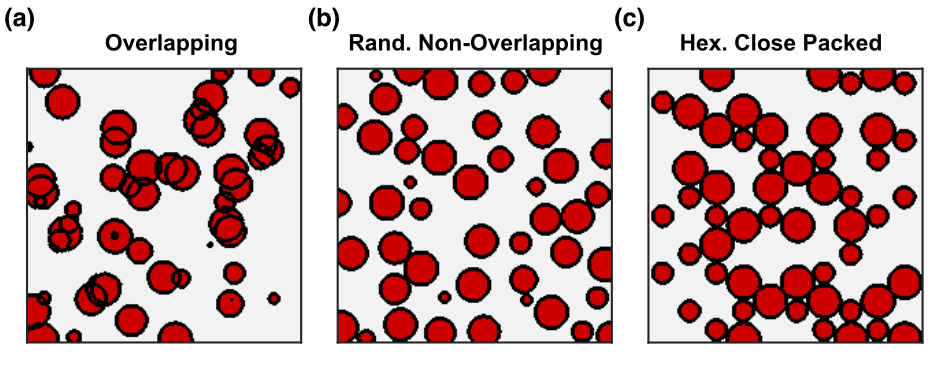
Multiple three-dimensional populations of RBCs were generated in silico with hematocrit ranging from 3–60%. Populations were composed of spherical (R=3 μm) perturbers in three different spatial distributions where the perturbers could either overlap or not (Fig. 1). The radial correlation functions for each distribution were computed and G0 and rc were determined by fitting to Eq. (1). The transverse signal was simulated from the different populations using the deterministic diffusion method and compared against a closed-form solution of the WFA that describes the transverse signal evolution using the fitted G0 and rc.9
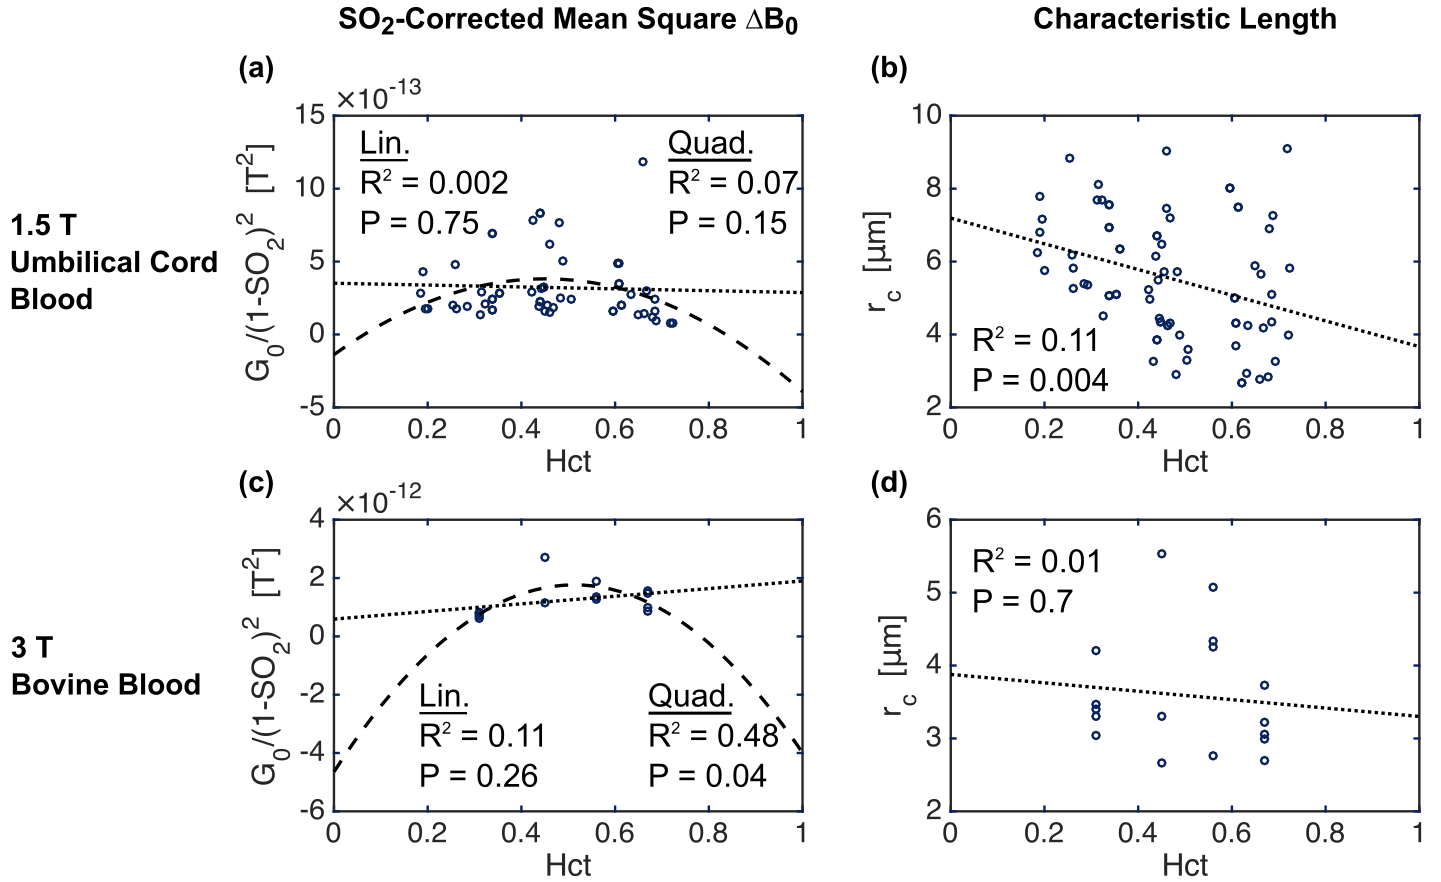
The impact of varying hematocrit on the WFA parameters was examined experimentally using two published relaxometry datasets with wide ranges of hematocrit and SO2. One consisted of R2 measurements at 1.5T in 88 human umbilical cord blood specimens from 6 caesarian deliveries.10 The second study consisted of R2 measurements at 3T in 20 bovine blood specimens.11 The R2 values from each specimen were fit to Eq. (3), resulting in estimates for G0, rc, and R2,0. These parameter estimates were then tested for linear trends vs. hematocrit, and G0 was tested for a quadratic dependence on hematocrit. G0’s dependence on SO2 was controlled for by dividing by (1-SO2)2.
Results
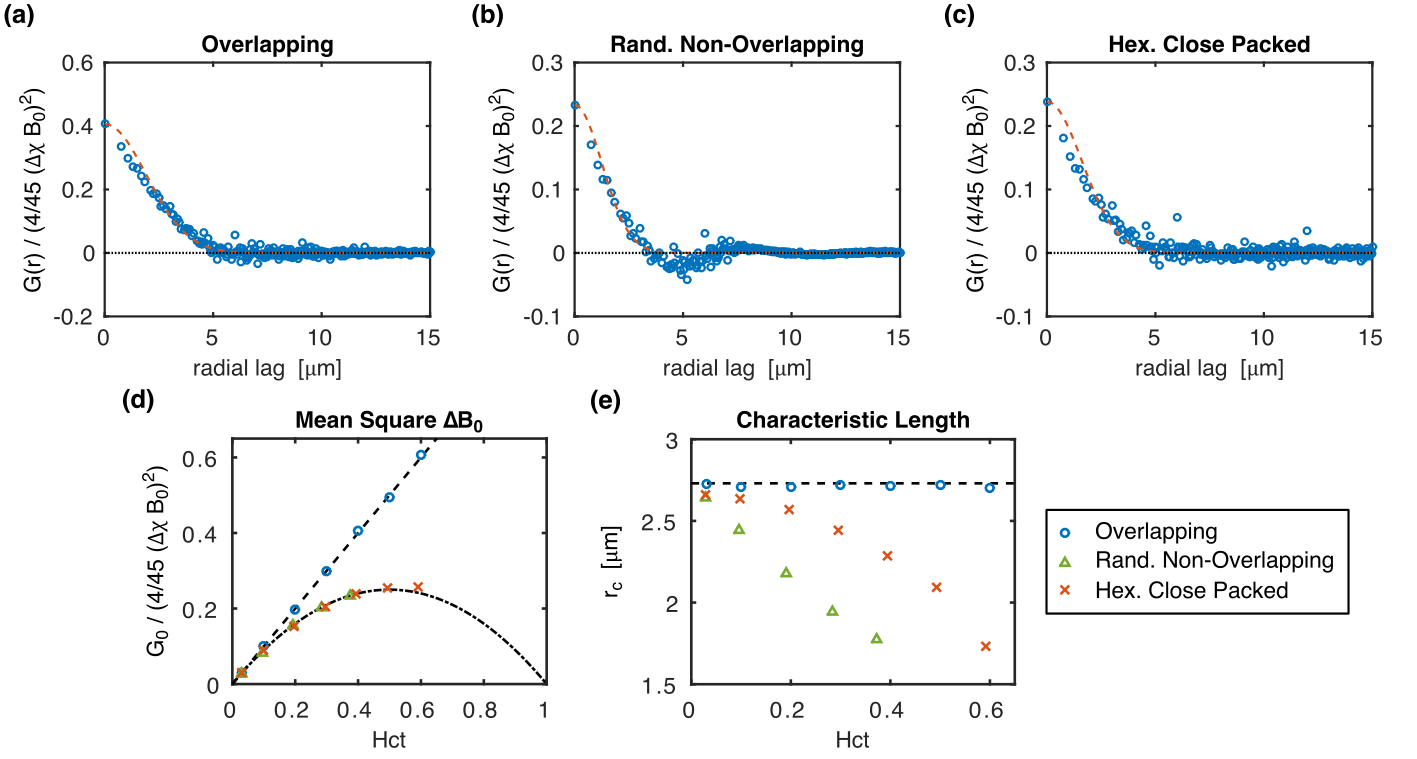
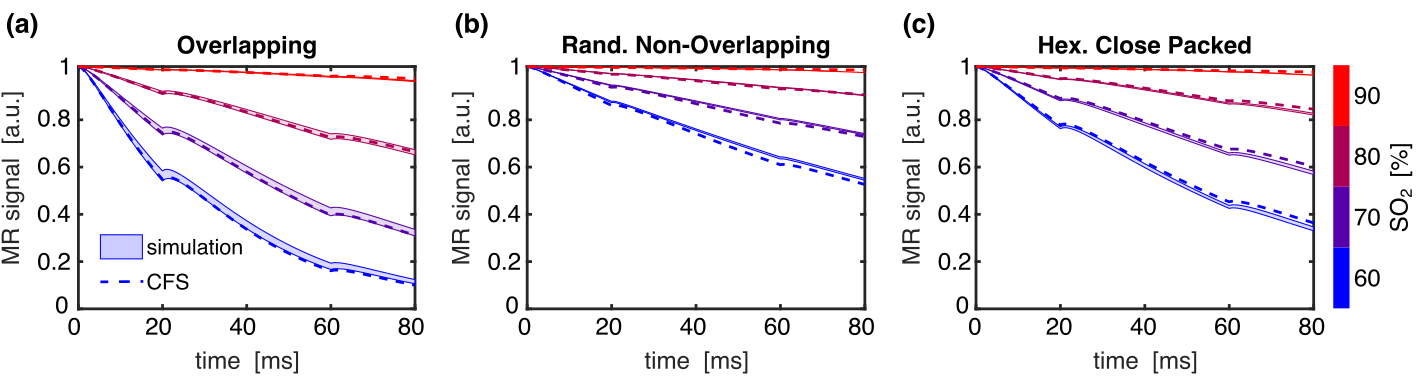
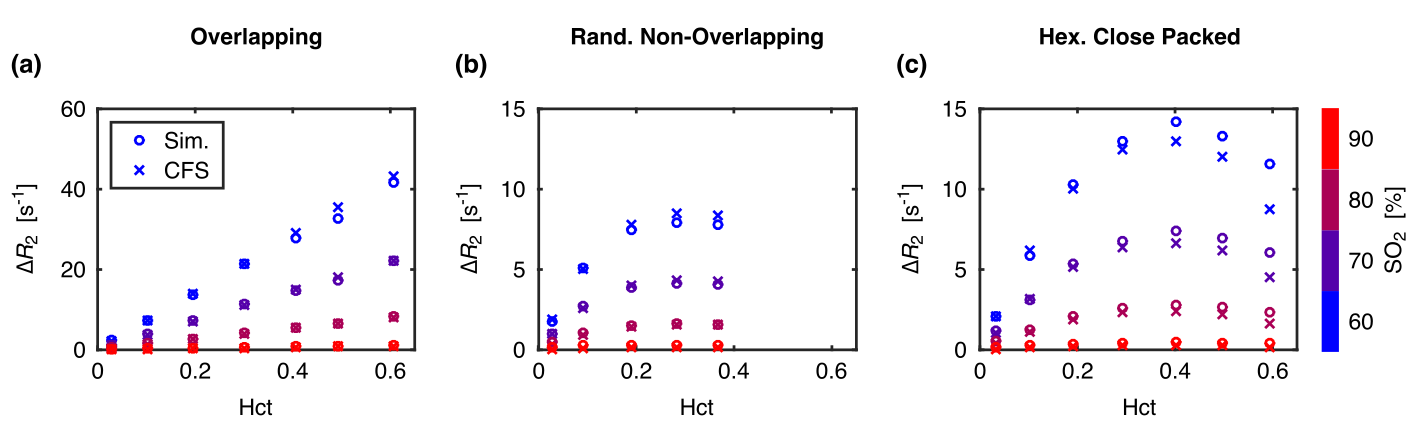
Example radial correlation functions from three different sphere distributions, along with their fits to Eq. (1), are shown in Figs. 2a–c. The fitted G0 and rc for all the distributions are shown in Figs. 2d–e. G0 is linearly dependent on hematocrit when the perturbers can overlap but quadratically dependent when they cannot. rc is independent of hematocrit when the perturbers can overlap but, unexpectedly, is negatively correlated with hematocrit when they cannot. Example simulations from the three distributions compared against the predicted signal evolution from the WFA closed-form solution (CFS) are shown in Fig. 3. The agreement between the simulated and predicted signals was evaluated using the relaxation rates and is accurate up to Hct ≈ 50% (Fig. 4).
Similar trends were observed in the experimental data of both studies (Fig. 5). Although not all tests were statistically significant, a quadratic fit of G0 vs. hematocrit outperformed the linear fit, and rc did tend to negatively correlate with hematocrit.
Discussion and Conclusions
This study shows for the first time how rc decreased in proportion to hematocrit when RBCs cannot overlap. The rate of decrease also depended on the spatial distribution of the RBCs. This is unexplained by current theory, where no hematocrit dependence of rc is predicted.1,5 The simulation results show that G0 is proportional to $$$\text{Hct}(1-\text{Hct})$$$ when the RBCs do not overlap, as predicted.7
The experimental results corroborated these findings, although experimental and biological variability likely decreased the statistical significance of some of the relationships. This suggests that fits to blood relaxometry data may require a correction to account for the hematocrit dependence of rc.
Acknowledgements
The authors would like to thank Drs. Portnoy and Grgac for sharing their relaxometry data with us. AB and BP would like to recognize financial support from the Canadian Institutes of Health Research (FDN 143290) and the Campus Alberta Innovates Program and computing support from WestGrid and Compute Canada.References
- Jensen, J.H. and R. Chandra, NMR relaxation in tissues with weak magnetic inhomogeneities. Magn Reson Med, 2000. 44(1): p. 144-56.
- Stefanovic, B. and G.B. Pike, Human whole-blood relaxometry at 1.5 T: Assessment of diffusion and exchange models. Magn Reson Med, 2004. 52(4): p. 716-23.
- Chen, J.J. and G.B. Pike, Human whole blood T2 relaxometry at 3 Tesla. Magn Reson Med, 2009. 61(2): p. 249-54.
- Gardener, A.G., et al., Dependence of blood R2 relaxivity on CPMG echo-spacing at 2.35 and 7 T. Magn Reson Med, 2010. 64(4): p. 967-74.
- Sukstanskii, A.L. and D.A. Yablonskiy, Gaussian approximation in the theory of MR signal formation in the presence of structure-specific magnetic field inhomogeneities. J Magn Reson, 2003. 163(2): p. 236-47.
- Spees, W.M., et al., Water proton MR properties of human blood at 1.5 Tesla: magnetic susceptibility, T(1), T(2), T*(2), and non-Lorentzian signal behavior. Magn Reson Med, 2001. 45(4): p. 533-42.
- Kiselev, V.G. and D.S. Novikov, Transverse NMR relaxation as a probe of mesoscopic structure. Physical Review Letters, 2002. 89(27).
- van Zijl, P.C., et al., Quantitative assessment of blood flow, blood volume and blood oxygenation effects in functional magnetic resonance imaging. Nat Med, 1998. 4(2): p. 159-67.
- Berman, A.J. and G.B. Pike. A general solution for transverse signal decay under the weak field approximation: theory and validation with spherical perturbers. in 24th International Society of Magnetic Resonance in Medicine Annual Meeting. 2016. Singapore.
- Portnoy, S., et al., Relaxation properties of human umbilical cord blood at 1.5 Tesla. Magn Reson Med, 2017. 77(4): p. 1678-1690.
- Grgac, K., et al., Transverse water relaxation in whole blood and erythrocytes at 3T, 7T, 9.4T, 11.7T and 16.4T; determination of intracellular hemoglobin and extracellular albumin relaxivities. Magn Reson Imaging, 2017. 38: p. 234-249.
Figures